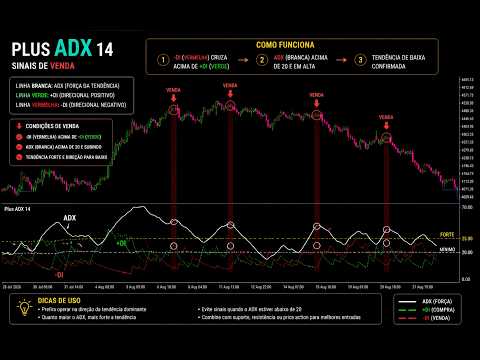
Plus ADX 14

Plus ADX 14 — Trend Strength and Direction

The Plus ADX 14 is a technical indicator for MetaTrader 5 designed to facilitate the analysis of market strength and prevailing direction.

The indicator is displayed in a separate window, with a scale from 0 to 100, combining ADX with the two directional components +DI and -DI .

Visual Elements

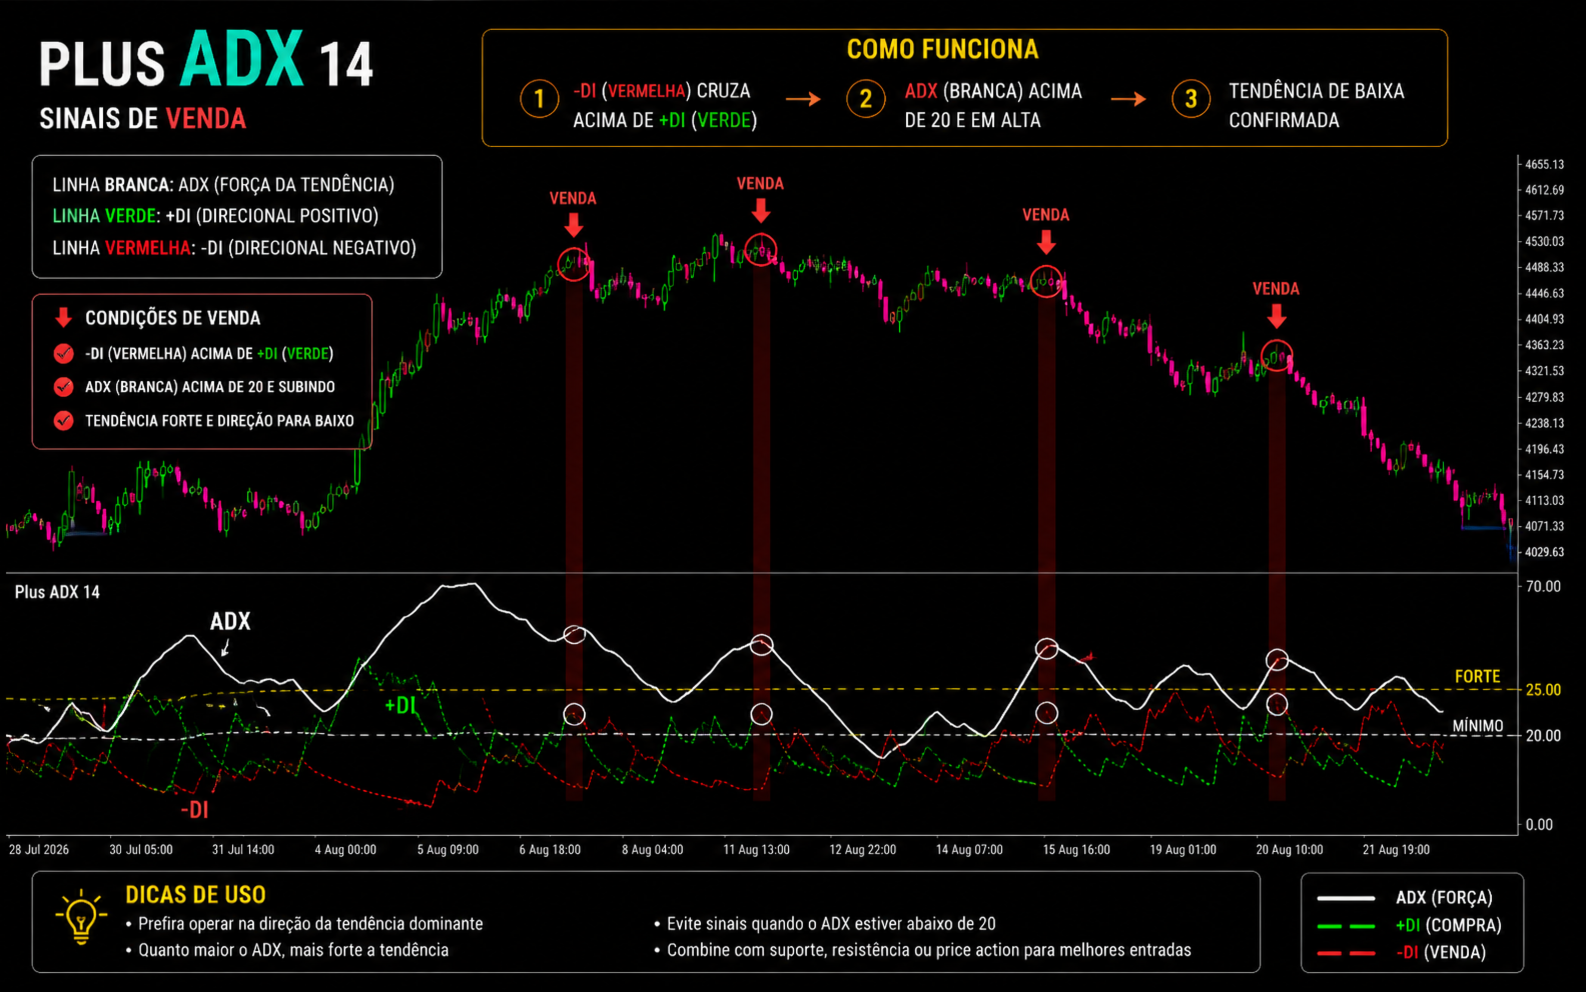
  • White ADX line: measures trend strength.
  • Green +DI line: represents positive directional strength.
  • Red -DI line: represents negative directional strength.
  • Level 20: reference for lower-intensity movements.
  • Level 25: main reference for trend confirmation.
  • Level 70: high-intensity region.

Automatic Market Identification

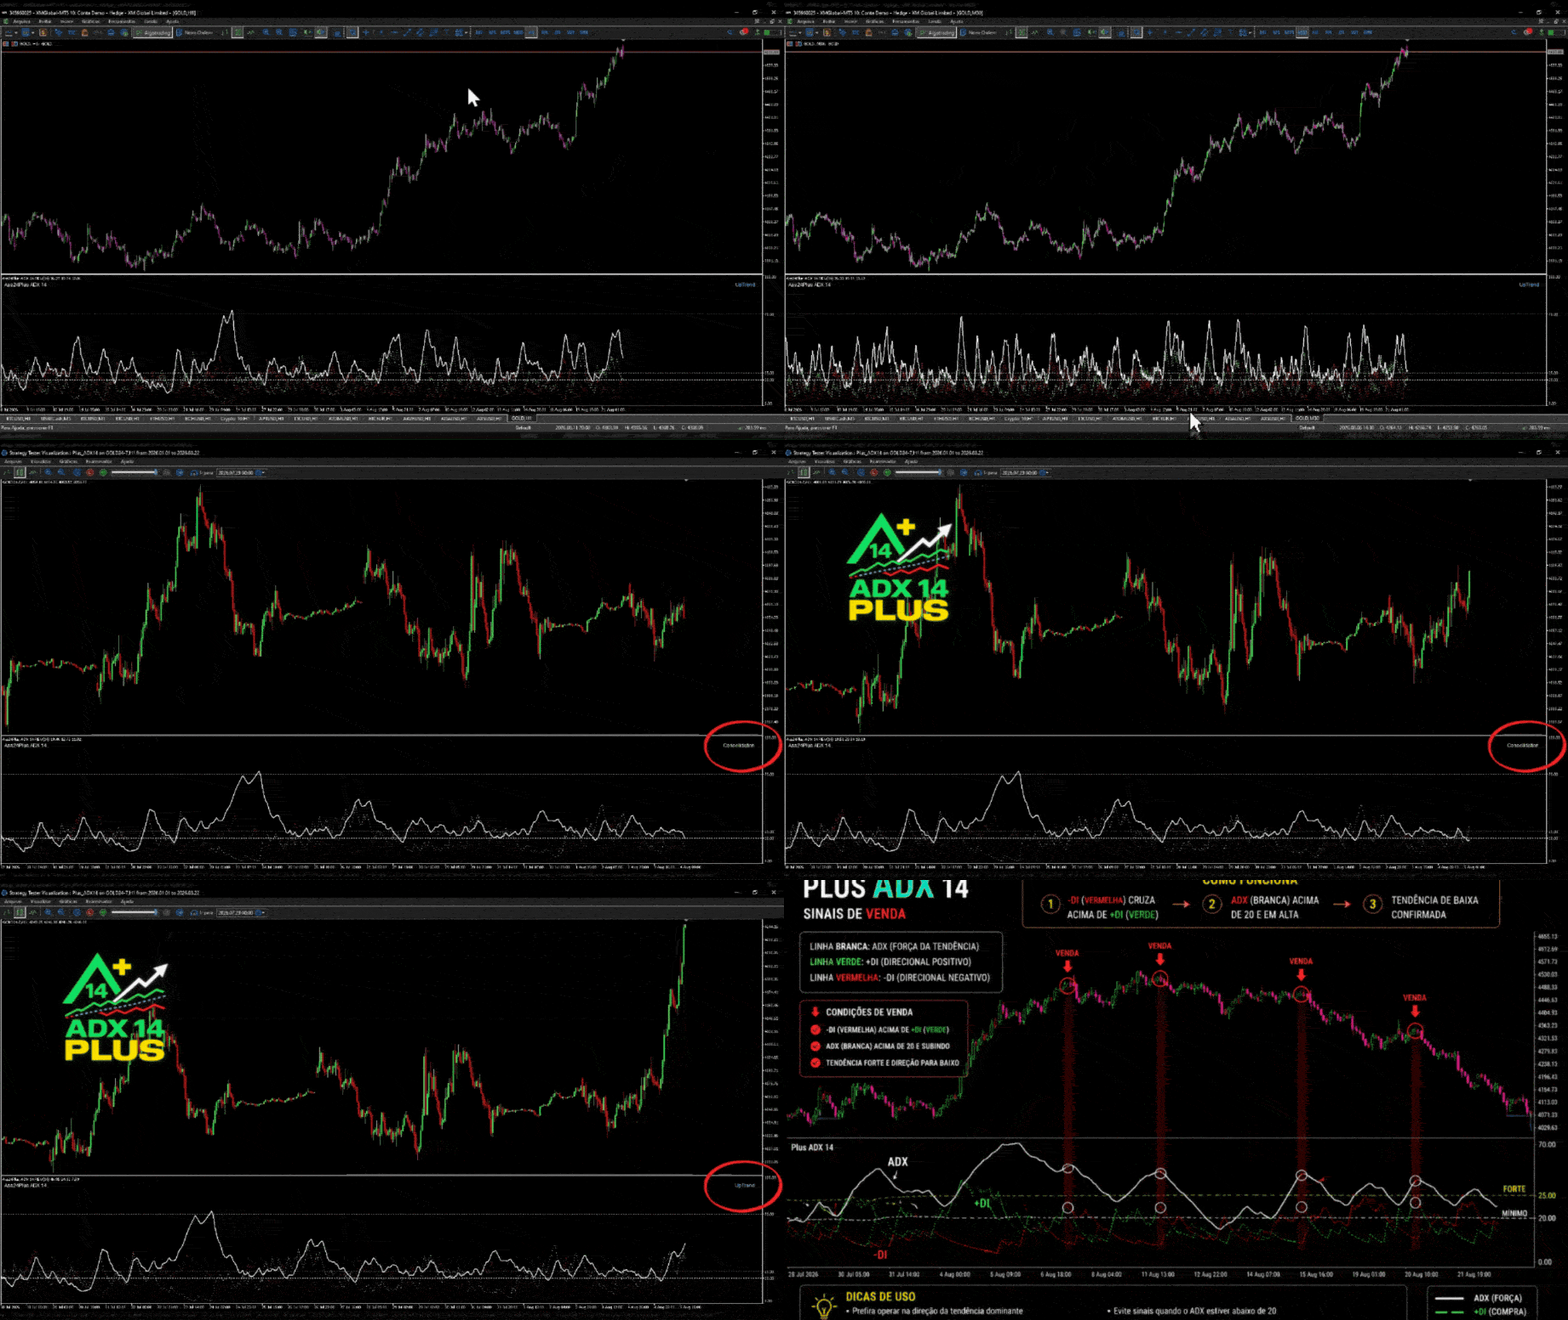
Plus ADX 14 displays an automatic classification of the current market state in the upper-right corner of the subwindow:

  • Consolidation: ADX is below the configured level or the directional lines are very close to each other.
  • UpTrend: ADX meets the minimum level and +DI is above -DI .
  • DownTrend: ADX meets the minimum level and -DI is above +DI .

The classification summarizes the current mathematical condition of the indicator. It does not represent an automatic buy or sell order.

How to Interpret

A rising ADX may indicate strengthening market movement, regardless of its direction.

The prevailing direction can be observed through the relationship between the directional lines:

  • +DI above -DI : predominance of positive strength.
  • -DI above +DI : predominance of negative strength.
  • Lines very close to each other: less defined directional movement.

An ADX below the configured trend level may indicate consolidation or insufficient market strength. An ADX above this level suggests greater directional intensity.

Available Parameters

InpPeriodADX — ADX Period

Defines the period used in the calculations of ADX, +DI , and -DI .

Default value: 14.

Lower periods make the indicator more sensitive. Higher periods produce a smoother reading.

InpTrendLevelADX — Minimum Trend Level

Defines the minimum ADX value used by the automatic market-state classification.

Default value: 25.

Changing this parameter affects the classification between consolidation and trend.

Main Features

  • ADX, +DI , and -DI in a single subwindow.
  • Scale from 0 to 100.
  • Configurable period.
  • Configurable minimum trend level.
  • Automatic identification of consolidation, uptrend, or downtrend.
  • Optimized incremental calculation.
  • Compatible with different assets and timeframes.
  • Compatible with the MetaTrader 5 Visual Tester.
  • Prepared for real-tick based testing.
  • Does not open, modify, or close trades.

Possible Applications

The indicator can assist in the analysis of:

  • Presence or absence of a trend.
  • Market movement strength.
  • Buying or selling pressure predominance.
  • Consolidation.
  • Directional strengthening or weakening.
  • Additional confirmation of breakouts.
  • Filtering trend-following strategies.

Compatibility with the Visual Tester

In the real-tick based model, the Strategy Tester may draw historical Bid and Ask trails on the main chart.

Plus ADX 14 includes specific protection to hide these trails during the Visual Tester. This protection does not modify chart settings in the live trading environment.

Important Note

Plus ADX 14 is a technical analysis tool. It does not execute trades and does not represent an automatic buy or sell recommendation.

The indicator should be used together with market context, risk management, and criteria defined by the user. No indicator can guarantee results or predict all market movements.
More from author
Plus BB Color
Leonel Alberto Jose Quintana
Plus BB Color The Plus BB Color is a visual indicator for MetaTrader 5 designed to make it easier to read the price position within a structure based on Bollinger Bands and a dynamic exponential moving average. The indicator combines upper and lower bands, a colored central line, and visual markings of possible price extremes, helping the user identify areas of expansion, deviation, and possible points of movement exhaustion. Main features Upper and lower bands calculated from configurable perio
FREE
Plus MACD AO
Leonel Alberto Jose Quintana
Plus MACD AO — Hybrid Indicator for MetaTrader 5 Plus MACD AO is an indicator developed for MetaTrader 5 that combines visual elements related to the MACD and Awesome Oscillator (AO) into a single tool. Its purpose is to make market dynamics easier to interpret through a combined visual reading of momentum, strength, and potential buy and sell triggers. The indicator operates in a separate window below the main chart and displays different graphical elements working together. AO Force AO Force i
FREE
Plus RSI 14
Leonel Alberto Jose Quintana
Plus RSI 14 — Relative Strength Index for MetaTrader 5 The Plus RSI 14 is a technical indicator for MetaTrader 5 developed to present, in a simple and objective way, the balance between buying and selling strength in the market. The indicator analyzes changes in closing prices over the selected period and presents the result on a scale from 0 to 100, within a separate window from the main chart. Its default configuration uses 14 periods and reference levels at 20 and 80. Main Features • Indicato
FREE
Plus RSI MA Color
Leonel Alberto Jose Quintana
Plus RSI MA Color — Dynamic and Color-Changing Trend Line The Plus RSI MA Color is a visual trend indicator for MetaTrader 5. It displays a smoothed line directly on the main chart that changes color according to the relationship between price movement and its internal reference. The purpose of the indicator is to make it easier to visually identify the prevailing market direction and possible transitions between buying and selling movements. How It Works The indicator uses the weighted price of

FREE
Plus HeikenAshi Plus HeikenAshi is a visual indicator for MetaTrader 5 designed to make it easier to read the direction and continuation of market movements through the Heiken Ashi representation. The indicator visually replaces traditional chart candles with candles calculated using the Heiken Ashi methodology, providing a more organized representation of price behavior. The candles are displayed in two colors, allowing different movement conditions to be identified visually. Main features Visu
FREE
Plus Donchian
Leonel Alberto Jose Quintana
Donchian Toshio — High and Low Price Channel for MetaTrader 5 Donchian Toshio displays a channel calculated from the highest highs and lowest lows recorded during the selected period. The indicator displays three lines: Upper line: the highest high of the period; Lower line: the lowest low of the period; Middle line: the average between the upper and lower boundaries. The channel can support the analysis of trends, consolidations, volatility, breakouts, and dynamic support and resistance areas.
FREE
Plus Color Bars
Leonel Alberto Jose Quintana
Plus Color Bars for MetaTrader 5 — Colored Bars on the Chart In this video, I present Plus Color Bars , an indicator created to make the reading of price movements clearer and more objective in MetaTrader 5. The indicator automatically colors each bar according to the direction of the period: Green when the close is equal to or higher than the open; Pink when the close is lower than the open. The bar display allows you to visualize the open, high, low, and close, helping to identify the directio
FREE
Plus Color Candles
Leonel Alberto Jose Quintana
Plus Color Candles — Colored Candles for MetaTrader 5 Plus Color Candles automatically displays colored candles according to the direction of each period. Bullish candles, where the close is equal to or higher than the open, are displayed in green. Bearish candles, where the close is lower than the open, are displayed in pink. The indicator preserves complete open, high, low, and close information, providing a clean and direct visualization of price behavior. Features: Bullish and bearish candle
FREE
Filter:
No reviews
Reply to review