Pro Zona de Liquidez
- Indicators
- Version: 1.1
- Updated: 5 September 2026

Liquidity Zone for MetaTrader 5
Description
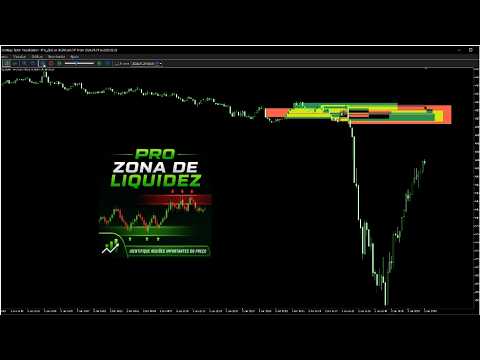
Liquidity Zone is an indicator developed for MetaTrader 5 that helps visually identify areas where relevant price movements have occurred.
The indicator analyzes candle ranges and compares the current movement with the average range of previous candles. When the range exceeds the level defined by the indicator settings, a zone corresponding to the candle area is created on the chart.
How It Works
Zones are differentiated according to candle direction. A buy zone corresponds to a candle that closes above its opening price. A sell zone corresponds to a candle that closes below its opening price.
Zones can be extended to the right side of the chart, allowing these areas to remain visible as new candles are formed.
The indicator allows you to configure the analysis period, detection sensitivity, zone extension and maximum number of zones displayed simultaneously.
Parameters
Lookback Bars
Defines the number of candles used in the analysis.
Extend Bars
Defines how many bars the zones are extended to the right.
Range Mult
Controls the sensitivity used for detection. Higher values make the criteria more selective, while lower values allow more areas to be identified.
Max Zones
Defines the maximum number of zones displayed simultaneously on the chart.
Usage
Liquidity Zone can be used as a complementary tool for Price Action, support and resistance, trend analysis and other forms of technical analysis.
The indicator can be applied to instruments and chart timeframes available in MetaTrader 5.
The displayed areas represent movements identified from the price history analyzed by the indicator.
Important
Liquidity Zone is a technical analysis and decision-support tool. The indicator does not predict future market movements and does not guarantee financial results. The information displayed should be evaluated according to the market context and the trader's own analysis and risk management criteria.