Master SuperTrend

Master SuperTrend for MetaTrader 5

Description

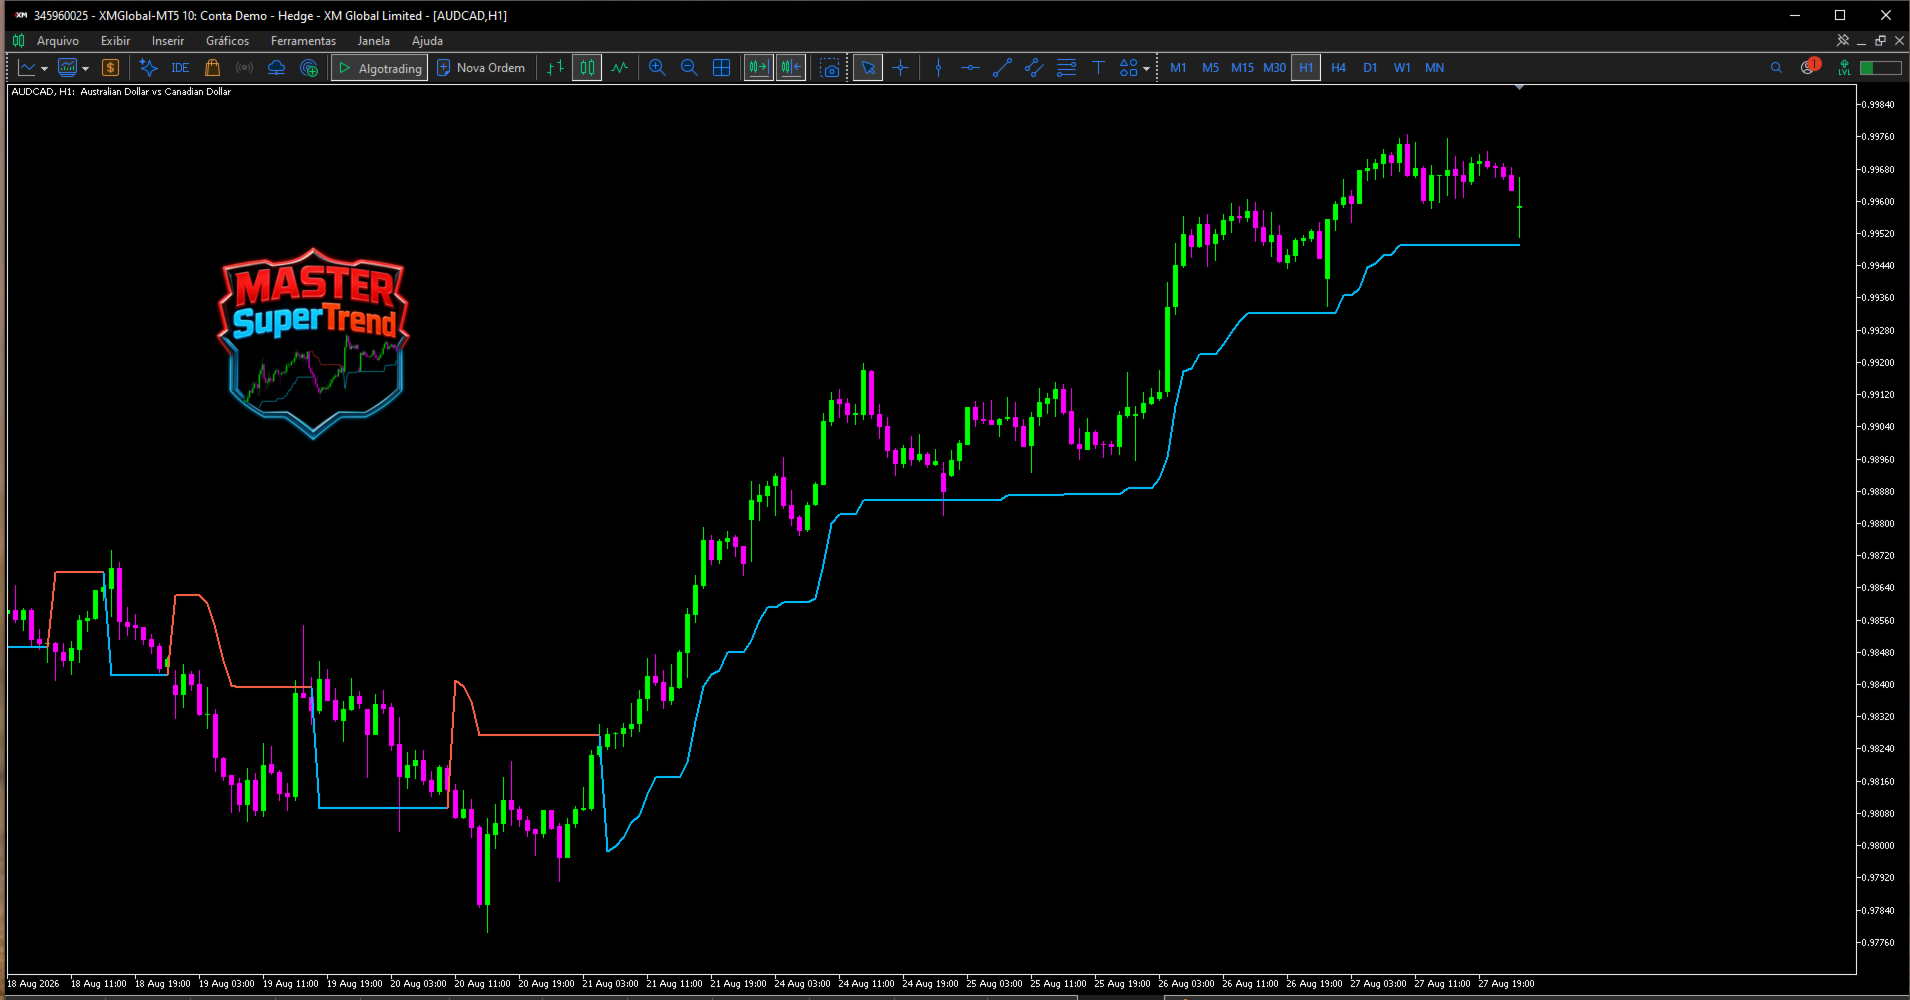
Master SuperTrend is a technical indicator developed for MetaTrader 5 to provide a clear visual representation of market trend direction based on price movement and volatility.

The indicator uses the classic SuperTrend calculation based on Average True Range (ATR). It combines current price behavior with market volatility to calculate a dynamic trend line that follows price movements on the chart.

Trend Analysis

Master SuperTrend automatically identifies the current directional state and adjusts its line as new price data is received.

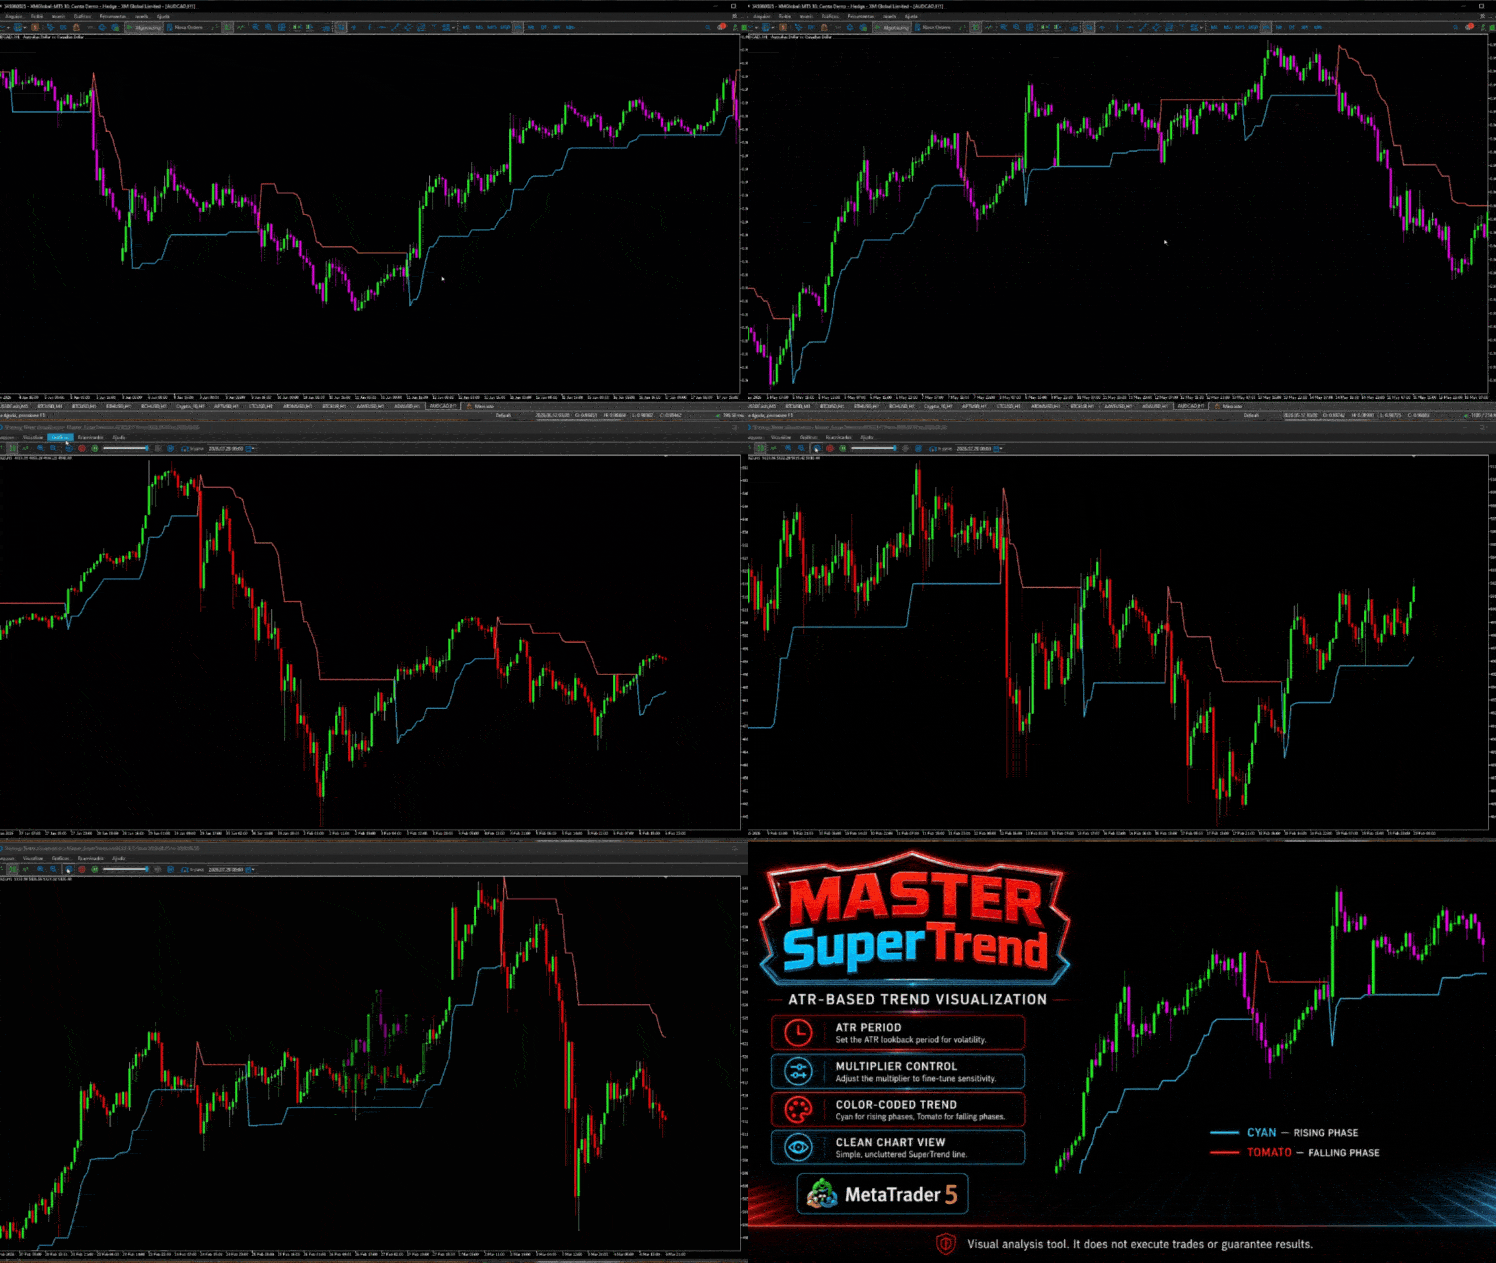
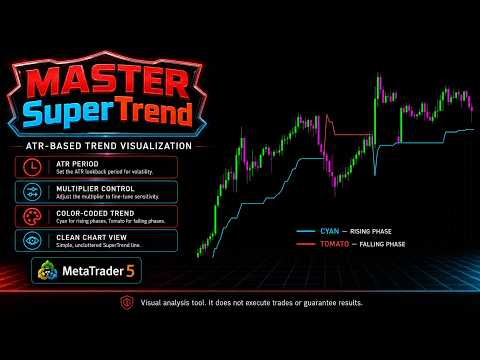
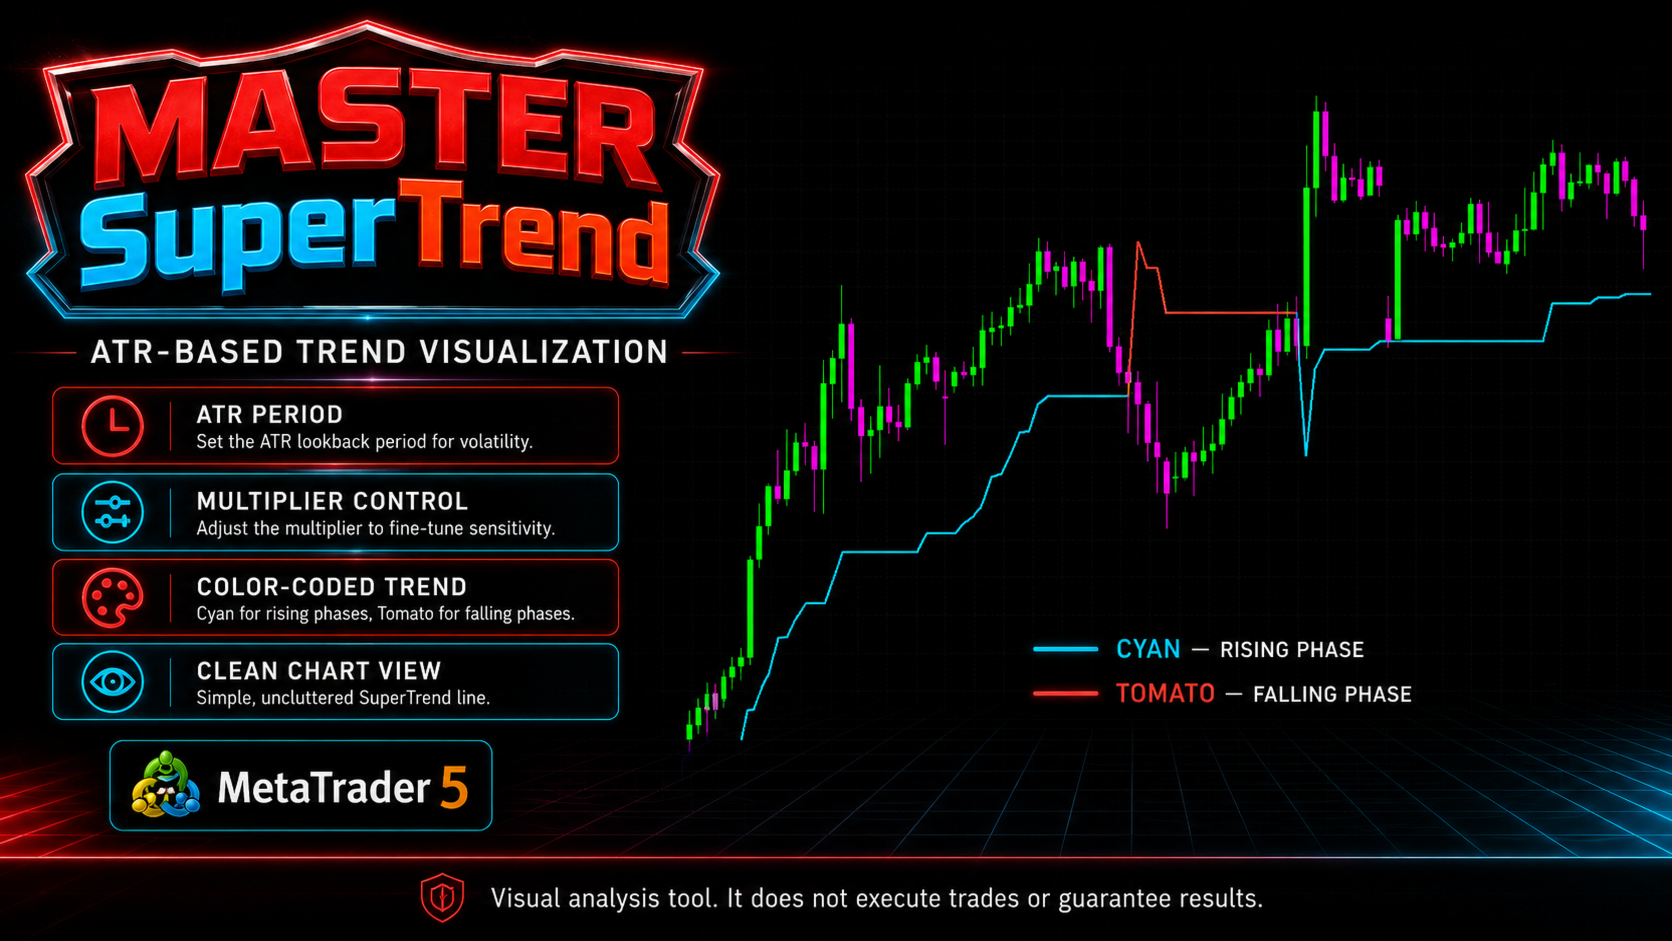
When the calculated structure indicates an upward trend, the SuperTrend line is displayed below the price using the bullish color. When the structure indicates a downward trend, the line is displayed above the price using the bearish color.

A change in the position and color of the line represents a change in the directional state calculated by the indicator.

ATR and Volatility

The distance between the SuperTrend line and price is calculated using Average True Range. This allows the indicator to adapt its structure according to the volatility observed in the market.

The ATR period and multiplier can be configured, allowing the sensitivity of the SuperTrend calculation to be adjusted for different instruments and chart timeframes.

Master Score and State

In addition to the visual SuperTrend line, the indicator calculates internal Score and State information representing the detected directional condition.

The Score uses a scale from -100 to +100. Positive values represent a bullish directional state and negative values represent a bearish directional state. Changes in direction receive a stronger score than trend continuation.

The State identifies whether the current calculated structure is bullish or bearish.

Parameters

ATR Period
Defines the period used for the Average True Range calculation.

Multiplier
Defines the ATR multiplier used to calculate the distance of the SuperTrend bands from price. Higher values generally produce a wider distance from price, while lower values make the calculation more sensitive to price movements.

Main Features

Master SuperTrend provides automatic trend direction analysis, volatility-adaptive SuperTrend calculation, bullish and bearish visual states, configurable ATR period and multiplier, internal directional Score and State, and direct visualization on the MetaTrader 5 price chart.

Usage

Master SuperTrend can be used as a complementary tool for trend analysis, directional market reading and identification of changes in the calculated trend structure.

The indicator can be applied to different instruments and chart timeframes available in MetaTrader 5. Its parameters can be adjusted according to the characteristics of the instrument and the analysis method used by the trader.

Important

Master SuperTrend is a technical analysis and decision-support tool. The indicator does not predict future market movements and does not guarantee financial results. Its information should be evaluated together with market context, the trader's analysis method and appropriate risk management criteria.
More from author
Plus MACD AO
Leonel Alberto Jose Quintana
Plus MACD AO — Hybrid Indicator for MetaTrader 5 Plus MACD AO is an indicator developed for MetaTrader 5 that combines visual elements related to the MACD and Awesome Oscillator (AO) into a single tool. Its purpose is to make market dynamics easier to interpret through a combined visual reading of momentum, strength, and potential buy and sell triggers. The indicator operates in a separate window below the main chart and displays different graphical elements working together. AO Force AO Force i
FREE
Plus BB Color
Leonel Alberto Jose Quintana
Plus BB Color The Plus BB Color is a visual indicator for MetaTrader 5 designed to make it easier to read the price position within a structure based on Bollinger Bands and a dynamic exponential moving average. The indicator combines upper and lower bands, a colored central line, and visual markings of possible price extremes, helping the user identify areas of expansion, deviation, and possible points of movement exhaustion. Main features Upper and lower bands calculated from configurable perio
FREE
Plus RSI MA Color
Leonel Alberto Jose Quintana
Plus RSI MA Color — Dynamic and Color-Changing Trend Line The Plus RSI MA Color is a visual trend indicator for MetaTrader 5. It displays a smoothed line directly on the main chart that changes color according to the relationship between price movement and its internal reference. The purpose of the indicator is to make it easier to visually identify the prevailing market direction and possible transitions between buying and selling movements. How It Works The indicator uses the weighted price of
FREE
Plus RSI 14
Leonel Alberto Jose Quintana
Plus RSI 14 — Relative Strength Index for MetaTrader 5 The Plus RSI 14 is a technical indicator for MetaTrader 5 developed to present, in a simple and objective way, the balance between buying and selling strength in the market. The indicator analyzes changes in closing prices over the selected period and presents the result on a scale from 0 to 100, within a separate window from the main chart. Its default configuration uses 14 periods and reference levels at 20 and 80. Main Features • Indicato
FREE
Plus ADX 14
Leonel Alberto Jose Quintana
Plus ADX 14 — Trend Strength and Direction The Plus ADX 14 is a technical indicator for MetaTrader 5 designed to facilitate the analysis of market strength and prevailing direction. The indicator is displayed in a separate window, with a scale from 0 to 100, combining ADX with the two directional components +DI and -DI . Visual Elements White ADX line: measures trend strength. Green +DI line: represents positive directional strength. Red -DI line: represents negative directional strength. Level
FREE
Plus HeikenAshi Plus HeikenAshi is a visual indicator for MetaTrader 5 designed to make it easier to read the direction and continuation of market movements through the Heiken Ashi representation. The indicator visually replaces traditional chart candles with candles calculated using the Heiken Ashi methodology, providing a more organized representation of price behavior. The candles are displayed in two colors, allowing different movement conditions to be identified visually. Main features Visu
FREE
Plus Donchian
Leonel Alberto Jose Quintana
Donchian Toshio — High and Low Price Channel for MetaTrader 5 Donchian Toshio displays a channel calculated from the highest highs and lowest lows recorded during the selected period. The indicator displays three lines: Upper line: the highest high of the period; Lower line: the lowest low of the period; Middle line: the average between the upper and lower boundaries. The channel can support the analysis of trends, consolidations, volatility, breakouts, and dynamic support and resistance areas.
FREE
Pro Zona de Liquidez
Leonel Alberto Jose Quintana
Liquidity Zone for MetaTrader 5 Description Liquidity Zone is an indicator developed for MetaTrader 5 that helps visually identify areas where relevant price movements have occurred. The indicator analyzes candle ranges and compares the current movement with the average range of previous candles. When the range exceeds the level defined by the indicator settings, a zone corresponding to the candle area is created on the chart. How It Works Zones are differentiated according to candle direction.
FREE
Plus Channel RSI
Leonel Alberto Jose Quintana
Plus Channel RSI — RSI with Dynamic Channel for MetaTrader 5 Plus Channel RSI combines the Relative Strength Index with a dynamic channel calculated from the recent behavior of the RSI itself. In addition to the main RSI line, the indicator displays upper and lower limits and a center line. The channel follows the indicator's fluctuations, providing an adaptive visual reference for analyzing momentum, strength, possible extremes, and changes in market behavior. Unlike fixed horizontal levels, th
FREE
Plus FlowProfile
Leonel Alberto Jose Quintana
Plus FlowProfile — BUY and SELL Directional Zones for MT5 Plus FlowProfile expands traditional profile analysis by separating the analysis into directional buying and selling stages. When used individually, the compact FLOW BUY / FLOW SELL button allows you to quickly switch between the lower buy profile and the upper sell profile. When integrated with the Indicator Center or EA Assistant, the state is controlled directly by the system controls. Main features: BUY and SELL directional modes; Tog
FREE
Pro Candles
Leonel Alberto Jose Quintana
Pro Candles — Identificação visual de candles de reversão O Pro Candles é um indicador desenvolvido para destacar possíveis candles de reversão diretamente no gráfico do MetaTrader 5. Ele analisa o tamanho do corpo dos candles, compara esse movimento com a média recente e procura formações direcionais de engolfo. Quando encontra uma configuração compatível com seus critérios, o indicador exibe uma seta próxima ao candle analisado. Principais recursos Identificação visual de possíveis reversões d
FREE
Plus FlowProfile Volume
Leonel Alberto Jose Quintana
lus FlowProfile Volume — Tick Volume Profile for MetaTrader 5 Plus FlowProfile Volume transforms the tick volume of visible bars into an easy-to-read horizontal histogram on the main MetaTrader 5 chart. The indicator helps visualize where there was greater or lower concentration of activity within the analyzed price range. The most relevant regions receive visual highlighting, making it easier to identify areas that may act as support, resistance, price acceptance, or price rejection. Main featu
FREE
Plus Color Candles
Leonel Alberto Jose Quintana
Plus Color Candles — Colored Candles for MetaTrader 5 Plus Color Candles automatically displays colored candles according to the direction of each period. Bullish candles, where the close is equal to or higher than the open, are displayed in green. Bearish candles, where the close is lower than the open, are displayed in pink. The indicator preserves complete open, high, low, and close information, providing a clean and direct visualization of price behavior. Features: Bullish and bearish candle
FREE
Master RegChan
Leonel Alberto Jose Quintana
Master REG Channel for MetaTrader 5 Master REG Channel is a technical indicator for MetaTrader 5 based on linear regression, designed to assist in analyzing market direction, slope, price position, and movement behavior within a statistical channel. The indicator calculates a central linear regression line and two outer bands based on price dispersion around the regression. This structure helps visualize the prevailing movement direction and the current price position within the channel. Channel
FREE
Pro Trend MA
Leonel Alberto Jose Quintana
Pro Trend MA for MetaTrader 5 Description Pro Trend MA is a technical indicator developed for MetaTrader 5 that displays a smoothed trend line directly on the main price chart. The indicator calculates a weighted price using the high, low and close values of each candle. This price is processed through a configurable smoothing calculation to create the main trend line. A second calculation based on an exponential moving average is used internally as a signal line. The relationship between the ma
FREE
Pro Spread
Leonel Alberto Jose Quintana
Pro Spread — Spread, GARCH Volatility and Intelligent Market Reading Pro Spread is a professional indicator for MetaTrader 5 that combines spread analysis with a GARCH(1,1) volatility model, providing a normalized reading of current market conditions. In an organized subwindow, the indicator displays the Smart Score , the spread score, and the GARCH estimate. This information helps the user identify periods of compression, normal conditions, expansion, and extreme volatility. Pro Spread does not
Master HMA
Leonel Alberto Jose Quintana
Master HMA for MetaTrader 5 Master HMA is a technical indicator for MetaTrader 5 that combines different Hull Moving Average calculations into a visual structure designed to analyze price direction, slope, and movement behavior. The indicator uses three HMA periods: Fast, Main, and Slow. The relationship between these lines helps identify changes in the movement structure and follow different market phases. The Main HMA uses different colors to represent the states identified by the system. The
Master PSAR
Leonel Alberto Jose Quintana
Master PSAR for MetaTrader 5 Description Master PSAR is a technical indicator developed for MetaTrader 5 based on the classic Parabolic SAR method created by J. Welles Wilder. The indicator places dynamic points above or below the price according to the directional state calculated by the Parabolic SAR formula. When the calculated state is bullish, the PSAR points are displayed below the price. When the calculated state is bearish, the points are displayed above the price. Trend Analysis Master
FREE
Filter:
No reviews
Reply to review