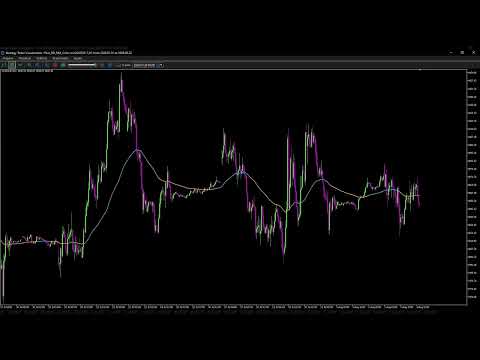
Plus RSI MA Color
- Indicators
- Version: 1.2
- Updated: 5 September 2026

Plus RSI MA Color — Dynamic and Color-Changing Trend Line
The Plus RSI MA Color is a visual trend indicator for MetaTrader 5. It displays a smoothed line directly on the main chart that changes color according to the relationship between price movement and its internal reference.
The purpose of the indicator is to make it easier to visually identify the prevailing market direction and possible transitions between buying and selling movements.
How It Works
The indicator uses the weighted price of each candle, considering the high, low, and close. This price then goes through an adjustable smoothing process.
The smoothed line is then compared with an internal exponential moving average used as a directional reference.
The line uses two colors:
- Blue: the smoothed line is equal to or above the exponential reference.
- Orange: the smoothed line is below the exponential reference.
The color change helps track changes in the direction and recent strength of the movement. It should not be interpreted in isolation as a guarantee of an entry or reversal.
Main Features
- Trend line displayed directly on the main chart.
- Automatic color changes.
- Simple and objective visual reading.
- Adjustable smoothing.
- Adjustable exponential reference.
- Optimized incremental calculation.
- Compatible with different assets and chart timeframes.
- Compatible with the MetaTrader 5 Visual Tester.
- Prepared for testing using the real-tick-based model.
- Does not execute or manage trades.
- Does not change chart settings in the normal trading environment.
Available Parameters
InpSmoothPeriod — Smoothing Period
Defines the degree of smoothing applied to the weighted price.
The default value is 30.
Lower values make the line more sensitive to recent fluctuations. Higher values produce a smoother line that is less sensitive to short-term movements.
InpEmaPeriod — EMA Reference Period
Defines the period of the internal exponential moving average used to determine the line color.
The default value is 25.
Lower values may produce faster color changes. Higher values make the reference smoother.
Possible Applications
Plus RSI MA Color may assist in observing:
- The prevailing price direction.
- Continuity of movements.
- Changes in short-term behavior.
- Periods of acceleration or loss of direction.
- Alignment with support and resistance.
- Complementary confirmation of other analyses.
- Trend or transition contexts.
The indicator can be used in scalping, day trading, or swing trading strategies, respecting the characteristics of each asset and chart timeframe.
Visual Tester
In the “Every tick based on real ticks” model, the MetaTrader 5 Strategy Tester may draw historical Bid and Ask trails around the candles.
Plus RSI MA Color includes its own handling to hide these trails during the Visual Tester, helping keep the chart cleaner.
This protection is applied exclusively during visual testing. The Bid, Ask, and Last colors and settings of the real chart remain unchanged.
Important Note
Plus RSI MA Color is a visual analysis tool. It does not open, modify, or close trades.
The colors represent the mathematical condition of the line in relation to its internal reference and do not constitute an automatic recommendation to buy or sell.
No indicator guarantees results. Before using the tool in real trading, it is recommended to test it, adjust its parameters to the analyzed asset, and apply appropriate risk management.