Adaptive Swing Density Heat Map

Adaptive Swing Density Heat Map
MT5 Structural Density Indicator — Swing Clustering, Participation Tracking, Acceptance vs Rejection & Color-Coded Heat Map

Adaptive Swing Density Heat Map analyzes swing point density across price levels, then tracks how price actually interacts with each zone — measuring participation, acceptance, and rejection.

The result is a heat map of structural zones, color-coded by density strength. Not all support and resistance levels are equal — this indicator quantifies the difference.

MT5 Native • No Repainting • Adaptive to Volatility • Fully Customizable

The Idea in One Line

See where price clusters. See where price fights.

What the Indicator Does

Adaptive Swing Density Heat Map answers one core question:

Where have swings repeatedly clustered — and is price accepting or rejecting those levels right now?

The indicator detects swing points using a fractal algorithm, clusters them by ATR-based price proximity, and assigns each cluster a density score from 0 to 100%. It then tracks how price interacts with each zone over a configurable behavior window — separating genuine structural levels from weak ones.

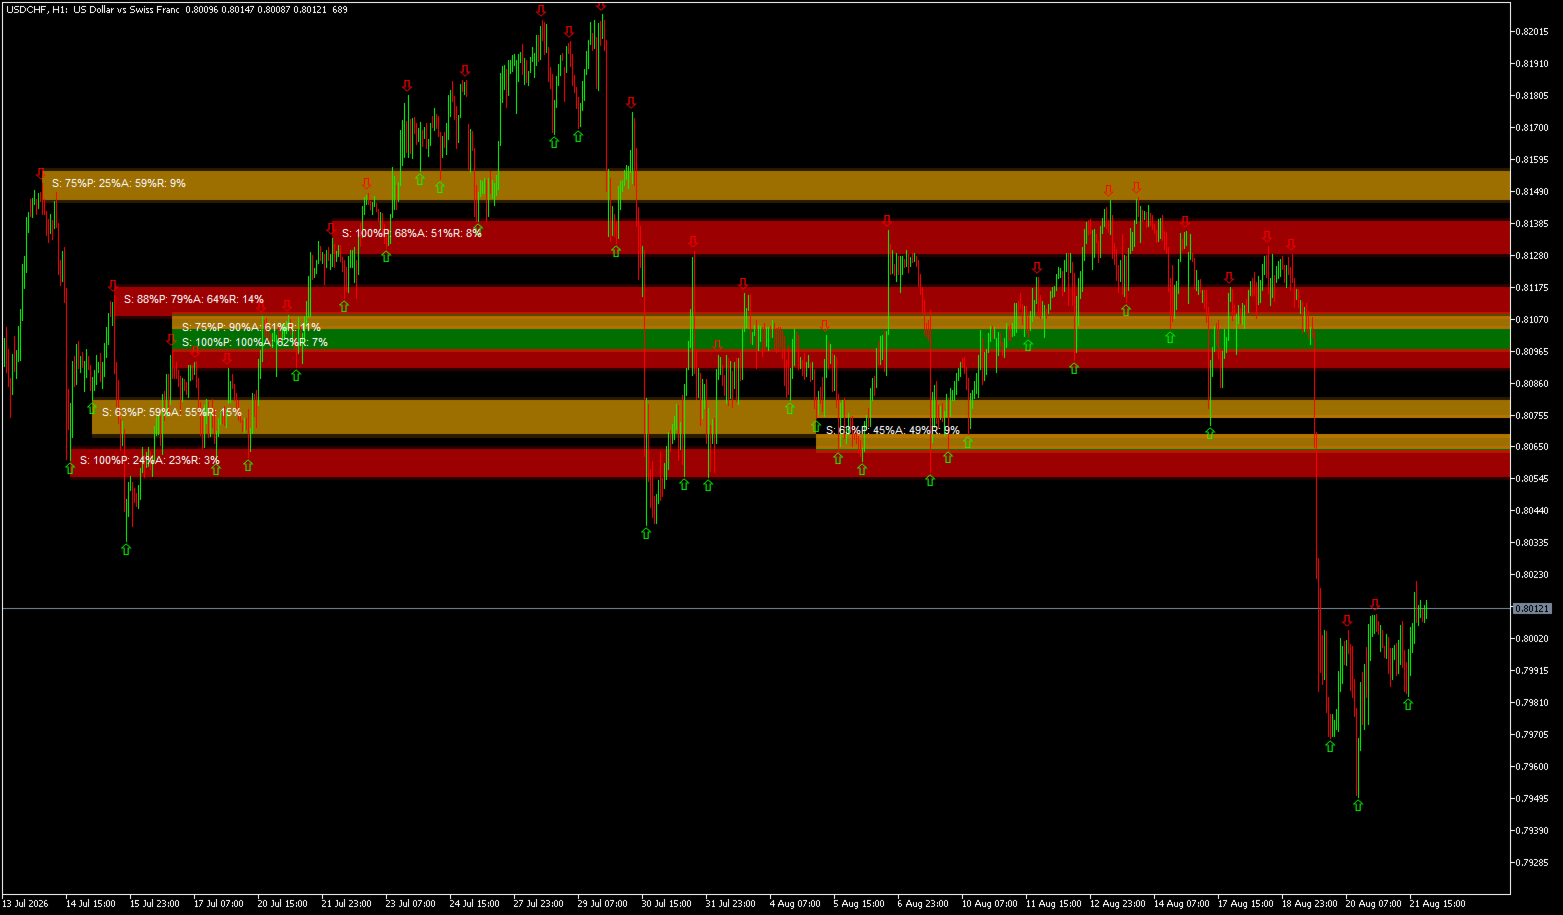
Zones are color-coded by density strength:

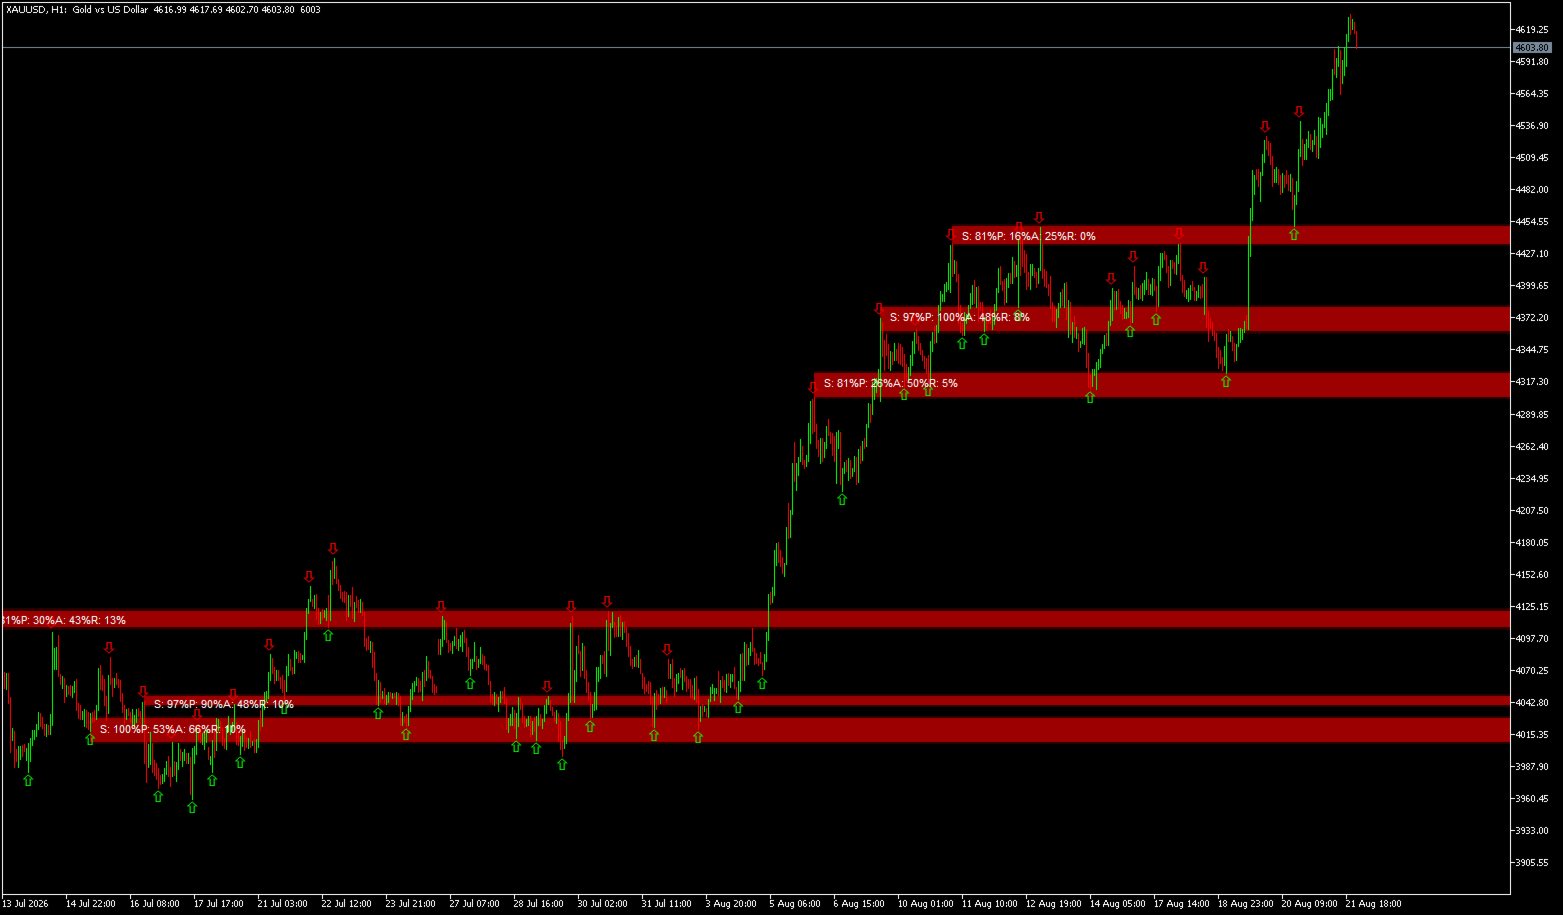
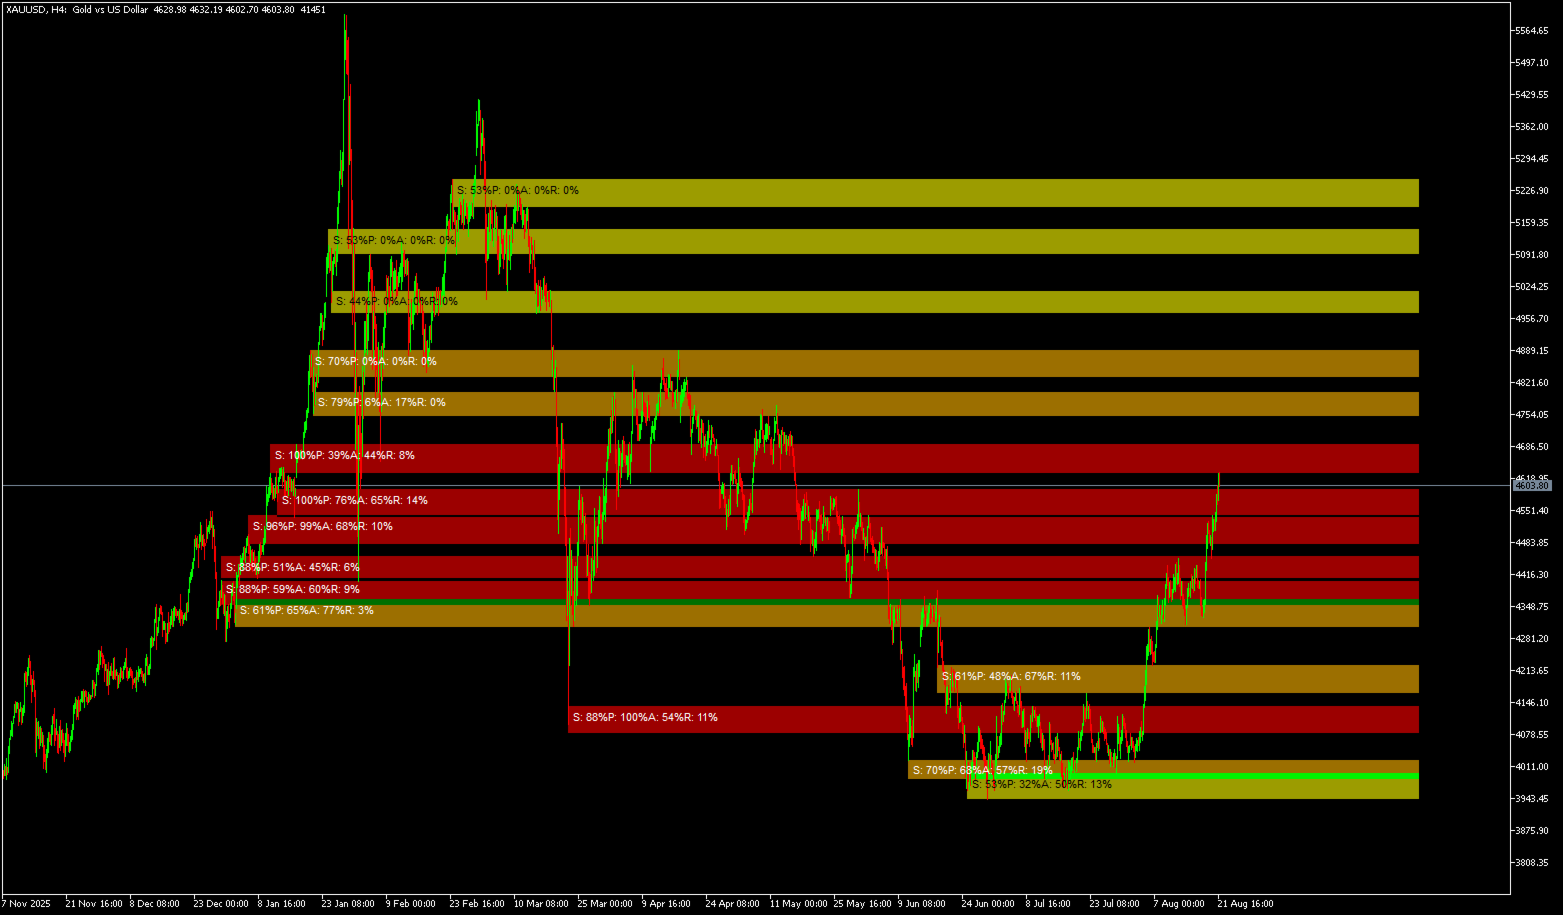
  • Red zones = Highest density (80–100%) — levels where price has repeatedly turned

  • Orange zones = High density (60–80%) — significant structural levels with active interest

  • Yellow zones = Moderate density (40–60%) — areas of some interest but less conviction

  • Blue zones = Low density (below 40%) — weak structural levels, best ignored

A level where many swings have clustered indicates genuine market attention. A level with only one or two touches is statistically less significant. This indicator quantifies that difference.

Core Logic and Calculation

The indicator begins by detecting swing points using a fractal algorithm. Each swing point represents a structural high or low where price reversed direction — these points are the foundation of all subsequent analysis.

Swings are then clustered by price proximity using an ATR-based radius. This radius adapts to market volatility, ensuring clusters are meaningful in both quiet and volatile conditions. Clusters that are too wide are rejected, as they represent broad ranges rather than specific levels.

Density is normalized by comparing each cluster to the top clusters in the current analysis window. This creates a 0 to 100 percent scale that remains consistent across different market conditions. A zone with 80 percent density has significantly more swing clustering than the reference zone, indicating strong structural importance.

Participation analysis measures how often price candles touch each zone. This is distinct from density — a zone may have many swings (high density) but rarely be visited (low participation). Such zones are less actionable.

Acceptance and rejection analysis distinguishes support from resistance. When price closes inside a zone, it indicates acceptance and suggests the zone is acting as support. When price leaves long wicks without closing inside, it indicates rejection and suggests the zone is acting as resistance.

A smoothing mechanism stabilizes the density reference across bars, preventing zone colors from flickering due to normal variations in which zones qualify as the strongest. This makes the indicator visually reliable and easier to interpret.

Key Strengths

Swing Density Analysis
Clusters swing points by price proximity using an ATR-based radius that adapts to volatility. The more swings at a level, the higher the density score — directly indicating structural significance.

Participation Tracking
Measures how often candles touch each zone as a percentage. A zone with high density but low participation is less actionable than one with high participation.

Acceptance vs Rejection
Tracks closes inside the zone as acceptance and wick rejections as rejection. This distinguishes support levels from resistance levels based on actual price behavior.

Adaptive Smoothing
Density reference is smoothed across bars to prevent color flickering, making the visual output stable and reliable.

Color-Coded Heat Map
Uses a Red to Blue intensity scale for instant visual interpretation of zone strength.

Fully Customizable
Swing strength, lookback, clustering radius, zone filtering, and behavior lookback are all adjustable.

Anchor Zones to Formation
Zones remain fixed to their structural formation period, preserving the context of their origin.

No Repainting
All calculations are based on historical data and do not change on the current bar, ensuring consistency for backtesting.

What You See on the Chart

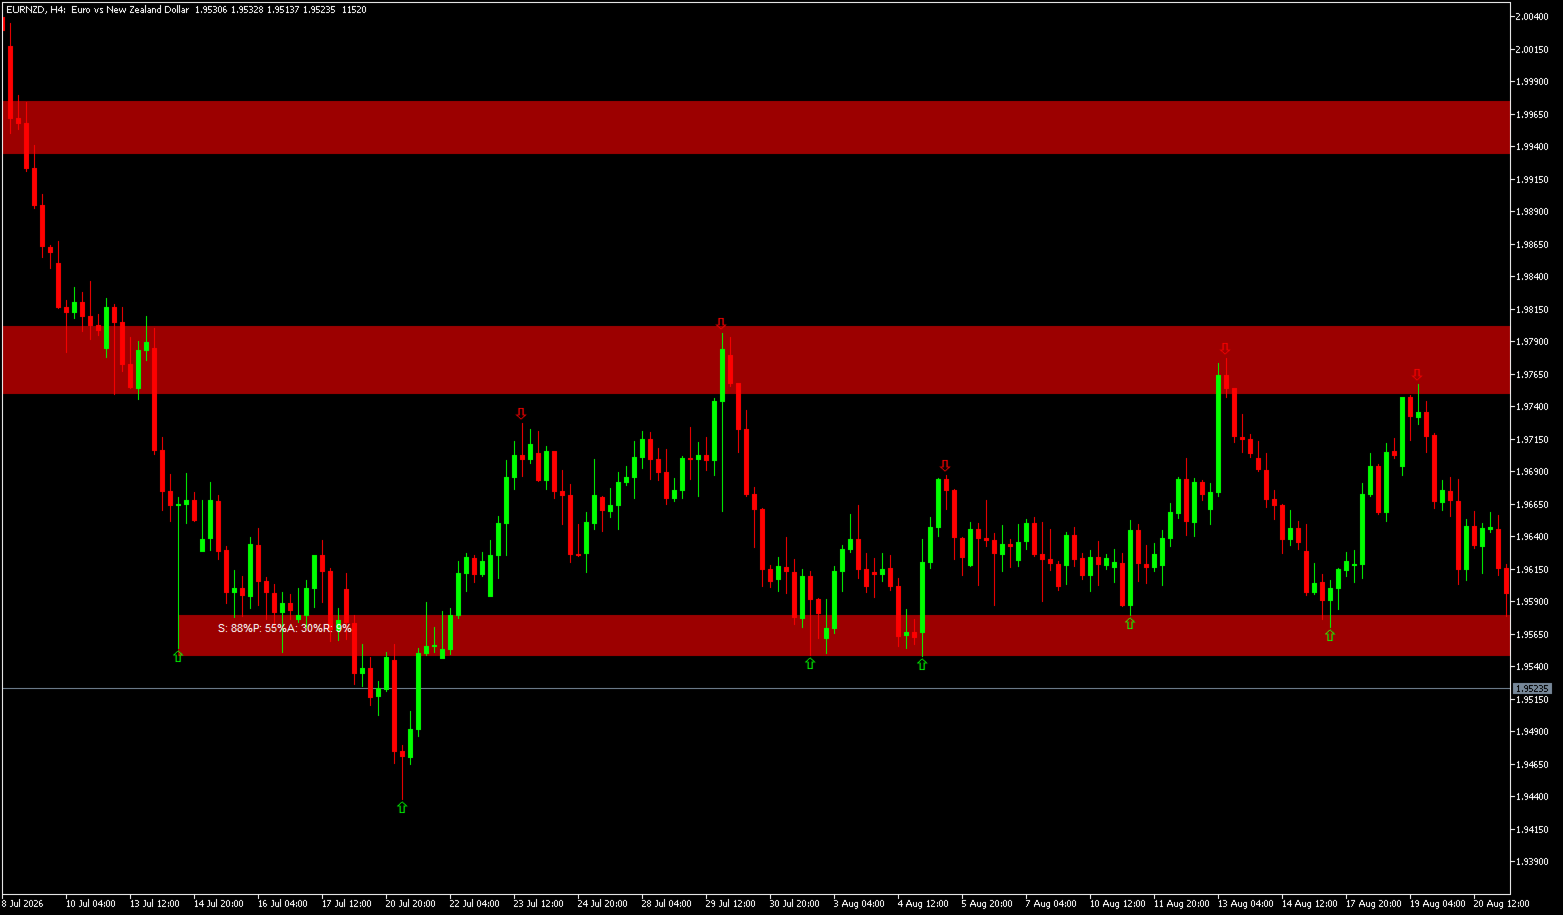
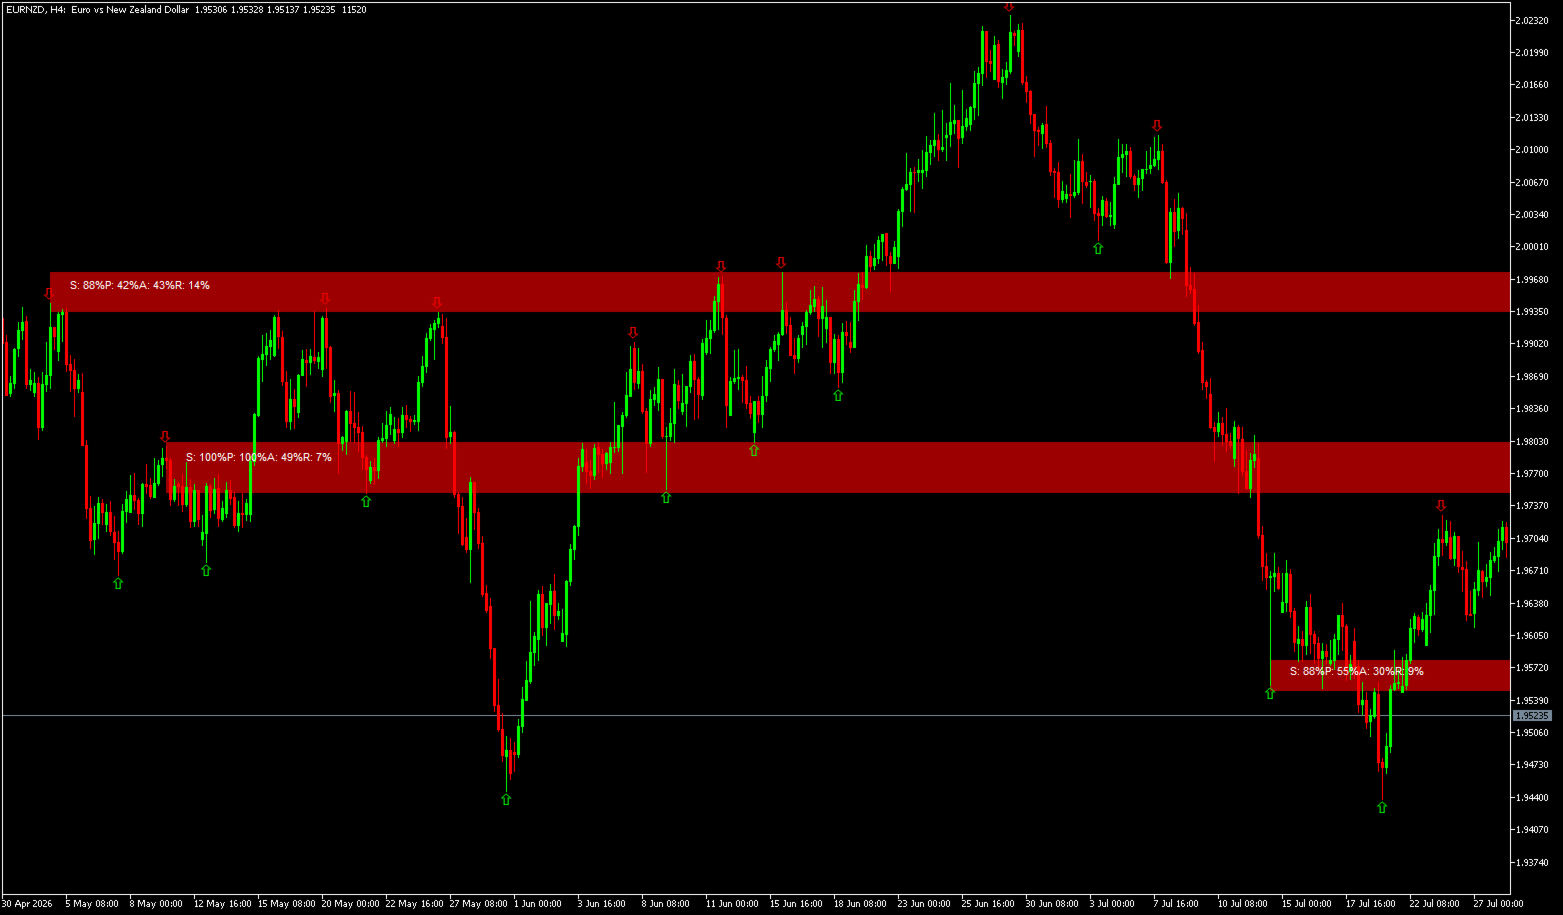
  • Red zones represent the highest density levels, indicating the strongest structural interest

  • Orange zones represent high density levels with significant swing clustering

  • Yellow zones represent moderate density levels with some market attention

  • Blue zones represent low density levels where structural interest is minimal

  • Semi-transparent halo extends above and below each zone for rejection detection

  • Data labels show Density percent, Participation percent, Acceptance percent, and Rejection percent

  • Swing high and low arrows can be toggled on or off

  • Zones auto-clean and redraw automatically on each new bar

How It Works

  1. Detects swing points using configurable strength and lookback limits.

  2. Clusters swings by price proximity using an ATR-based radius that adapts to volatility.

  3. Filters clusters by compactness — rejecting zones that are too wide.

  4. Assigns density scores normalized from 0 to 100 percent.

  5. Analyzes price behavior around each zone to measure participation, acceptance, and rejection.

  6. Draws a color-coded heat map with data labels and halo extensions.

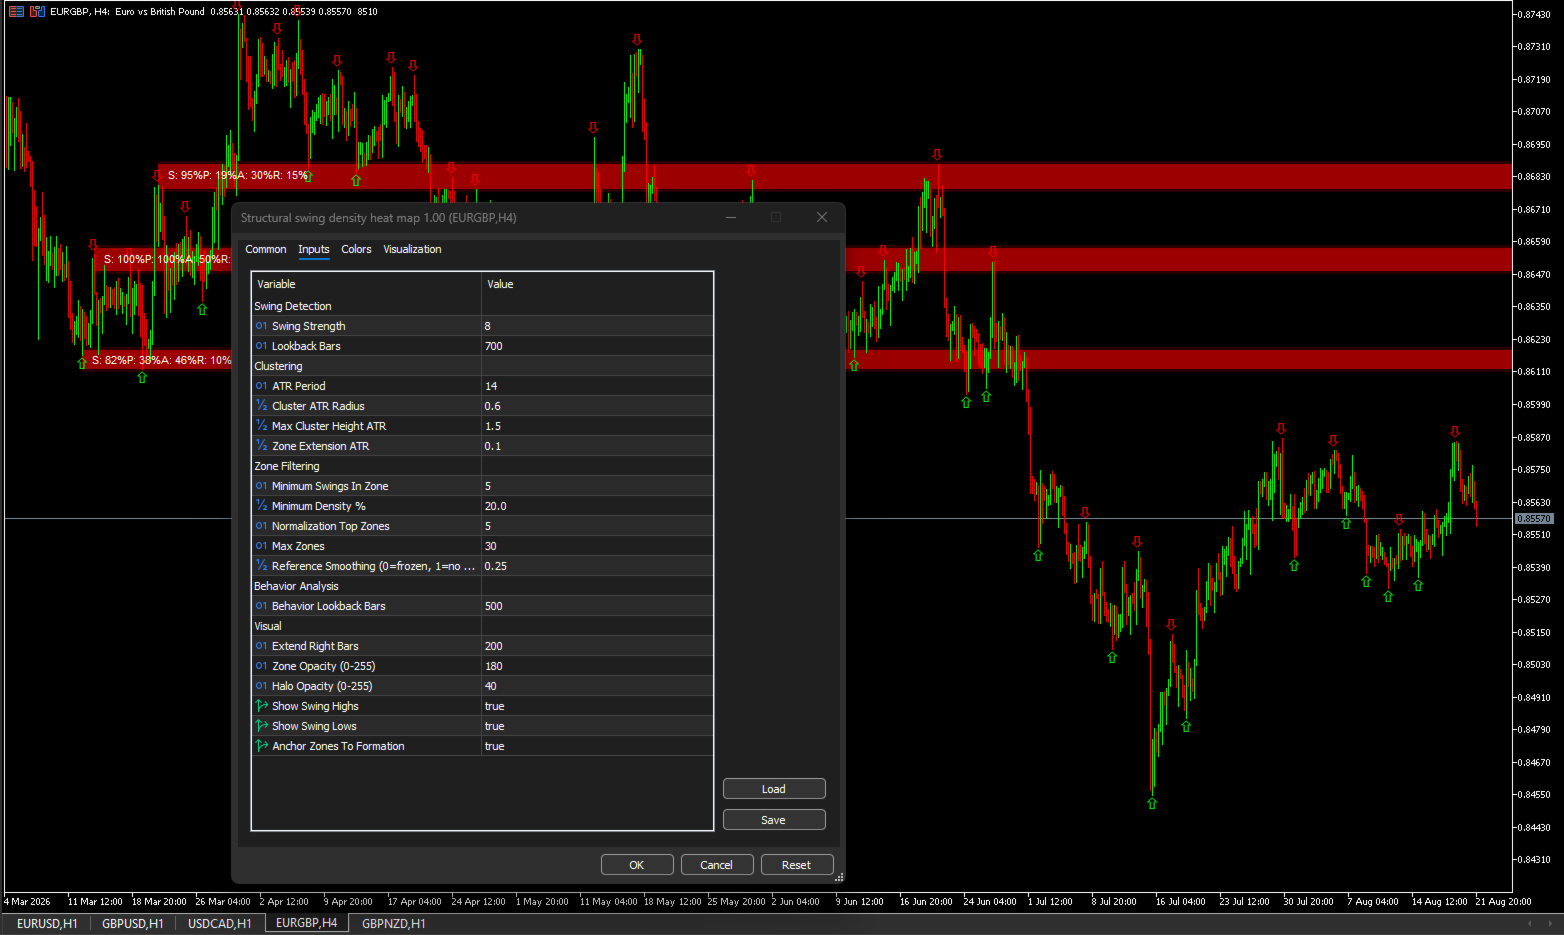
Detailed Parameter Guide

Swing Detection Parameters

Swing Strength
Controls how many bars are checked on each side of a bar to determine if it is a swing high or low. Higher values produce fewer, more significant swings by requiring more bars to confirm a turn. Lower values produce more swings, including smaller structural moves.
Default: 12 — works well on H1 charts. For M5, consider 8 to capture more movement. For H4, consider 16 to filter out minor noise. The key is finding the balance where swings represent meaningful turns rather than noise.

Lookback Bars
Limits how far back the indicator searches for swings.
Default: 1000 bars. This is a performance optimization that prevents the indicator from scanning the entire chart history. On longer timeframes like D1 or W1, you may need to increase this value. On shorter timeframes like M1 or M5, you can decrease it. The indicator will still draw zones from the lookback period; older history is ignored.

Clustering Parameters

ATR Period
Determines the period used for ATR calculation, which affects the adaptive radius for clustering.
Default: 14 — standard for volatility measurement. In volatile markets, consider a shorter period for more responsive clustering. In quiet markets, consider a longer period for more stable clustering.

Cluster ATR Radius
Determines how close swing points must be to cluster together. The value is multiplied by the current ATR. Higher values create wider clusters, capturing more swings at the cost of precision. Lower values create tighter clusters with fewer swings but greater accuracy.
Default: 1.0 × ATR. In volatile markets, consider lowering this to keep clusters tight. In quiet markets, consider raising it to capture enough swings for meaningful clusters.

Max Cluster Height ATR
Rejects clusters that are too wide. A cluster with a wide price range indicates the swings are not actually clustered at a specific level.
Default: 1.5 × ATR. Any cluster wider than this is rejected as too diffuse. This ensures zones represent genuine structural levels rather than broad ranges.

Zone Extension ATR
Controls the halo size around each zone, used for rejection detection. When price touches the halo but fails to close inside the zone, it is counted as a rejection.
Default: 0.0 (no extension). Setting this to 0.5 × ATR captures rejections that occur just outside the zone, which is valuable for identifying resistance levels.

Zone Filtering Parameters

Minimum Swings In Zone
Sets the minimum number of swings required to form a zone.
Default: 4. Zones with fewer swings are rejected as too sparse. This prevents drawing zones on isolated swings that do not represent repeated market interest.

Minimum Density Percent
Filters out weak zones. Only zones with density above this threshold are displayed.
Default: 20 percent. Increasing this value to 40 percent will show only the strongest zones, reducing chart clutter. Decreasing it to 10 percent will show more zones but include weaker ones.

Normalization Top Zones
Determines how density is normalized. The indicator takes the top N zones by swing count and averages their swing counts to create a reference.
Default: 5. This reference is used to calculate density percentages for all zones. A zone with 10 swings when the top 5 zones average 5 swings would have 200 percent density, capped at 100.

Reference Smoothing
Smooths the density reference across bars to prevent color flickering.
Default: 0.25. A value of 0 freezes the reference, preventing color changes entirely. A value of 1 uses the raw reference from each bar, allowing colors to change more freely. The default provides a good balance between stability and responsiveness.

Behavior Analysis Parameters

Behavior Lookback Bars
Controls how many bars are analyzed for participation, acceptance, and rejection.
Default: 500. Longer lookbacks provide more statistically significant behavior analysis but may include outdated price action. Shorter lookbacks focus on recent behavior but may lack sufficient data. For swing trading on H4 and above, consider 500 to 1000. For day trading on H1 and below, consider 200 to 500.

Visual Parameters

Extend Right Bars
Projects zones forward by a specified number of bars.
Default: 200. Useful for anticipating potential support and resistance levels ahead of price. Reducing this value keeps zones closer to current price.

Zone Opacity
Controls the transparency of the zone core. Range is 0 to 255, with higher values being more opaque.
Default: 180. Lower values create more transparent zones that allow price action to be seen underneath.

Halo Opacity
Controls the transparency of the halo extension.
Default: 40 — creates a subtle visual that does not obscure price action. Higher values make the halo more visible.

Show Swing Highs and Lows
Toggles the display of swing point arrows on the chart.
Default: true for both. Disabling these reduces chart clutter while preserving the zone display.

Anchor Zones To Formation
When enabled, zones remain fixed to their structural formation period rather than extending to the current bar.
Default: true — preserves the context of each zone's origin.

Practical Usage Guide

The primary use of this indicator is to identify genuine structural levels for entries, exits, and stop placement. Red zones are your strongest levels. They represent price levels where swings have repeatedly clustered, indicating institutional interest. These zones are the most reliable for support and resistance decisions.

To interpret a zone, examine the four metrics displayed in the label:

  • Density tells you how strong the zone is relative to others.

  • Participation tells you whether price actually visits the zone.

  • Acceptance tells you if price closes inside — meaning the zone acts as support.

  • Rejection tells you if price leaves long wicks — meaning the zone acts as resistance.

A high density zone with high acceptance (above 50%) is a strong support level. Price tends to hold above this zone, making it suitable for buy entries and stop placement below.

A high density zone with high rejection (above 50%) is a strong resistance level. Price tends to reverse at this zone, making it suitable for sell entries and stop placement above.

A zone with high density but low participation (below 20%) may be less reliable. The market has shown interest through swing clustering but has not recently interacted with the level. Consider waiting for a touch and reaction before trading.

A zone with low density but high participation may be a temporary area of interest rather than a structural level.

For the most reliable trades, combine high density with high participation. These are zones where price has historically fought. When price returns to a high density zone, watch for acceptance or rejection to confirm the direction. Entry can be made on rejection candles or close confirmations.

Practical Example

On a EURUSD H1 chart, you observe a red zone (density 85%) between 1.0850 and 1.0875. The label shows S:85, P:65, A:40, R:35. This indicates strong swing clustering, active participation, moderate acceptance, and moderate rejection. The zone has not shown a clear direction yet.

Price approaches the zone from above, touching the halo and leaving a long lower wick. The rejection count increases to 45%. This suggests the zone is acting as resistance. You consider a sell entry with a stop above the zone.

Alternatively, price approaches the zone from below and closes inside. The acceptance count increases to 50%. This suggests the zone is acting as support. You consider a buy entry with a stop below the zone.

Recommended Workflow

  1. Attach the indicator to your chart with default settings.

  2. Identify the highest density zones, shown in red and orange.

  3. Check participation, acceptance, and rejection metrics for each zone.

  4. Use acceptance zones as support and rejection zones as resistance.

  5. Confirm with price action, such as candlestick patterns, before entering trades.

Practical Use Cases

  • Identify high-density structural zones where the strongest levels are located

  • Distinguish acceptance zones that act as support from rejection zones that act as resistance

  • Avoid low-density, low-participation areas that are unlikely to hold

  • Find structural clusters for entry and exit placement with higher probability

  • Use as confluence with trend indicators or order flow analysis

Technical Notes

  • Overlay indicator that draws directly on the price chart

  • Works on any timeframe from M1 to MN1

  • Works on any symbol including forex, commodities, indices, and crypto

  • Adaptive to volatility via ATR-based radius calculations

  • No repainting — all calculations are historical and do not change on the current bar

  • Optimized for performance with once-per-bar recalculation and configurable lookback limits

  • Compatible with MetaTrader 5

Support

Lifetime updates included. For assistance, click Developer's Profile below.

Adaptive Swing Density Heat Map — MT5 Structural Density Indicator | Swing Density Heat Map | Swing Clustering Indicator | Participation Tracking | Acceptance Rejection Analysis | Support Resistance Heat Map | ATR Adaptive Zones | Structural Levels MT5 | High Density Zones | No Repaint Heat Map | Market Structure Indicator | Swing Point Analysis | Price Cluster Indicator | MT5 Heat Map Indicator | Order Flow Alternative | Institutional Levels Indicator
Recommended products
Adaptive Math Zones Indicator is a professional MT5 indicator designed to identify high-probability price reaction areas using mathematical price projections and Fibonacci-based channel structures. The indicator automatically builds a reference price channel, highlights neutral zones, and projects future price levels (50%, 100%, and 200%), helping traders visually understand market structure and potential reaction points. This tool is especially effective during ranging and corrective market con
This easy to setup indicator shows you the market volumes in a different way, with support and resistance as showed. You can setup: - Backdays volume to show - Heiken Ashi candle view It works for every kind of graph and every kind of period. The program shows the volumes based on the number of candles displayed in the chart: the more candles the more volumes. Enjoy this very useful indicator. Please feel free to message me to report any kind of improvements! :D
MFOP Market Forecast
Oscar Josue Pin Bacuzoy
Develop this indicator for periods of 30 minutes or more, focus on getting market trends right and making sure they are met. MFOP v8.1 gets straight to the point: it scans the market and tells you exactly when there is enough strength to enter a trade. This indicator doesn't do magic, it uses mathematical algorithms to filter out market noise, not enter into false breakouts and show you clear BUY (blue arrow) and SELL (red arrow) opportunities. It is designed and optimized specifically to take
ICT Institutional Zones Pro
Celestine Anyango Wabomba
ICT Institutional Zones Pro — Trade with Institutional Precision Stop wasting time manually drawing key ICT levels every day. ICT Institutional Zones Pro is a professional-grade MT5 indicator built for traders who use ICT (Inner Circle Trader) and Smart Money Concepts (SMC) to read market structure with precision. This indicator automatically maps the most important institutional levels directly on your chart, helping you instantly identify where smart money is likely accumulating, distributing
Strength Candles
Luis Paulo Rodrigues Pastor
Indicator in histogram format, which is calculated using data on financial volume, tick volume and the body of the bar. It is possible to visualize moments where there was a large entry of volume, both financial and in ticks, and that the market managed to progress and advance in one direction (up or down) due to the size of the bar body, which is where there really was a victory for one side of the negotiation (buyers and sellers). By default, all bars in the indicator's histogram are colore
Aurum mid quant pro
N'da Lemissa Kouame
AURUM MID-QUANT PRO v5.60 Quantitative Excellence for Gold (XAU/USD) & Volatility Trading Gain a professional edge over institutional markets with AURUM MID-QUANT PRO , an advanced Price Action Pattern Detection and Breakout Engine designed exclusively for MetaTrader 5 . Built specifically to capture the unique volatility of Gold (XAU/USD) and other major financial instruments, this powerful indicator combines high-precision algorithmic pattern recognition with real-time dynamic accumulation z
Linear Trend Predictor - A trend indicator that combines entry points and direction support lines. It works on the principle of breaking through the High/Low price channel. The indicator algorithm filters market noise, takes into account volatility and market dynamics. Indicator capabilities Using smoothing methods, it shows the market trend and entry points for opening BUY or SELL orders. Suitable for determining short-term and long-term market movements by analyzing charts on any timeframes.
Spike Oscillator
Vitalii Kondratiuk
Indicator for searching for price reversals Works well on commodity indices and currency pairs On charts such as Boom Cash, it shows the beginning of a protracted movement well. You can also catch splashes. The indicator uses algorithms, an oscillator and a trend indicator that work together. The indicator shows a candle opening signal (does not disappear, does not redraw and does not recalculate its readings) A good quality tool that can become the basis for creating your own trading system.


is a versatile analytical tool designed for both advanced traders and beginners. It combines classic trend line analysis with automatic Fibonacci level plotting to deliver precise market entries and structural clarity. Built as an intuitive and clean on-screen dashboard, this indicator simplifies multi-timeframe analysis without cluttering your main workspace. Technical Analysis and Entry Points The indicator automates the most critical aspects of price action and structural trading: Trend L
This indicator is an indicator for automatic wave analysis that is perfect for practical trading! Case... Note:   I am not used to the Western name for wave classification. Influenced by the naming habit of Chaos Theory (Chanzhongshuochan), I named the basic wave as   pen   , the secondary wave band as   segment   , and the segment with trend direction   as main trend segment   (this naming method will be used in future notes, let me tell you in advance), but the algorithm is not closely relate

Description: EuroPulse MACD Hist Flow — EMA200 Trend Filter with MACD Histogram EA (Swap-Free) PRODUCT OVERVIEW EuroPulse MACD Hist Flow is a premium automated trading solution designed for MetaTrader 5, specialized for the EURUSD currency pair. The EA implements a robust trend-following strategy: • EMA200 as long-term trend filter • MACD Histogram for momentum confirmation • ATR-based stop loss and take profit • Daily loss protection • Swap-Free mode for Islamic accounts WHY EUR
This is a simple arrow system based on Engulfing Candlestick Pattern. It gives you alerts on your smartphone when there is an engulfing candlestick pattern happens. Which type of alerts available? 1. It paints on chart Up/Down Arrows. 2. Popup message and sound alert in trading terminal window. 3. Push notification or Alert on your Android and IOS mobile phones (requires MT4 or MT5 app installed!) *Note: Use it on higher timeframes like H4 (4 hours), D1 (1 Day) then find trade opportunities on s
RangeXpert Plus
Steve Rosenstock
The Premium RangeXpert Extension with Multi-Timeframe Trading Signals for Forex, Gold & Bitcoin RangeXpert+ is the premium extension of the well-known RangeXpert — one of the Top-10 free indicators on the market, with over 10,000 downloads and an extremely active community. While the free version delivers precise breakout signals on a single chart, RangeXpert+ provides exactly what professional traders demand: a complete multi-timeframe cockpit directly in your chart, perfectly optimized for h
RSIScalperPro
PATRICK WENNING
Introducing RSIScalperPro - the revolutionary RSI-based indicator for Metatrader 5, specifically designed for scalping in the one-minute chart. With RSIScalperPro, you'll have a powerful toolkit for precise entry and exit signals to take your trading to the next level. RSIScalperPro utilizes two different RSI indicators that provide clear signals for overbought and oversold areas. You can customize the time periods and limit values of the two RSIs according to your preferences to achieve the be
The  OBV MTF  is an Enterprise-grade On-Balance Volume indicator that transforms standard OBV into a complete trading system. It combines gradient-aware momentum analysis, divergence detection, multi-timeframe alignment, and dynamic customisable midpoint-filtering in a single intuitive professional volume analysis tool. Core Features 1. 5-State Momentum Engine Aqua (Strong Bullish) : OBV slope rising with positive acceleration SteelBlue (Weak Bullish) : OBV rising but losing momentum Gray (Neutr
Aussenstab Markttechnik
Alexander Josef Zeidler
This indicator shows external bars ("Aussenstäbe") in the chart in candle form. The colors of the candles can be set individually. Also different colors for bearish and bullish bars are possible. In addition, the color of the wicks or outlines is also adjustable. Outside bars are mentioned e.g. by Michael Voigt in the book "Das große Buch der Markttechnik". All other candles are inner bars.
What it does - 174 fixed strategy variants in 31 groups, each group with a fixed weight - Bitcoin and Ethereum: breakout, Keltner and moving-average trend entries on H1 and H4, daily trend and momentum, range-expansion entries on H4, H6 and H8, Ichimoku on H8, Bollinger squeeze on H12 - USDJPY and Brent: daily trend and momentum. Gold: H4 breakout and Keltner trend - Every trade has a stop loss. Exits by trailing stop, channel exit, opposite signal or time, depending on the strategy - Volatilit
Link to our products: LINK The ICT Asian Killzone Indicator delivers a professional, institutional-grade framework by precisely defining the Asian trading session from 00:00 to 04:00 GMT with absolute accuracy. It streamlines market structure analysis by isolating liquidity accumulation, range formation, and volatility compression during the Asian session. Built for serious ICT and Smart Money traders, it enhances strategic decision-making, execution confidence, and Tokyo session directional bi
Product Name: Fair Value Channel Consolidation Breakout THE MACHINE LEARNING HAVE BEEN DESACTIVATED FOR A EASY TEST!!( OBS: IF THE CLIENT WANT IT WE CAN INTEGRATE IT EASILY) ATTENTION !!!! THE RIGHT INPUTS TO USE IN XAU/USD  CAN BE VIZUALIZED IN THE SCREENSHOTS, IF THE INPUTS ARE NOT USED THE RESULT CAN DIFFERS! TAKE PROFIT , SELL LOSS AND TRAILLING STOP CAN BE CHANGED IF YOU DESIRE Stop trading the past. Start trading the true Fair Value. Fair Value Channel Consolidation Breakout  is not just
MULTICANDLE SCANNER DASHBOARD PRO MT5: Institutional Multi-Pair Multi-Timeframe Price Action Scanner with Dynamic ATR SL/TP & 16-Filter Confluence Engine PRODUCT TYPE Category: MetaTrader 5 Multi-Asset Technical Scanner & Trading Dashboard Strategy Engine: Multi-Candle Price Action Momentum (4C / 5C / 6C Patterns) Signal Integrity: 100% Non-Repainting Execution (Strict Bar-Close Confirmation) Trading Styles: High-Frequency Scalping (M1/M5), Day
Aegis XAU Extreme Edition Overview Aegis XAU Extreme Edition is a trend-following Expert Advisor designed exclusively for XAUUSD M1 . Rather than trading throughout the entire day, it focuses only on carefully selected trading sessions identified through extensive historical testing. By avoiding statistically unfavorable hours, the EA aims to improve overall trading efficiency while maintaining consistent long-term performance. The strategy combines: EMA Trend Filter EMA Pullback Entry ADX Tr
Bestofthebest
Francisco Marcio Serafim
The best indicator I created for scalping and day trading. Forget the rest and study this one. See you later. This indicator shows price exhaustion points based on movements. Over the months, it has proven very effective on the xauusd pair. With scalping and martingale methods, it becomes very accurate. Study and take full advantage of this indicator until you gain confidence. Try to enter slowly and increase your position size appropriately. I hope it improves your trades by more than 100%.
An all‑in‑one trading assistant that blends AI candle synthesis with a 15‑pattern Heat Map, ATR‑scaled S/R & pivots, and a Vigilant risk monitor (LOC/TF/SR/PAT gates, Ready%, EM points, SR‑distance bar). The Opportunity Advisor adds ETAs, checklists and gate status; Multi‑TF Confluence confirms alignment from M1–D1. The Professional Trade Suggestion panel shows regime, session filter, R:R presets, Partials and Quality Pause. Clean, readable UI with one‑click S/R toggles, scanners and a built‑in,
Anchored VWAP Trading Indicator Struggling to identify true market value and key support/resistance levels? The Anchored VWAP Trading Indicator helps you track price based on real traded volume, giving you a clear edge in your trading decisions. This tool allows you to anchor VWAP from any point on the chart, making it ideal for analyzing trends, reversals, and institutional activity. Key Features Anchored VWAP from any candle Accurate volume-weighted price calculation Works on all symbol
Inspired by the popular beat the market maker Multi MA. Now available for MT5 to be utilized. Multi Exponential Moving Average (Multi-EMA) Indicator for MT5 The Multi-EMA Indicator is designed to help traders visualize multiple exponential moving averages on one chart with precision and clarity. It plots five customizable EMA lines, each with distinct colors, making it easy to identify market trend direction, strength, and potential reversal zones at a glance. Key Features: Plots five indepen
ForeCastX AI
Marco Engstermann
ForeCastX AI is a MetaTrader 5 chart indicator. It shows swing-based trend coloring, buy and sell arrows, supply and demand zones, a multi-timeframe buy/sell power panel, and an optional projected path. The path is a visual sketch from recent structure and panel values. It is not a price prediction and it is not a trading signal by itself. What you see on the chart Candles colored by the current swing trend Arrows when price breaks a confirmed swing high or low Supply and demand rectangles with
Harraz Master HUD
Muhammad Azraf Bin Dzul Fauzi
HARRAZ MASTER HUD v4.4 - The Ultimate Neural Trading Command Center ​ Transform your MetaTrader 5 into a professional, institutional-grade trading terminal. Harraz Master HUD is not just an indicator; it is a complete Artificial Intelligence ecosystem designed specifically for XAUUSD (Gold) and major pairs. ​ EXCLUSIVE FEATURES: ​1. Live Neural AI Typewriter (Jarvis Mode) Experience a live, animated Heads-Up Display that types out real-time market sentiment and advice. It acts as your persona
Gann Box MT5
Frederic Jacques Collomb
The Gann Box indicator is a powerful and versatile tool designed to help traders identify and exploit key market levels. This indicator draws a rectangle on the chart, which is automatically divided into several zones with strategic levels 0, 0.25, 0.50, 075, 1 . When the price touches one of these levels, alerts are triggered, providing valuable assistance for trading decisions. You instantly know the evolution of the market in relation to the zone you have drawn. To draw a zone, simply draw a
【Super Scanner】Indicator Introduction : The color of the Super Scanner which is green and climbing up means that the price trend is going up.The color of the Super Scanner is red and going down means that the price trend is going down. It is very simple to use it to judge the market trend! What's even better is that the open parameters of the indicators allow investors to adjust. You can adjust【Super Scanner】according to your needs. Adjust it faster to be closer to short-term market fluctuatio
ICT Market Time Cycle MT5 – Complete Session & Time Window ICT Market Time Cycle is a professional trading indicator designed to help traders follow the ICT (Inner Circle Trader) methodology with ease. It automatically displays the main market sessions (Asia, London, and New York), along with Killzones, Silver Bullet windows, and Macro times directly on your chart. With this tool, you no longer need to calculate session times manually – everything is plotted automatically in a clean and professi
Buyers of this product also purchase
Trend Sniper X
Sarvarbek Abduvoxobov
4.9 (40)
Trend Sniper X is a multi-timeframe trend-following indicator for MetaTrader 5 that helps traders identify trend direction and potential reversal points with clarity and precision. for MT4: https://www.mql5.com/en/market/product/193245 Price Information: The current price is promotional and is subject to change as upcoming updates and new features are released. Bonus Offer: To get the FREE Auto-Trade Assistant EA for this indicator, please message the author after purchasing. Code2Profit Channe
Smart Trend Trading System — MetaTrader 5 Message me on MQL5 after purchase to receive Smart Universal Expert Advisor for FREE, plus the online course, PDF manual, and private group access. STTS brings trend direction, entry and exit signals, reversal zones, and important price levels together on your chart. Follow the system manually, or connect a separate compatible EA for automated execution using your chosen settings. ONE SYSTEM. FOUR TRADING APPROACHES. STTS organizes its trading approaches
ARIPoint
Temirlan Kdyrkhan
1 (4)
ARIPoint is a powerful trading companion designed to generate high-probability entry signals with dynamic TP/SL/DP levels based on volatility. Built-in performance tracking shows win/loss stats, PP1/PP2 hits, and success rates all updated live. Key Features: Buy/Sell signals with adaptive volatility bands Real-time TP/SL/DP levels based on ATR Built-in MA Filter with optional ATR/StdDev volatility Performance stats panel (Success, Profit/Loss, PP1/PP2) Alerts via popup, sound, push, or email Cu
SuperScalp Pro
Van Minh Nguyen
4.66 (35)
SuperScalp Pro - Professional Multi-Layer Confluence Scalping System SuperScalp Pro is an advanced scalping indicator that upgrades classic Supertrend with multiple intelligent confirmation filters. It helps you identify higher-probability Buy/Sell opportunities while significantly reducing false signals. Clear Buy and Sell arrows appear directly on the chart, with automatic ATR-based Stop Loss and Take Profit levels calculated in real time. After purchase, contact me for setup guidance and reco
Gann Made Easy   is a professional and easy to use Forex trading system which is based on the best principles of trading using the theory of W.D. Gann. The indicator provides accurate BUY and SELL signals including Stop Loss and Take Profit levels. You can trade even on the go using PUSH notifications. PLEASE CONTACT ME AFTER PURCHASE TO GET TRADING  INSTRUCTIONS   AND GREAT EXTRA INDICATORS  FOR FREE! Probably you already heard about the Gann trading methods before. Usually the Gann theory is a
SMC Intraday Formula
VividMind Digital Solutions
5 (26)
Secure the Lowest Price Today. After purchase, contact via   MQL5 inbox   to receive your buyer kit and bonus. Let's be honest first. No indicator will make you profitable on its own. If someone tells you otherwise, they're selling you a dream. Every indicator that shows perfect buy/sell arrows can be made to look flawless — just zoom into the right window of history and screenshot the winners. We won't do that. SMC Intraday Formula is a tool. It reads the market structure for you, maps the hig
A new King in town - Indicator + Order management indications(tp1+tp2+tp3) + Optional Telegram Signal sender   INCLUDED (FREE) ( FULL TRADING  and SIGNAL SYSTEM ) Our best EA for Gold: Gold Slayer TRY > Reversion Queen  Expert advisor NEW Free Automation EA link < click here ( disclaimer: this is new and still on testing and phase , use at your risk on demo) Free Telegram Bridge < click here  This indicator includes an advanced Strategy, a trading system with customisable order management and a
Neuro Poseidon MT5
Daria Rezueva
4.75 (52)
Neuro Poseidon is a new indicator by Daria Rezueva. It combines precise trading signals with adaptive TP/SL levels - creating best possible trades as a result! Message me and get  Neuro Poseidon Assistant  as a gift to automize your trading process! What makes it stand out? 1. Proven profitability on all assets and timeframes 2. Only confirmed BUY and SELL signals present on the chart 3. Adaptive TP & SL levels generated by the software for each trade 4. Easy to understand - suitable for al
Auto Optimized SpeedAngle is an institutional-grade momentum vectoring system that eliminates curve-fitting through continuous Walk-Forward Optimization (WFO). Rather than relying on static inputs that degrade when market regimes shift, the indicator dynamically recalibrates its parameters using Out-of-Sample (OOS) validation, ensuring the displayed signals represent genuine statistical edges rather than historical anomalies. By shifting the focus from subjective visual angles to normalized, qua
Entry Points Pro 10 — the legend of the MQL5 Market. Three years in the Market's Top-3. 595 reviews across two versions. Over 31,000 demo downloads. Thousands of traders open their charts with it every morning. Built and traded by an author who has been in the market since 1999. Version 10 is the biggest rebuild in the indicator's history: I read every review from five years — and built the answers into the code. WHAT IT DOES It shows the entry point in advance — strictly without repainting. The
FiboSniper Pro
Van Minh Nguyen
5 (3)
FiboSniper Pro - Multi-Filter Fibonacci System with Auto SL/TP and Control Panel FiboSniper Pro is a technical indicator that combines dynamic Fibonacci Envelopes with multiple confirmation filters to generate selective Buy and Sell signals. Fibonacci levels are calculated from Moving Average and ATR, then filtered by ADX, EMA, RSI, ATR, Volume, Time and Candle structure. The indicator displays automatic ATR-based Stop Loss and Take Profit levels directly on the chart, along with an interactive
Welcome to ENTRY IN THE ZONE AND SMC MULTI TIMEFRAME SPECIAL BENEFIT / FOR OUR MQL5 CUSTOMERS FREE ACCESS TO THE NEW TOOL  — COMING SOON — Learn more on our official website  : https://www.fableedge.net Entry In The Zone and SMC Multi Timeframe is a real-time market analysis tool based on Smart Money Concepts (SMC), designed to analyze market structure, price direction, and key trading zones. It supports both Single-Timeframe Analysis and Multi-Timeframe Analysis, providing a clearer view of the
Unix Scalper
Issam Kassas
4 (4)
Unix Scalper — MetaTrader 5 Message me on MQL5 after purchase to receive Smart Universal Expert Advisor for FREE, plus the online course, PDF manual, and private group access. Find the setup. See the plan. Choose how to trade it. UNIX Scalper brings market analysis, BUY/SELL/WAIT decisions and Entry, Stop Loss, TP1 and TP2 levels into one organized panel. SEE THE SIGNAL AND THE PLAN • Clear decisions: BUY, SELL or WAIT. • Defined levels: Entry, Stop Loss, TP1 and TP2. • Multi-timeframe overvie
M1 Sniper MT5
Oleg Rodin
5 (7)
M1 SNIPER  is an easy to use trading indicator system. It is an arrow indicator which is designed for M1 time frame. The indicator can be used as a standalone system for scalping on M1 time frame and it can be used as a part of your existing trading system. Though this trading system was designed specifically for short-term trading, it still can be helpful for all traders. This trading system can be used with any forex pair and time frame, though lower time frames are recommended from M1 up to M
Adaptive Price Action Engine Buy Indicator- Get EA Based on it for FREE. Self-Optimizing Multi-Timeframe Trend & Candlestick Intelligence Markets do not behave the same way all the time—and not every price-action pattern has the same value in every market regime. Adaptive Price Action Engine is designed to adapt to changing market conditions by combining trend structure, multi-timeframe analysis, candlestick patterns, and statistical optimization into one analytical framework. Two Adaptive Mode
Scalper Vault   is a professional scalping system which provides you with everything you need for successful scalping. This indicator is a complete trading system which can be used by forex and binary options traders. The recommended time frame is M5. The system provides you with accurate arrow signals in the direction of the trend. It also provides you with top and bottom signals and Gann market levels. The indicator provides all types of alerts including PUSH notifications. PLEASE CONTACT ME A
FX Trend MT5 NG
Daniel Stein
5 (6)
FX Trend NG: The Next Generation Multi-Market Trend Intelligence Overview FX Trend NG is a professional multi-timeframe trend and market monitoring tool designed to give you a complete structural overview of the market in seconds. Instead of switching between dozens of charts, you instantly see which symbols are trending, where momentum is fading, and where strong alignment exists across timeframes. This tool is part of the Stein Investments ecosystem - 18+ tools plus Max, your 1-on-1 AI tradi
FX Power MT5 NG
Daniel Stein
5 (33)
FX Power: Analyze Currency Strength for Smarter Trading Decisions Overview FX Power is your go-to tool for understanding the real strength of currencies and Gold in any market condition. By identifying strong currencies to buy and weak ones to sell, FX Power simplifies trading decisions and uncovers high-probability opportunities. Whether you’re looking to follow trends or anticipate reversals using extreme delta values, this tool adapts seamlessly to your trading style. Don’t just trade—trade
Power Candles MT5
Daniel Stein
4.58 (12)
Power Candles - Self-Optimizing Strength Indicator Strength usually lives in a sub-window. The line runs below, the candle above, and your eye keeps connecting the two. Power Candles puts the strength into the candle itself, colored from dark red to dark green, so the chart reads at a glance and the sub-window stays closed. The indicator also finds its own settings for the symbol and timeframe in front of you. One click on [ Apply Best ] draws entry, Stop Loss and Take Profit at the exact prices
M1 Quantum MT5
Hamed Dehgani
4.2 (10)
Live Trading Signals Using M1 Quantum : Signal  (Trade executed automatically by the Quantum Trade Assistant , included free with this product.) Latest News : Version 1.64 has been released, All trades now have a Stop Loss placed behind the relevant Support/Resistance zones. The Smart Close function has also been improved to increase the EA’s performance in this version. Since August 9, the live signal has been running on Version 1.64. Price Plan: Current Price: $169 (Early Adopter Offer) Next
Atomic Analyst MT5
Issam Kassas
4.47 (60)
Atomic Analyst — MetaTrader 5 Message me on MQL5 after purchase to receive Smart Universal Expert Advisor for FREE, plus the online course, PDF manual, and private group access. Atomic Analyst brings price action, trend direction, entry and exit signals, Stop Loss and multiple Take Profit levels together on your chart. SEE THE SIGNAL. UNDERSTAND THE SETUP. Atomic Analyst organizes its analysis into clear visual information: • Buy and sell arrows to identify potential entries. • Stop Loss and mul
Crystal Heikin Ashi Signals
Muhammad Jawad Shabir
5 (4)
Crystal Heikin Ashi Signals—Professional Trend & Signal Detection Indicator Advanced Heikin Ashi Visualization with Intelligent Signal System for Manual & Automated Trading Final Price: $149 ---------> Price goes up $10 after every 10 sales . Limited slots available — act fast . Overview User Guide PDF Crystal Heikin Ashi Signals is a professional-grade MetaTrader 5 indicator that combines pure Heikin Ashi candle visualization with an advanced momentum-shift detection system. Designed for both m
Divergence Bomber
Ihor Otkydach
4.89 (94)
Each buyer of this indicator also receives the following for free: The custom utility "Bomber Utility", which automatically manages every trade, sets Stop Loss and Take Profit levels, and closes trades according to the rules of this strategy Set files for configuring the indicator for various assets Set files for configuring Bomber Utility in the following modes: "Minimum Risk", "Balanced Risk", and "Wait-and-See Strategy" A step-by-step video manual to help you quickly install, configure, and
Quant Direction MT5
Georgios Kalomoiropoulos
Quant Direction is a 3 dimensional market analysis tool. It provides a purely objective, algorithmic view of the market by calculating exact percentage-based biases across multiple dimensions simultaneously. Developed utilizing advanced AI modeling tools and subjected to thorough testing, this algorithm is engineered to read the market with unique precision. It can analyze any currency pair or financial instrument available on your platform.  Quant Direction is the ideal tool whether you are a S
Btmm state engine pro
Garry James Goodchild
5 (4)
BTMM State Engine Pro by G-Labs — Beat The Market Maker indicator for MetaTrader 5. Asian session range, London and New York kill zones, level progression (L1/L2/L3), peak formation detection (PFH/PFL), entry signals, and a multi-pair scanner from one chart. Stop scanning charts one pair at a time. The State Engine tracks the BTMM daily cycle automatically — Asian box, room boundaries, level blocks, peak formations, and filtered entries — while the scanner dashboard shows level, peak status, d
SkyHammer Signal Pro Professional No-Repaint Trend Signal Indicator with Locked Entry, SL and TP Levels SkyHammer Signal Pro is a structured trend and momentum signal indicator designed for traders who want clear, fixed, and verifiable trading signals. It works best on lower timeframes such as M1 and M5 . The indicator does not try to predict tops or bottoms. Instead, it waits for confirmed market structure, trend direction, momentum strength, volatility quality, and target space before generati
Precision Spike Detector
Francisco Mandomo Simbine
5 (2)
Precision Spike Detector V3 – Institutional-Grade AI Trading System Attention: The price increases by US$50 for every 10 purchases.  Final price: US$599 Precision Spike Detector V3   is a   state-of-the-art, institutional-grade market analysis system   for   MetaTrader 5 , designed to detect   high-probability market movements   in synthetic indices such as   Boom, Crash, GainX, and PainX . After purchase, send me a private message to receive the optimized configuration files,  the installation
The UZFX {SSS} Scalping Smart Signals v5.0 MT5  is a Non Repaint high-performance trading indicator designed for Scalpers, Day Traders, and Swing Traders who demand accurate, real-time signals in fast-moving markets. Developed by (UZFX-LABS), this indicator combines price action analysis, trend confirmation, and smart filtering to generate high-probability buy and sell signals, Warning Signals, and Trend Continuation Opportunities across all currency pairs and timeframes.  Stop second-guessing
Spike Fakeout Detector
Brighton Mufaro Mudzingwa
PainX 400 FAKEOUT DETECTOR MT5 Custom Indicator  ·  Sell-Side Bias  ·  Scalping  ·  RSI(6) Filtered   OVERVIEW   The Spike Fakeout Detector is a non repaint precision technical indicator built exclusively for Crash / PainX synthetic indices on the platform. It is engineered around one of the most consistent and exploitable patterns on this instrument — the false breakout above resistance followed by a sharp price drop. Crash/PainX is a growing index that produces a significant price drop app
Currency Strength Wizard   is a very powerful indicator that provides you with all-in-one solution for successful trading. The indicator calculates the power of this or that forex pair using the data of all currencies on multiple time frames. This data is represented in a form of easy to use currency index and currency power lines which you can use to see the power of this or that currency. All you need is attach the indicator to the chart you want to trade and the indicator will show you real s
More from author
Trend and Consolidation Matrix is an MT5 market structure and price action indicator combining a 6-layer adaptive trend ribbon, spatial consolidation zone mapping, and dynamic breakout-retest alerts for Forex, Gold (XAUUSD), and Indices. Engineered for scalping, day trading, and swing trading, this tool unifies multi-layer trend direction, volatility structure, and price density geometry calculated strictly on completed bars with zero historical repainting. Core Market Structure Architecture The
FREE
SWING DETECTOR WITH RSI AND FIBONACCI Structural Swing Points + Fibonacci Retracement + RSI Overlay -------------------------------------------------- FREE INDICATOR Identify swings. See Fibonacci levels. Check RSI. All in one free indicator. -------------------------------------------------- WHAT THIS INDICATOR DOES This indicator automatically detects structural swing highs and lows using configurable depth and deviation filtering. It connects swings with trend lines, overlays standard
FREE
SWING VOLUME PROFILE Swing-Based Volume Profile + Fibonacci + RSI -------------------------------------------------- Auto-detected swings. Volume profile. Fibonacci. RSI. All-in-one. -------------------------------------------------- WHAT THIS INDICATOR DOES Swing Volume Profile (SVP) automatically detects structural swings and displays a volume profile for the most recent completed swing — with Fibonacci retracement and RSI overlay. No manual range selection needed. The indicator finds
SWING DETECTOR WITH RSI AND FIBONACCI Structural Swing Points + Fibonacci Retracement + RSI Overlay -------------------------------------------------- FREE INDICATOR Identify swings. See Fibonacci levels. Check RSI. All in one free indicator. -------------------------------------------------- WHAT THIS INDICATOR DOES This indicator automatically detects structural swing highs and lows using configurable depth and deviation filtering. It connects swings with trend lines, overlays standard
FREE
Fixed Range Volume Profile is an MT5 volume analysis tool that calculates and displays volume distribution across any custom price and time range using standard chart trendlines for Forex, Gold (XAUUSD), Indices, and Crypto. Designed for day trading, scalping, and swing trading, this indicator automatically maps the Point of Control (POC), Value Area boundaries (VAH/VAL), and high-volume support and resistance levels without requiring manual object naming or complex setup. Core Volume Profile Ar
SWING HIGHS LOWS DETECTOR Swing Detection with Divergence Analysis -------------------------------------------------- Identify swings. Spot divergences. Trade with confluence. -------------------------------------------------- WHAT THIS INDICATOR DOES This indicator automatically detects structural swing highs and lows using configurable depth and deviation filtering. It then analyzes RSI and MACD to detect regular and hidden divergences between consecutive swings of the same type. Diver
FREE
SWING HIGHS LOWS DETECTOR Swing Detection with Divergence Analysis -------------------------------------------------- Identify swings. Spot divergences. Trade with confluence. -------------------------------------------------- WHAT THIS INDICATOR DOES This indicator automatically detects structural swing highs and lows using configurable depth and deviation filtering. It then analyzes RSI and MACD to detect regular and hidden divergences between consecutive swings of the same type. Diver
FREE
VWAP Ribbons
Charles Mwangi Ndungu
VWAP Ribbon Intelligence is an MT5 technical analysis indicator combining Volume-Weighted Average Price (VWAP), dynamic Wilder ATR volatility ribbons, and on-chart RSI momentum telemetry for Forex, Gold (XAUUSD), Indices, and Crypto. Engineered for day trading, scalping, and swing trading, this tool projects volatility expansion and momentum values directly onto the main price chart without requiring secondary subwindow oscillators. Core Analytical Architecture The indicator features a dual-mode
FREE
VWAP Ribbon Intelligence is an MT4 technical analysis indicator combining Volume-Weighted Average Price (VWAP), dynamic Wilder ATR volatility ribbons, and on-chart RSI momentum telemetry for Forex, Gold (XAUUSD), Indices, and Crypto. Engineered for day trading, scalping, and swing trading, this tool projects volatility expansion and momentum values directly onto the main price chart without requiring secondary subwindow oscillators. Core Analytical Architecture The indicator features a dual-mode
FREE
Fixed Range Volume Profile MT4 Volume Profile Indicator — Auto-Detecting Trendline Tracking, POC, Value Area & High Volume Nodes in Real Time Fixed Range Volume Profile (FRVP) displays volume distribution over a user-defined range — automatically detecting the latest trendline you draw or drag on the chart. No manual range selection. No naming conflicts. Just draw a trendline and the profile appears. Update it live by dragging. MT4 Native • No Repainting • Real-Time Trendline Tracking • Fully Cu
Adaptive Swing Density Heat Map MT4 Structural Density Indicator — Swing Clustering, Participation Tracking, Acceptance vs Rejection & Color-Coded Heat Map Adaptive Swing Density Heat Map analyzes swing point density across price levels, then tracks how price actually interacts with each zone — measuring participation, acceptance, and rejection. The result is a heat map of structural zones, color-coded by density strength. Not all support and resistance levels are equal — this indicator quantif
CONSOLIDATION INTELLIGENCE PRO MT4 Consolidation Indicator | Automatic Range Detection + 5-Tier Price-Density Heatmaps + Re-Entry Alerts Consolidation Intelligence Pro is a MetaTrader 4 indicator designed to identify areas where price repeatedly overlaps and trades within a concentrated range. The indicator analyzes candle overlap, body-to-wick structure, zone strength, and price-density distribution, then displays detected consolidation areas as 5-tier heatmaps directly on the chart. It also su
DONCHIAN MARKET & TREND INTELLIGENCE ENGINE (MT4) Multi-Factor Volatility, Trend Structure & Institutional Breakout Validation Dashboard MOST BREAKOUT INDICATORS ARE TRAPPING YOU. They Tell You THAT Price Broke Out. They Never Tell You IF It Will Hold. You have lived this scenario dozens of times: Price spends days coiling inside a tight Donchian band on your MT4 chart. A massive candle punches above the 20-period high. You buy the breakout — expecting momentum. Three candles later, price colla
BOLLINGER MARKET & TREND INTELLIGENCE MT4 Bollinger Breakout Analysis • Volatility Regimes • Trend Structure • Breakout Validation • Post-Breakout Analysis STOP GUESSING WHICH BREAKOUTS ARE REAL. You've been here before. Price closes outside the upper Bollinger Band. You see the breakout. You hesitate for a second — then enter. Three candles later, price is back inside the band. The breakout failed. Now you're wondering whether you entered too early, whether you should have waited for a retest,
VWAP Sniper Reversal
Charles Mwangi Ndungu
VWAP Sniper Reversal Pro v3.00 MT4 Mean-Reversion Indicator — Rolling VWAP, Dual-Layer ATR Bands, Volume Exhaustion, RSI Gate & Confirmation Modes VWAP Sniper Reversal Pro identifies potential mean-reversion setups at statistical price extremes. It combines a rolling volume-weighted average price (VWAP) baseline, dual-layer ATR deviation bands, volume and wick exhaustion filters, and an RSI gate to confirm reversal signals on completed bars. Built for traders who want multi-factor confluence ra
Swing Volume Profile MT5 Swing Volume Profile Indicator — Auto Swing Detection, Volume Profile, Fibonacci Retracement & RSI Overlay in One Chart Tool Swing Volume Profile (SVP) automatically detects structural swings and displays a volume profile for the most recent completed swing — with Fibonacci retracement and RSI overlay. No manual range selection. No trendline required. The indicator finds the swings and builds the profile automatically. MT5 Native • No Repainting • Auto Swing Detection •
Consolidation Intelligence Pro MT5 Consolidation Indicator — Automatic Range Detection, 5-Tier Price-Density Heatmaps & Re-Entry Alerts Consolidation Intelligence Pro automatically identifies where price repeatedly overlaps and trades within a concentrated range — then renders that structure as a 5-tier price-density heatmap directly on your chart. No more manually drawing every consolidation box. The indicator analyzes historical price structure, measures candle overlap and body-to-wick charac
DONCHIAN MARKET & TREND INTELLIGENCE The Only Donchian Tool That Tells You WHY the Market Is Moving — Not Just Where Most Donchian indicators draw three lines and call it a day. You get an upper band. A middle band. A lower band. And when price pokes above the upper band, you're supposed to just... buy? That's not analysis. That's guessing with extra steps. THE PROBLEM EVERY DONCHIAN TRADER KNOWS You've seen it a hundred times. Price finally breaks above the 20-period high after days of compress
BOLLINGER MARKET & TREND INTELLIGENCE — MT5 STOP GUESSING WHAT A BOLLINGER BREAKOUT IS TELLING YOU You've been here before. It's 2 AM. You're staring at a chart. Price has just closed outside the upper Bollinger Band. You enter. Three candles later, price is back inside the band. Then the move reverses. You tell yourself: "I should have waited for a retest." But when you wait for the retest, sometimes price continues without giving you the entry you wanted. So you add another filter. RSI. Then M
VWAP Sniper Reversal Pro is an MT5 reversal and pullback indicator combining Volume-Weighted Average Price (VWAP), dual-layer ATR volatility bands, volume exhaustion spikes, and RSI momentum filters for Forex, Gold (XAUUSD), Indices, and Crypto. Designed for scalping, day trading, and swing trading, this tool identifies market turning points when price becomes overstretched from fair value, calculating all confirmed signals strictly on completed bars with zero historical repainting. Core 4-Facto
Super Trend and Consolidation Matrix is an MT5 market structure and price action indicator combining a 6-layer trend ribbon, volatility squeeze engine, dynamic consolidation zones, and a real-time confluence dashboard for Forex, Gold (XAUUSD), and Indices. Engineered for scalping, day trading, and swing trading, this system provides objective structural analysis calculated strictly on completed bars with zero historical repainting. Core Market Structure Engine The indicator synchronizes multiple
Filter:
No reviews
Reply to review