Adaptive Swing Density Heat Map

Adaptive Swing Density Heat Map
MT5 Structural Density Indicator — Swing Clustering, Participation Tracking, Acceptance vs Rejection & Color-Coded Heat Map

Adaptive Swing Density Heat Map analyzes swing point density across price levels, then tracks how price actually interacts with each zone — measuring participation, acceptance, and rejection.

The result is a heat map of structural zones, color-coded by density strength. Not all support and resistance levels are equal — this indicator quantifies the difference.

MT5 Native • No Repainting • Adaptive to Volatility • Fully Customizable

The Idea in One Line

See where price clusters. See where price fights.

What the Indicator Does

Adaptive Swing Density Heat Map answers one core question:

Where have swings repeatedly clustered — and is price accepting or rejecting those levels right now?

The indicator detects swing points using a fractal algorithm, clusters them by ATR-based price proximity, and assigns each cluster a density score from 0 to 100%. It then tracks how price interacts with each zone over a configurable behavior window — separating genuine structural levels from weak ones.

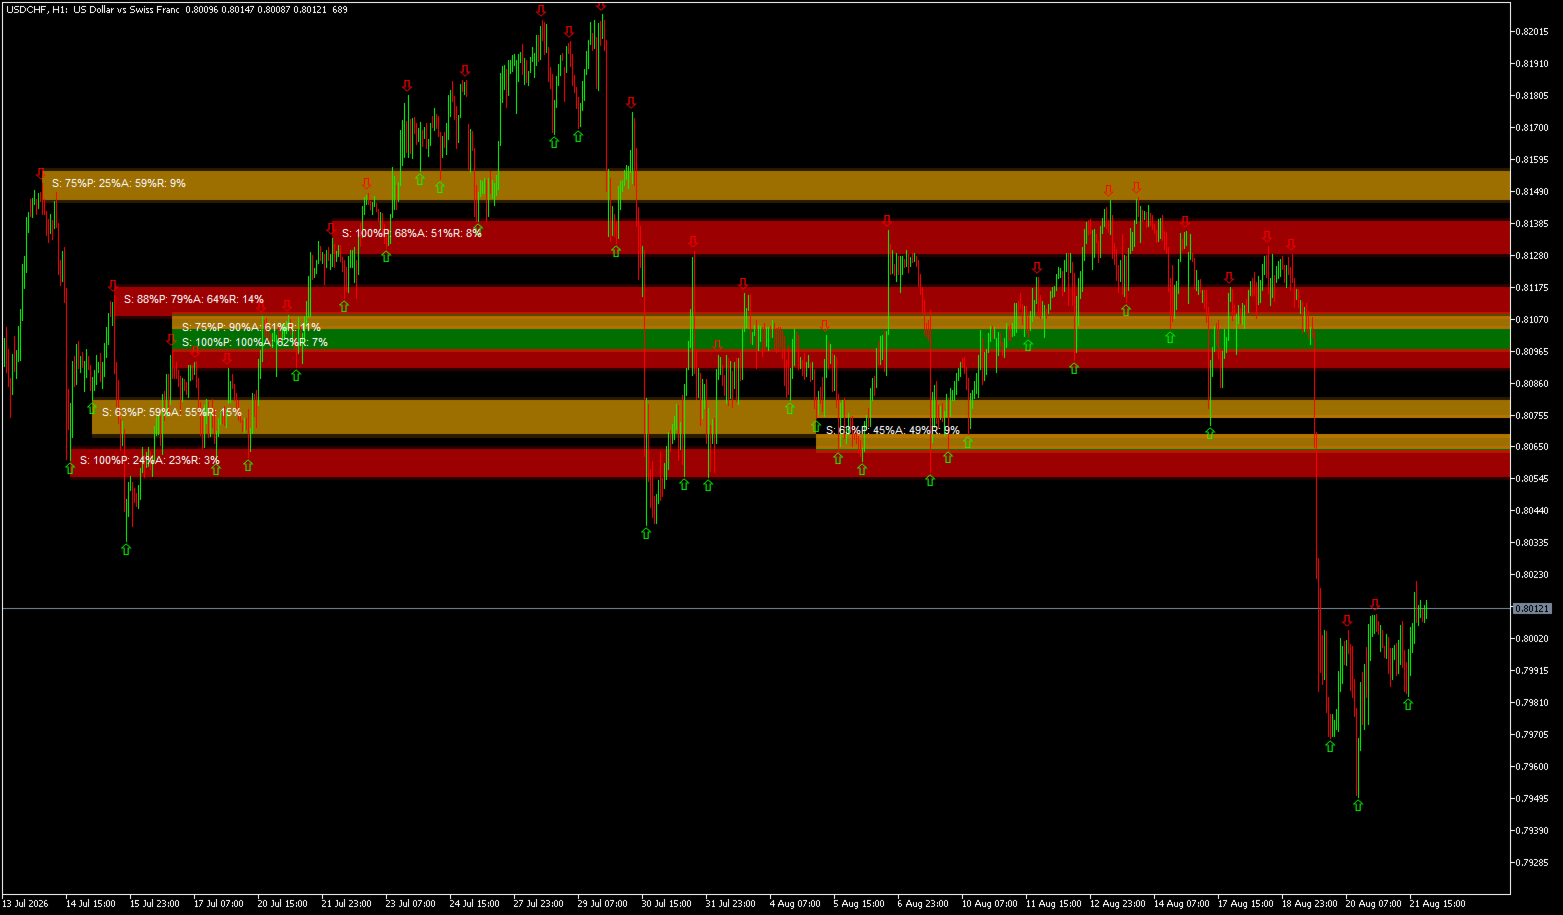
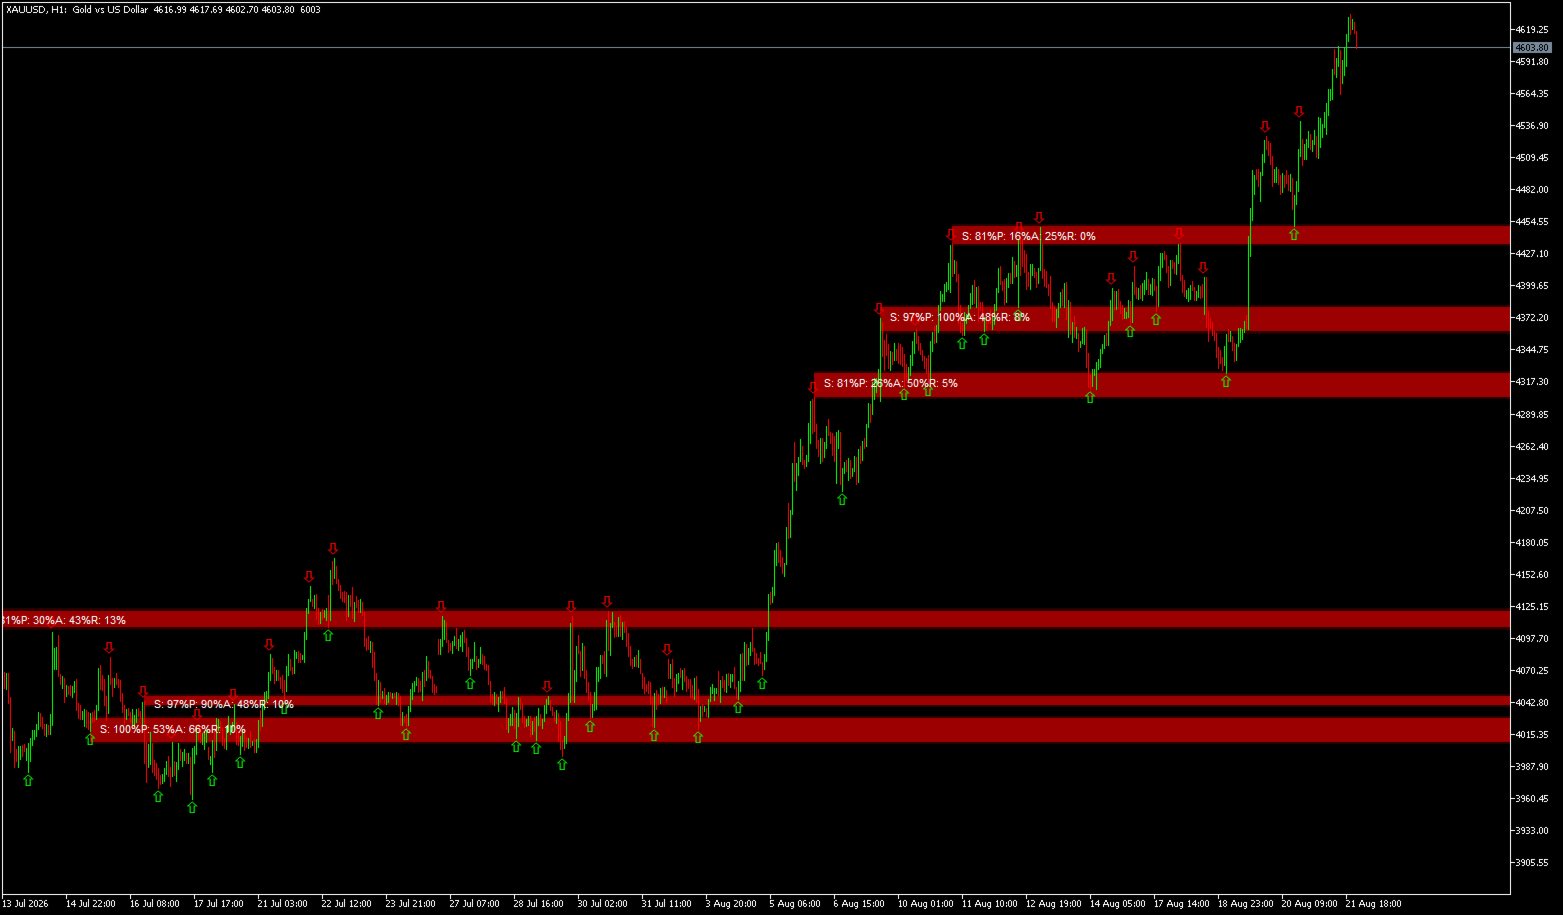
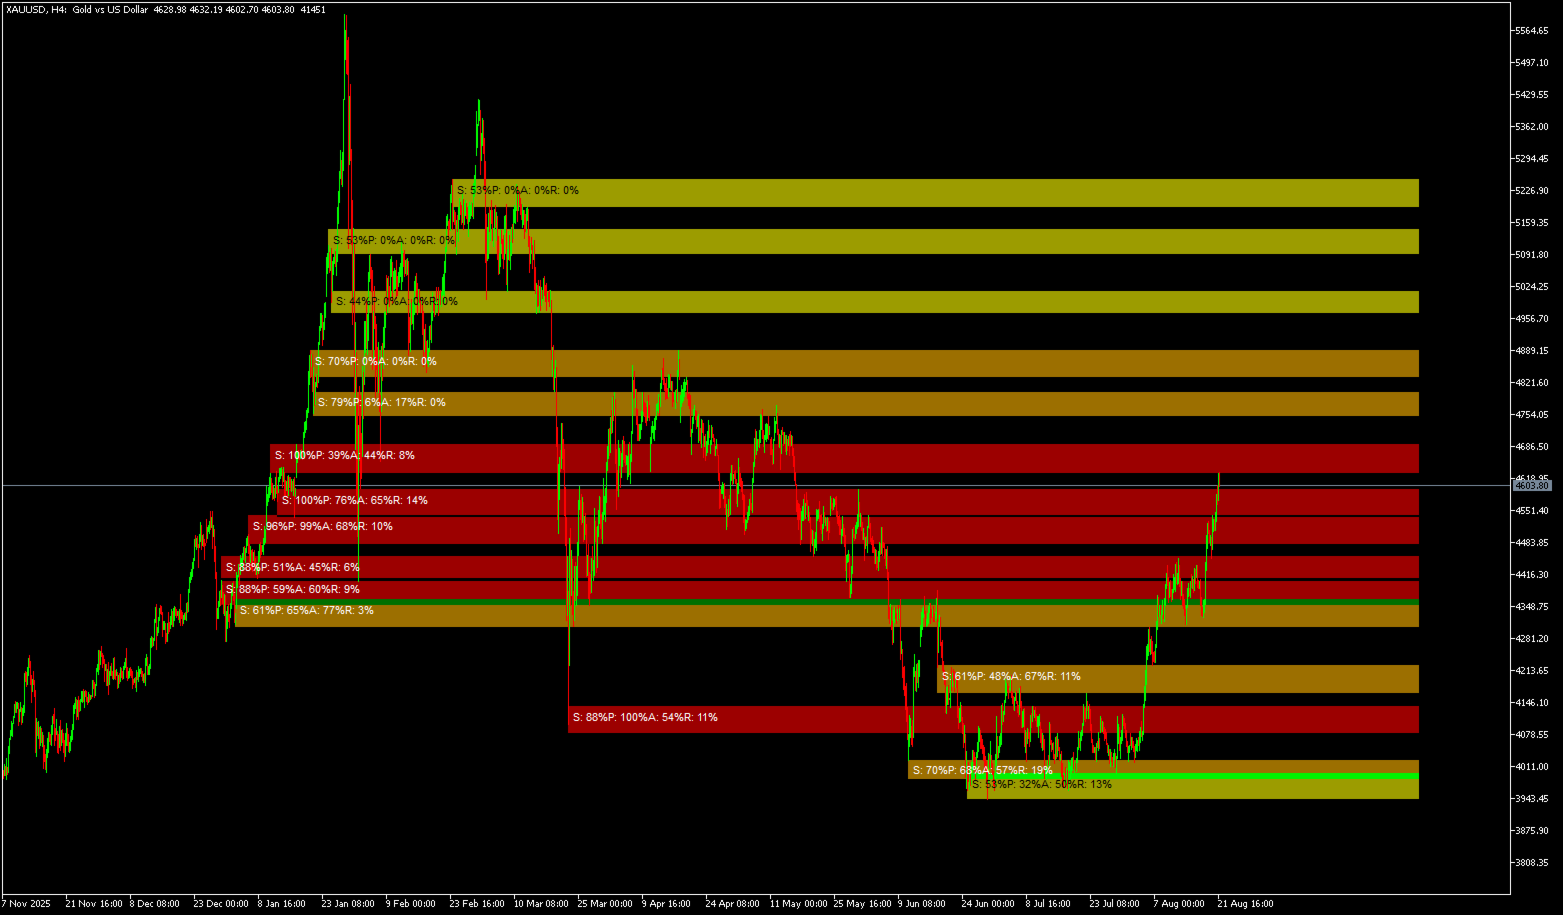
Zones are color-coded by density strength:

  • Red zones = Highest density (80–100%) — levels where price has repeatedly turned

  • Orange zones = High density (60–80%) — significant structural levels with active interest

  • Yellow zones = Moderate density (40–60%) — areas of some interest but less conviction

  • Blue zones = Low density (below 40%) — weak structural levels, best ignored

A level where many swings have clustered indicates genuine market attention. A level with only one or two touches is statistically less significant. This indicator quantifies that difference.

Core Logic and Calculation

The indicator begins by detecting swing points using a fractal algorithm. Each swing point represents a structural high or low where price reversed direction — these points are the foundation of all subsequent analysis.

Swings are then clustered by price proximity using an ATR-based radius. This radius adapts to market volatility, ensuring clusters are meaningful in both quiet and volatile conditions. Clusters that are too wide are rejected, as they represent broad ranges rather than specific levels.

Density is normalized by comparing each cluster to the top clusters in the current analysis window. This creates a 0 to 100 percent scale that remains consistent across different market conditions. A zone with 80 percent density has significantly more swing clustering than the reference zone, indicating strong structural importance.

Participation analysis measures how often price candles touch each zone. This is distinct from density — a zone may have many swings (high density) but rarely be visited (low participation). Such zones are less actionable.

Acceptance and rejection analysis distinguishes support from resistance. When price closes inside a zone, it indicates acceptance and suggests the zone is acting as support. When price leaves long wicks without closing inside, it indicates rejection and suggests the zone is acting as resistance.

A smoothing mechanism stabilizes the density reference across bars, preventing zone colors from flickering due to normal variations in which zones qualify as the strongest. This makes the indicator visually reliable and easier to interpret.

Key Strengths

Swing Density Analysis
Clusters swing points by price proximity using an ATR-based radius that adapts to volatility. The more swings at a level, the higher the density score — directly indicating structural significance.

Participation Tracking
Measures how often candles touch each zone as a percentage. A zone with high density but low participation is less actionable than one with high participation.

Acceptance vs Rejection
Tracks closes inside the zone as acceptance and wick rejections as rejection. This distinguishes support levels from resistance levels based on actual price behavior.

Adaptive Smoothing
Density reference is smoothed across bars to prevent color flickering, making the visual output stable and reliable.

Color-Coded Heat Map
Uses a Red to Blue intensity scale for instant visual interpretation of zone strength.

Fully Customizable
Swing strength, lookback, clustering radius, zone filtering, and behavior lookback are all adjustable.

Anchor Zones to Formation
Zones remain fixed to their structural formation period, preserving the context of their origin.

No Repainting
All calculations are based on historical data and do not change on the current bar, ensuring consistency for backtesting.

What You See on the Chart

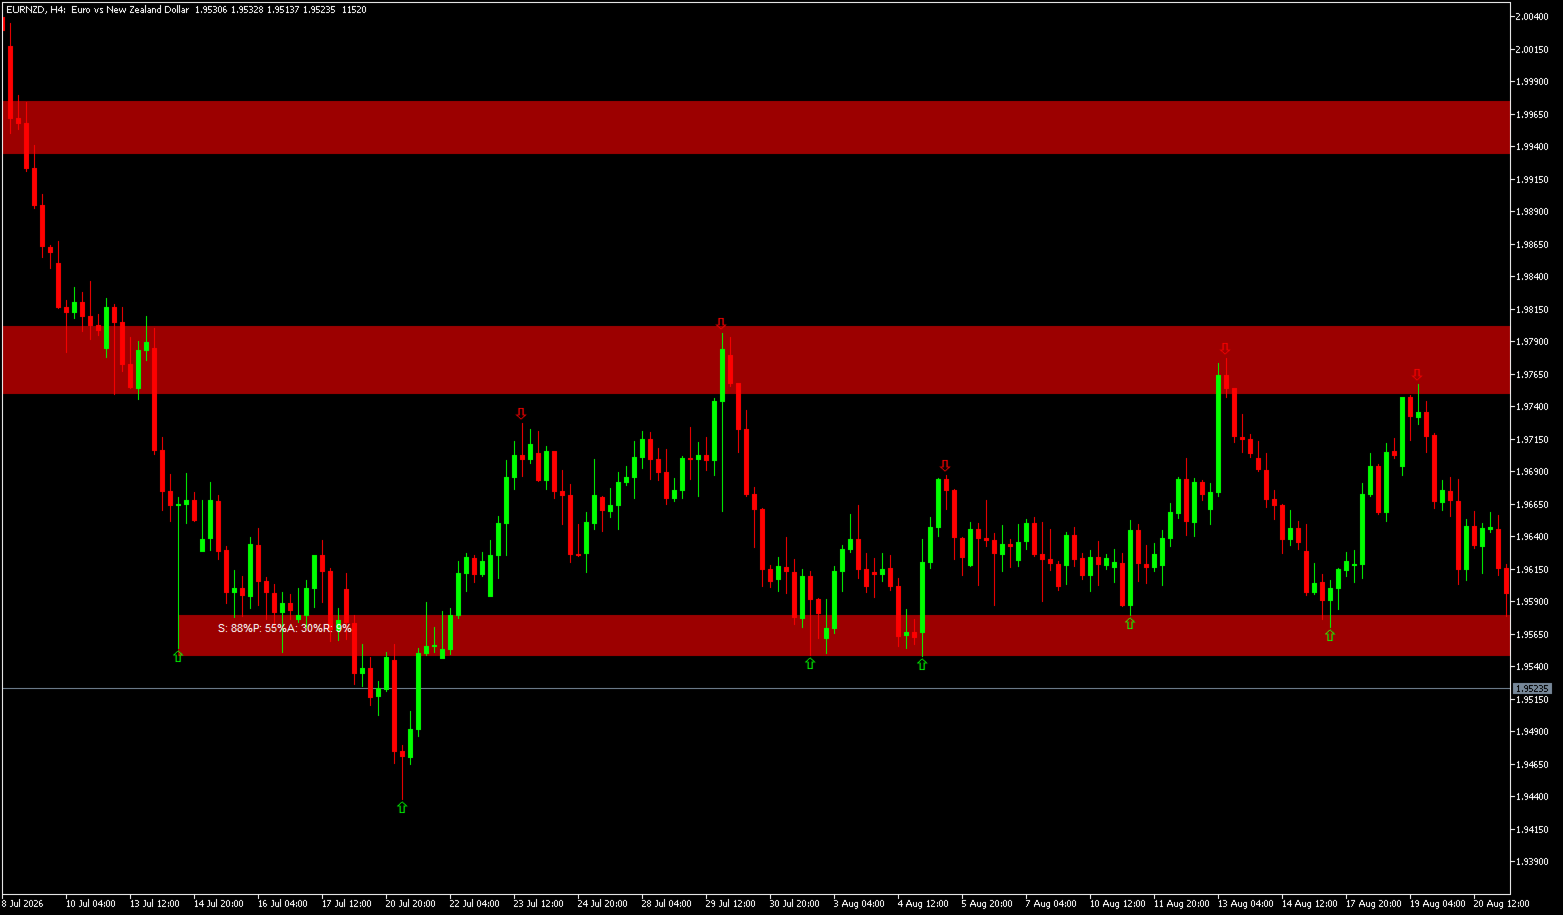
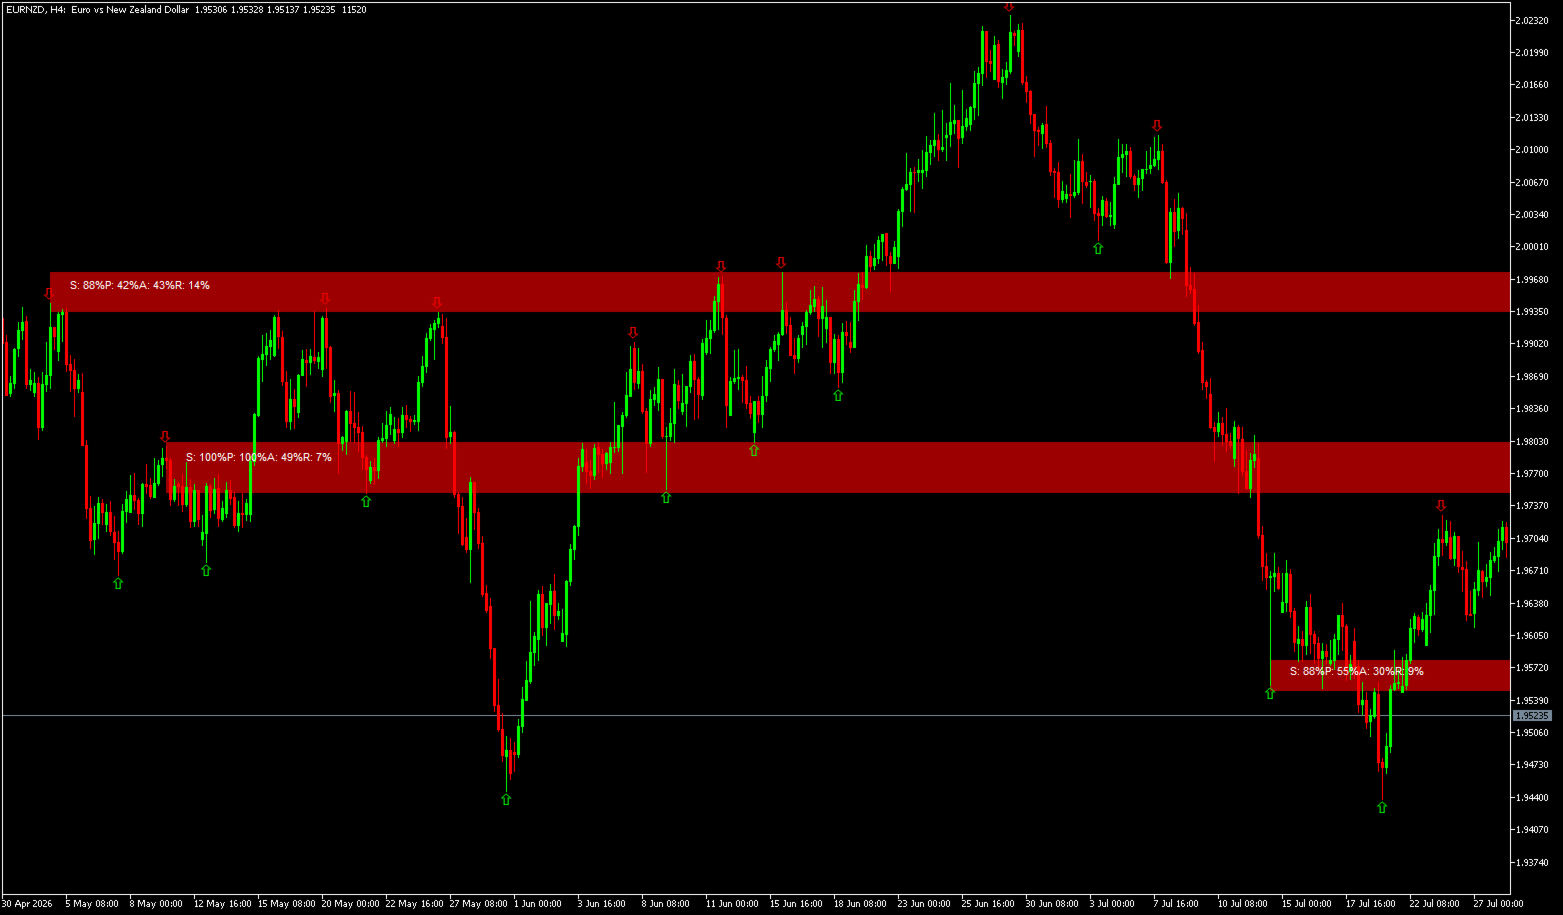
  • Red zones represent the highest density levels, indicating the strongest structural interest

  • Orange zones represent high density levels with significant swing clustering

  • Yellow zones represent moderate density levels with some market attention

  • Blue zones represent low density levels where structural interest is minimal

  • Semi-transparent halo extends above and below each zone for rejection detection

  • Data labels show Density percent, Participation percent, Acceptance percent, and Rejection percent

  • Swing high and low arrows can be toggled on or off

  • Zones auto-clean and redraw automatically on each new bar

How It Works

  1. Detects swing points using configurable strength and lookback limits.

  2. Clusters swings by price proximity using an ATR-based radius that adapts to volatility.

  3. Filters clusters by compactness — rejecting zones that are too wide.

  4. Assigns density scores normalized from 0 to 100 percent.

  5. Analyzes price behavior around each zone to measure participation, acceptance, and rejection.

  6. Draws a color-coded heat map with data labels and halo extensions.

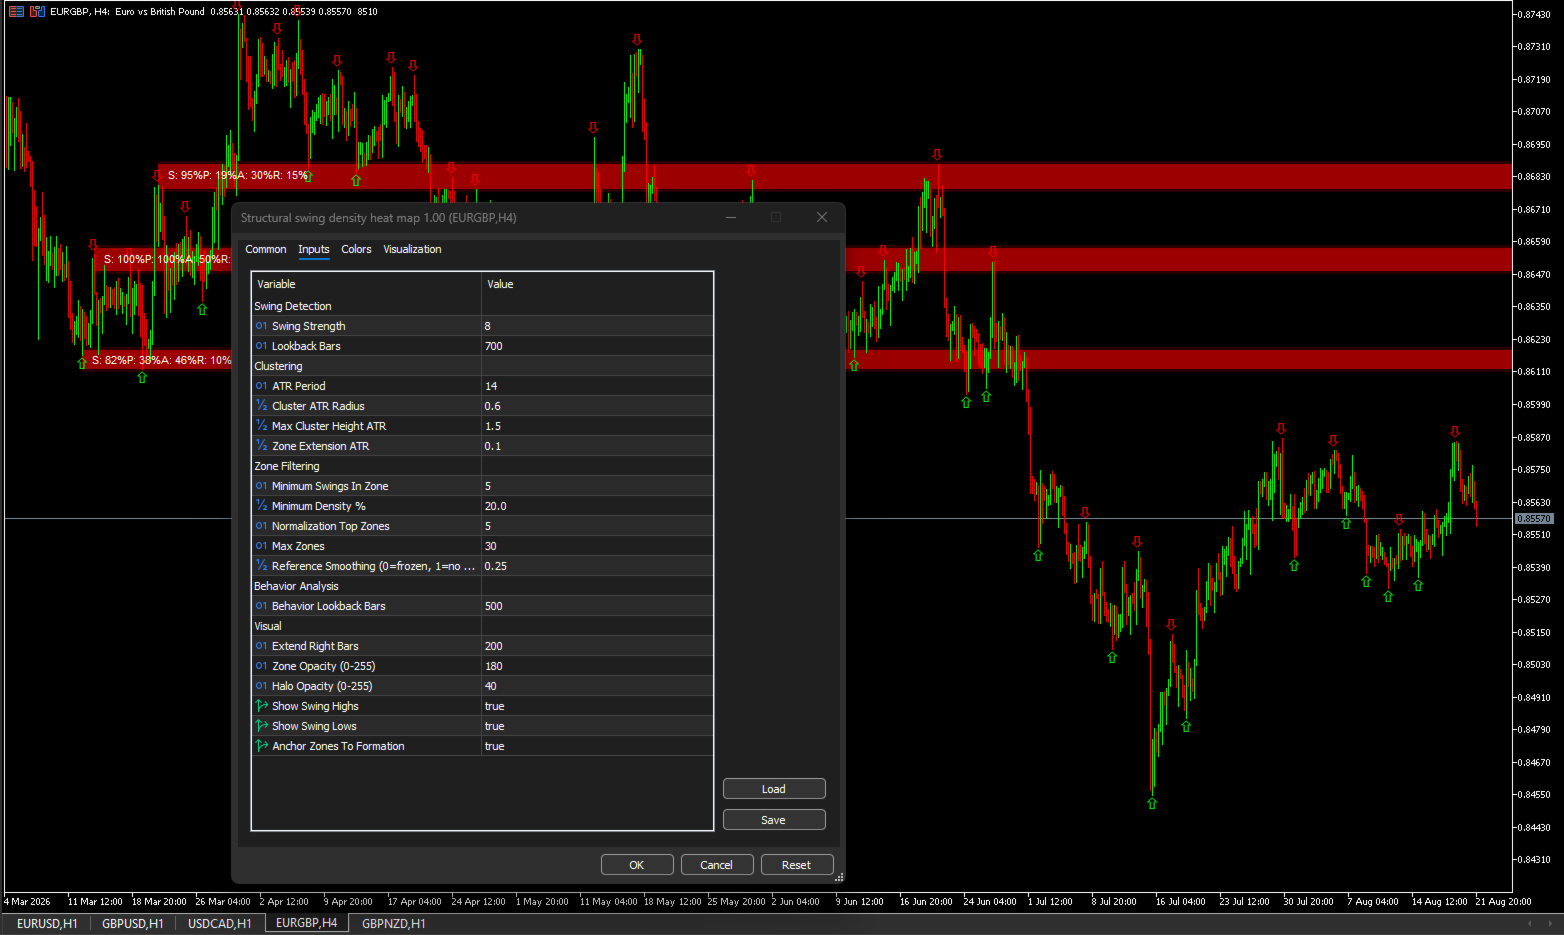
Detailed Parameter Guide

Swing Detection Parameters

Swing Strength
Controls how many bars are checked on each side of a bar to determine if it is a swing high or low. Higher values produce fewer, more significant swings by requiring more bars to confirm a turn. Lower values produce more swings, including smaller structural moves.
Default: 12 — works well on H1 charts. For M5, consider 8 to capture more movement. For H4, consider 16 to filter out minor noise. The key is finding the balance where swings represent meaningful turns rather than noise.

Lookback Bars
Limits how far back the indicator searches for swings.
Default: 1000 bars. This is a performance optimization that prevents the indicator from scanning the entire chart history. On longer timeframes like D1 or W1, you may need to increase this value. On shorter timeframes like M1 or M5, you can decrease it. The indicator will still draw zones from the lookback period; older history is ignored.

Clustering Parameters

ATR Period
Determines the period used for ATR calculation, which affects the adaptive radius for clustering.
Default: 14 — standard for volatility measurement. In volatile markets, consider a shorter period for more responsive clustering. In quiet markets, consider a longer period for more stable clustering.

Cluster ATR Radius
Determines how close swing points must be to cluster together. The value is multiplied by the current ATR. Higher values create wider clusters, capturing more swings at the cost of precision. Lower values create tighter clusters with fewer swings but greater accuracy.
Default: 1.0 × ATR. In volatile markets, consider lowering this to keep clusters tight. In quiet markets, consider raising it to capture enough swings for meaningful clusters.

Max Cluster Height ATR
Rejects clusters that are too wide. A cluster with a wide price range indicates the swings are not actually clustered at a specific level.
Default: 1.5 × ATR. Any cluster wider than this is rejected as too diffuse. This ensures zones represent genuine structural levels rather than broad ranges.

Zone Extension ATR
Controls the halo size around each zone, used for rejection detection. When price touches the halo but fails to close inside the zone, it is counted as a rejection.
Default: 0.0 (no extension). Setting this to 0.5 × ATR captures rejections that occur just outside the zone, which is valuable for identifying resistance levels.

Zone Filtering Parameters

Minimum Swings In Zone
Sets the minimum number of swings required to form a zone.
Default: 4. Zones with fewer swings are rejected as too sparse. This prevents drawing zones on isolated swings that do not represent repeated market interest.

Minimum Density Percent
Filters out weak zones. Only zones with density above this threshold are displayed.
Default: 20 percent. Increasing this value to 40 percent will show only the strongest zones, reducing chart clutter. Decreasing it to 10 percent will show more zones but include weaker ones.

Normalization Top Zones
Determines how density is normalized. The indicator takes the top N zones by swing count and averages their swing counts to create a reference.
Default: 5. This reference is used to calculate density percentages for all zones. A zone with 10 swings when the top 5 zones average 5 swings would have 200 percent density, capped at 100.

Reference Smoothing
Smooths the density reference across bars to prevent color flickering.
Default: 0.25. A value of 0 freezes the reference, preventing color changes entirely. A value of 1 uses the raw reference from each bar, allowing colors to change more freely. The default provides a good balance between stability and responsiveness.

Behavior Analysis Parameters

Behavior Lookback Bars
Controls how many bars are analyzed for participation, acceptance, and rejection.
Default: 500. Longer lookbacks provide more statistically significant behavior analysis but may include outdated price action. Shorter lookbacks focus on recent behavior but may lack sufficient data. For swing trading on H4 and above, consider 500 to 1000. For day trading on H1 and below, consider 200 to 500.

Visual Parameters

Extend Right Bars
Projects zones forward by a specified number of bars.
Default: 200. Useful for anticipating potential support and resistance levels ahead of price. Reducing this value keeps zones closer to current price.

Zone Opacity
Controls the transparency of the zone core. Range is 0 to 255, with higher values being more opaque.
Default: 180. Lower values create more transparent zones that allow price action to be seen underneath.

Halo Opacity
Controls the transparency of the halo extension.
Default: 40 — creates a subtle visual that does not obscure price action. Higher values make the halo more visible.

Show Swing Highs and Lows
Toggles the display of swing point arrows on the chart.
Default: true for both. Disabling these reduces chart clutter while preserving the zone display.

Anchor Zones To Formation
When enabled, zones remain fixed to their structural formation period rather than extending to the current bar.
Default: true — preserves the context of each zone's origin.

Practical Usage Guide

The primary use of this indicator is to identify genuine structural levels for entries, exits, and stop placement. Red zones are your strongest levels. They represent price levels where swings have repeatedly clustered, indicating institutional interest. These zones are the most reliable for support and resistance decisions.

To interpret a zone, examine the four metrics displayed in the label:

  • Density tells you how strong the zone is relative to others.

  • Participation tells you whether price actually visits the zone.

  • Acceptance tells you if price closes inside — meaning the zone acts as support.

  • Rejection tells you if price leaves long wicks — meaning the zone acts as resistance.

A high density zone with high acceptance (above 50%) is a strong support level. Price tends to hold above this zone, making it suitable for buy entries and stop placement below.

A high density zone with high rejection (above 50%) is a strong resistance level. Price tends to reverse at this zone, making it suitable for sell entries and stop placement above.

A zone with high density but low participation (below 20%) may be less reliable. The market has shown interest through swing clustering but has not recently interacted with the level. Consider waiting for a touch and reaction before trading.

A zone with low density but high participation may be a temporary area of interest rather than a structural level.

For the most reliable trades, combine high density with high participation. These are zones where price has historically fought. When price returns to a high density zone, watch for acceptance or rejection to confirm the direction. Entry can be made on rejection candles or close confirmations.

Practical Example

On a EURUSD H1 chart, you observe a red zone (density 85%) between 1.0850 and 1.0875. The label shows S:85, P:65, A:40, R:35. This indicates strong swing clustering, active participation, moderate acceptance, and moderate rejection. The zone has not shown a clear direction yet.

Price approaches the zone from above, touching the halo and leaving a long lower wick. The rejection count increases to 45%. This suggests the zone is acting as resistance. You consider a sell entry with a stop above the zone.

Alternatively, price approaches the zone from below and closes inside. The acceptance count increases to 50%. This suggests the zone is acting as support. You consider a buy entry with a stop below the zone.

Recommended Workflow

  1. Attach the indicator to your chart with default settings.

  2. Identify the highest density zones, shown in red and orange.

  3. Check participation, acceptance, and rejection metrics for each zone.

  4. Use acceptance zones as support and rejection zones as resistance.

  5. Confirm with price action, such as candlestick patterns, before entering trades.

Practical Use Cases

  • Identify high-density structural zones where the strongest levels are located

  • Distinguish acceptance zones that act as support from rejection zones that act as resistance

  • Avoid low-density, low-participation areas that are unlikely to hold

  • Find structural clusters for entry and exit placement with higher probability

  • Use as confluence with trend indicators or order flow analysis

Technical Notes

  • Overlay indicator that draws directly on the price chart

  • Works on any timeframe from M1 to MN1

  • Works on any symbol including forex, commodities, indices, and crypto

  • Adaptive to volatility via ATR-based radius calculations

  • No repainting — all calculations are historical and do not change on the current bar

  • Optimized for performance with once-per-bar recalculation and configurable lookback limits

  • Compatible with MetaTrader 5

Support

Lifetime updates included. For assistance, click Developer's Profile below.

Adaptive Swing Density Heat Map — MT5 Structural Density Indicator | Swing Density Heat Map | Swing Clustering Indicator | Participation Tracking | Acceptance Rejection Analysis | Support Resistance Heat Map | ATR Adaptive Zones | Structural Levels MT5 | High Density Zones | No Repaint Heat Map | Market Structure Indicator | Swing Point Analysis | Price Cluster Indicator | MT5 Heat Map Indicator | Order Flow Alternative | Institutional Levels Indicator
Produtos recomendados
Adaptive Math Zones Indicator é um indicador profissional para MetaTrader 5, desenvolvido para automatizar a visualização da estrutura de mercado por meio de canais matemáticos, zona neutra e projeções de preço. O indicador constrói automaticamente o canal de referência, identifica a zona neutra e projeta níveis futuros (50%, 100% e 200%), facilitando a leitura do mercado e reduzindo erros comuns do desenho manual. É uma ferramenta discricionária, criada para traders que já operam com estrutura,
This easy to setup indicator shows you the market volumes in a different way, with support and resistance as showed. You can setup: - Backdays volume to show - Heiken Ashi candle view It works for every kind of graph and every kind of period. The program shows the volumes based on the number of candles displayed in the chart: the more candles the more volumes. Enjoy this very useful indicator. Please feel free to message me to report any kind of improvements! :D
MFOP Market Forecast
Oscar Josue Pin Bacuzoy
Desenvolva este indicador por períodos de 30 minutos ou mais, concentre-se em acertar as tendências do mercado e garantir que elas sejam atendidas. O MFOP v8.1 vai direto ao ponto: ele analisa o mercado e informa exatamente quando há força suficiente para entrar em uma negociação. Este indicador não faz mágica, ele usa algoritmos matemáticos para filtrar o ruído do mercado, não entrar em falsos rompimentos e mostrar oportunidades claras de COMPRA (seta azul) e VENDA (seta vermelha). Ele foi pr
ICT Institutional Zones Pro
Celestine Anyango Wabomba
ICT Institutional Zones Pro — Trade with Institutional Precision Stop wasting time manually drawing key ICT levels every day. ICT Institutional Zones Pro is a professional-grade MT5 indicator built for traders who use ICT (Inner Circle Trader) and Smart Money Concepts (SMC) to read market structure with precision. This indicator automatically maps the most important institutional levels directly on your chart, helping you instantly identify where smart money is likely accumulating, distributing
Strength Candles
Luis Paulo Rodrigues Pastor
Indicador em formato de histograma, que é calculado utilizando dados do volume financeiro, volume em ticks e o corpo da barra. É possível visualizar momentos onde houve uma grande entrada de volume, tanto financeiro como em ticks, e que o mercado conseguiu progredir e avançar em um sentido (para cima ou para baixo) devido ao tamanho do corpo da barra, que é onde realmente houve uma vitória de um dos lados da negociação (compradores e vendedores). Por default todas as barras do histograma do ind
AURUM MID-QUANT PRO v5.60 Quantitative Excellence for Gold (XAU/USD) & Volatility Trading Gain a professional edge over institutional markets with AURUM MID-QUANT PRO , an advanced Price Action Pattern Detection and Breakout Engine designed exclusively for MetaTrader 5 . Built specifically to capture the unique volatility of Gold (XAU/USD) and other major financial instruments, this powerful indicator combines high-precision algorithmic pattern recognition with real-time dynamic accumulation z
Linear Trend Predictor - Um indicador de tendência que combina pontos de entrada e linhas de apoio de direção. Funciona com base no princípio de quebrar o canal de preço alto/baixo. O algoritmo do indicador filtra o ruído do mercado, tem em conta a volatilidade e a dinâmica do mercado. Capacidades do indicador  Utilizando métodos de suavização, mostra a tendência do mercado e os pontos de entrada para abrir ordens de COMPRA ou VENDA.  Adequado para determinar os movimentos de mercado de curto
Spike Oscillator
Vitalii Kondratiuk
Indicator for searching for price reversals Works well on commodity indices and currency pairs On charts such as Boom Cash, it shows the beginning of a protracted movement well. You can also catch splashes. The indicator uses algorithms, an oscillator and a trend indicator that work together. The indicator shows a candle opening signal (does not disappear, does not redraw and does not recalculate its readings) A good quality tool that can become the basis for creating your own trading system.
is a versatile analytical tool designed for both advanced traders and beginners. It combines classic trend line analysis with automatic Fibonacci level plotting to deliver precise market entries and structural clarity. Built as an intuitive and clean on-screen dashboard, this indicator simplifies multi-timeframe analysis without cluttering your main workspace. Technical Analysis and Entry Points The indicator automates the most critical aspects of price action and structural trading: Trend L
Este indicador é um indicador para análise automática de ondas que é perfeito para negociações práticas! Caso... Nota:   Não estou acostumado a usar nomes ocidentais para classificação de ondas. Devido à influência da convenção de nomenclatura de Tang Lun (Tang Zhong Shuo Zen), nomeei a onda básica como   uma caneta   e a banda de onda secundária como   um segmento   . ao mesmo tempo, o segmento tem a direção da tendência.   O segmento de tendência principal   é nomeado (esse método de nomencl
Description: EuroPulse MACD Hist Flow — EMA200 Trend Filter with MACD Histogram EA (Swap-Free) PRODUCT OVERVIEW EuroPulse MACD Hist Flow is a premium automated trading solution designed for MetaTrader 5, specialized for the EURUSD currency pair. The EA implements a robust trend-following strategy: • EMA200 as long-term trend filter • MACD Histogram for momentum confirmation • ATR-based stop loss and take profit • Daily loss protection • Swap-Free mode for Islamic accounts WHY EUR
This is a simple arrow system based on Engulfing Candlestick Pattern. It gives you alerts on your smartphone when there is an engulfing candlestick pattern happens. Which type of alerts available? 1. It paints on chart Up/Down Arrows. 2. Popup message and sound alert in trading terminal window. 3. Push notification or Alert on your Android and IOS mobile phones (requires MT4 or MT5 app installed!) *Note: Use it on higher timeframes like H4 (4 hours), D1 (1 Day) then find trade opportunities on s
The Premium RangeXpert Extension with Multi-Timeframe Trading Signals for Forex, Gold & Bitcoin RangeXpert+ is the premium extension of the well-known RangeXpert — one of the Top-10 free indicators on the market, with over 10,000 downloads and an extremely active community. While the free version delivers precise breakout signals on a single chart, RangeXpert+ provides exactly what professional traders demand: a complete multi-timeframe cockpit directly in your chart, perfectly optimized for h
Introducing RSIScalperPro - the revolutionary RSI-based indicator for Metatrader 5, specifically designed for scalping in the one-minute chart. With RSIScalperPro, you'll have a powerful toolkit for precise entry and exit signals to take your trading to the next level. RSIScalperPro utilizes two different RSI indicators that provide clear signals for overbought and oversold areas. You can customize the time periods and limit values of the two RSIs according to your preferences to achieve the be
The  OBV MTF  is an Enterprise-grade On-Balance Volume indicator that transforms standard OBV into a complete trading system. It combines gradient-aware momentum analysis, divergence detection, multi-timeframe alignment, and dynamic customisable midpoint-filtering in a single intuitive professional volume analysis tool. Core Features 1. 5-State Momentum Engine Aqua (Strong Bullish) : OBV slope rising with positive acceleration SteelBlue (Weak Bullish) : OBV rising but losing momentum Gray (Neutr
Aussenstab Markttechnik
Alexander Josef Zeidler
This indicator shows external bars ("Aussenstäbe") in the chart in candle form. The colors of the candles can be set individually. Also different colors for bearish and bullish bars are possible. In addition, the color of the wicks or outlines is also adjustable. Outside bars are mentioned e.g. by Michael Voigt in the book "Das große Buch der Markttechnik". All other candles are inner bars.
O que ele faz - 174 variantes fixas de estratégia em 31 grupos, cada grupo com peso fixo - Bitcoin e Ethereum: entradas de rompimento, tendência Keltner e médias móveis no H1 e H4, tendência e momentum diários, entradas de expansão de range no H4, H6 e H8, Ichimoku no H8, squeeze de Bollinger no H12 - USDJPY e Brent: tendência e momentum diários. Ouro: rompimento H4 e tendência Keltner - Toda operação tem stop loss. Saídas por trailing stop, saída de canal, sinal oposto ou tempo, conforme a est
Link to our products: LINK The ICT Asian Killzone Indicator delivers a professional, institutional-grade framework by precisely defining the Asian trading session from 00:00 to 04:00 GMT with absolute accuracy. It streamlines market structure analysis by isolating liquidity accumulation, range formation, and volatility compression during the Asian session. Built for serious ICT and Smart Money traders, it enhances strategic decision-making, execution confidence, and Tokyo session directional bi
Product Name: Fair Value Channel Consolidation Breakout THE MACHINE LEARNING HAVE BEEN DESACTIVATED FOR A EASY TEST!!( OBS: IF THE CLIENT WANT IT WE CAN INTEGRATE IT EASILY) ATTENTION !!!! THE RIGHT INPUTS TO USE IN XAU/USD  CAN BE VIZUALIZED IN THE SCREENSHOTS, IF THE INPUTS ARE NOT USED THE RESULT CAN DIFFERS! TAKE PROFIT , SELL LOSS AND TRAILLING STOP CAN BE CHANGED IF YOU DESIRE Stop trading the past. Start trading the true Fair Value. Fair Value Channel Consolidation Breakout  is not just
MULTICANDLE SCANNER DASHBOARD PRO MT5: Institutional Multi-Pair Multi-Timeframe Price Action Scanner with Dynamic ATR SL/TP & 16-Filter Confluence Engine PRODUCT TYPE Category: MetaTrader 5 Multi-Asset Technical Scanner & Trading Dashboard Strategy Engine: Multi-Candle Price Action Momentum (4C / 5C / 6C Patterns) Signal Integrity: 100% Non-Repainting Execution (Strict Bar-Close Confirmation) Trading Styles: High-Frequency Scalping (M1/M5), Day
Aegis XAU Extreme Edition Overview Aegis XAU Extreme Edition is a trend-following Expert Advisor designed exclusively for XAUUSD M1 . Rather than trading throughout the entire day, it focuses only on carefully selected trading sessions identified through extensive historical testing. By avoiding statistically unfavorable hours, the EA aims to improve overall trading efficiency while maintaining consistent long-term performance. The strategy combines: EMA Trend Filter EMA Pullback Entry ADX Tr
Bestofthebest
Francisco Marcio Serafim
o melhor indicador que eu criei para scalper e day trade esquece o resto e estuda nesse até logo. Essse indicador mostra pontos de exaustao do preco com base nos movimentos se mostrou ao longo de meses muito efetivo no par xauusd com metodo de scalping e martingale torna o muito acertivo estude  e tire proveito desse indicador ao maximo ate pegar confiança. busque entrar devagar e aumente a mao na medida certa espero que melhore seus trades em muito mais que 100% obg.
An all‑in‑one trading assistant that blends AI candle synthesis with a 15‑pattern Heat Map, ATR‑scaled S/R & pivots, and a Vigilant risk monitor (LOC/TF/SR/PAT gates, Ready%, EM points, SR‑distance bar). The Opportunity Advisor adds ETAs, checklists and gate status; Multi‑TF Confluence confirms alignment from M1–D1. The Professional Trade Suggestion panel shows regime, session filter, R:R presets, Partials and Quality Pause. Clean, readable UI with one‑click S/R toggles, scanners and a built‑in,
Anchored VWAP Trading Indicator Struggling to identify true market value and key support/resistance levels? The Anchored VWAP Trading Indicator helps you track price based on real traded volume, giving you a clear edge in your trading decisions. This tool allows you to anchor VWAP from any point on the chart, making it ideal for analyzing trends, reversals, and institutional activity. Key Features Anchored VWAP from any candle Accurate volume-weighted price calculation Works on all symbol
Inspired by the popular beat the market maker Multi MA. Now available for MT5 to be utilized. Multi Exponential Moving Average (Multi-EMA) Indicator for MT5 The Multi-EMA Indicator is designed to help traders visualize multiple exponential moving averages on one chart with precision and clarity. It plots five customizable EMA lines, each with distinct colors, making it easy to identify market trend direction, strength, and potential reversal zones at a glance. Key Features: Plots five indepen


ForeCastX AI
Marco Engstermann
ForeCastX AI é um indicador de gráfico para MetaTrader 5. Mostra coloração de tendência por swings, setas de compra e venda, zonas de oferta e demanda, um painel de força compra/venda em vários timeframes e um caminho opcional. O caminho é um desenho visual com base na estrutura recente e no painel. Não é previsão de preço nem sinal de negociação por si só. No gráfico Candles coloridos pela tendência de swing atual Setas quando o preço rompe um máximo ou mínimo de swing confirmado Retângulos de
Harraz Master HUD
Muhammad Azraf Bin Dzul Fauzi
HARRAZ MASTER HUD v4.4 - The Ultimate Neural Trading Command Center ​ Transform your MetaTrader 5 into a professional, institutional-grade trading terminal. Harraz Master HUD is not just an indicator; it is a complete Artificial Intelligence ecosystem designed specifically for XAUUSD (Gold) and major pairs. ​ EXCLUSIVE FEATURES: ​1. Live Neural AI Typewriter (Jarvis Mode) Experience a live, animated Heads-Up Display that types out real-time market sentiment and advice. It acts as your persona
Gann Box MT5
Frederic Jacques Collomb
O indicador Gann Box é uma ferramenta poderosa e versátil projetada para ajudar os traders a identificar e explorar os níveis-chave do mercado. Este indicador permite desenhar um retângulo no gráfico, que é automaticamente dividido em várias zonas com níveis estratégicos 0, 0.25, 0.50, 0.75, 1 . Quando o preço atinge um desses níveis, alarmes são acionados, oferecendo assim uma ajuda valiosa para as decisões de trading. Você sabe instantaneamente como o mercado está evoluindo em relação à zona q
【Super Scanner】Indicator Introduction : The color of the Super Scanner which is green and climbing up means that the price trend is going up.The color of the Super Scanner is red and going down means that the price trend is going down. It is very simple to use it to judge the market trend! What's even better is that the open parameters of the indicators allow investors to adjust. You can adjust【Super Scanner】according to your needs. Adjust it faster to be closer to short-term market fluctuatio
ICT Market Time Cycle MT5 – Complete Session & Time Window O ICT Market Time Cycle é um indicador de trading profissional projetado para ajudar os traders a seguir a metodologia ICT (Inner Circle Trader) com facilidade. Ele exibe automaticamente as principais sessões de mercado (Ásia, Londres e Nova York), juntamente com Killzones, janelas do Silver Bullet e horários Macro diretamente no seu gráfico. Com esta ferramenta, você não precisa mais calcular os horários das sessões manualmente – tudo é
Os compradores deste produto também adquirem
Trend Sniper X
Sarvarbek Abduvoxobov
4.9 (40)
Trend Sniper X é um indicador de acompanhamento de tendência para múltiplos tempos gráficos no MetaTrader 5 que ajuda os traders a identificar a direção da tendência e potenciais pontos de reversão com clareza e precisão. para MT4: https://www.mql5.com/en/market/product/193245 Informações sobre o preço: O preço atual é promocional e está sujeito a alterações à medida que novas atualizações e funcionalidades forem lançadas. Oferta Bônus: Para obter o Auto-Trade Assistant EA GRATUITO para este in
Smart Trend Trading System — MetaTrader 5 Após a compra, envie-me uma mensagem no MQL5 para receber Smart Universal Expert Advisor GRÁTIS, além do curso online, do manual em PDF e do acesso ao grupo privado. O STTS reúne a direção da tendência, sinais de entrada e saída, zonas de reversão e níveis de preço importantes diretamente no seu gráfico. Siga o sistema manualmente ou conecte um EA compatível separado para executar operações automaticamente com as configurações que você escolher. UM SISTE
ARIPoint
Temirlan Kdyrkhan
1 (4)
ARIPoint is a powerful trading companion designed to generate high-probability entry signals with dynamic TP/SL/DP levels based on volatility. Built-in performance tracking shows win/loss stats, PP1/PP2 hits, and success rates all updated live. Key Features: Buy/Sell signals with adaptive volatility bands Real-time TP/SL/DP levels based on ATR Built-in MA Filter with optional ATR/StdDev volatility Performance stats panel (Success, Profit/Loss, PP1/PP2) Alerts via popup, sound, push, or email Cu
SuperScalp Pro
Van Minh Nguyen
4.66 (35)
SuperScalp Pro - Professional Multi-Layer Confluence Scalping System SuperScalp Pro é um indicador avançado de scalping que aprimora o Supertrend clássico com vários filtros inteligentes de confirmação. Ele ajuda a identificar oportunidades de Buy/Sell com maior probabilidade, reduzindo significativamente os sinais falsos. Setas claras de Buy e Sell aparecem diretamente no gráfico, enquanto os níveis de Stop Loss e Take Profit baseados em ATR são calculados automaticamente em tempo real. Após a
Gann Made Easy   é um sistema de negociação Forex profissional e fácil de usar, baseado nos melhores princípios de negociação usando a teoria do sr. W. D. Gann. O indicador fornece sinais precisos de COMPRA e VENDA, incluindo níveis de Stop Loss e Take Profit. Você pode negociar mesmo em movimento usando notificações PUSH. Entre em contato comigo após a compra para receber instruções de negociação e ótimos indicadores extras gratuitamente! Provavelmente você já ouviu muitas vezes sobre os método
SMC Intraday Formula
VividMind Digital Solutions
5 (26)
Vamos ser honestos primeiro. Nenhum indicador sozinho vai te tornar lucrativo. Se alguém te disser o contrário, está te vendendo um sonho. Qualquer indicador que mostre setas perfeitas de compra/venda pode ser feito para parecer impecável — basta dar zoom na parte certa da história e tirar um print das operações vencedoras. Nós não fazemos isso.  SMC Intraday Formula é uma ferramenta. Ela lê a estrutura do mercado para você, identifica as zonas de maior probabilidade de preço e mostra exatament
Um novo Rei chegou à cidade - Indicador + Gestão de Ordens (TP1 + TP2 + TP3) + Enviador opcional de sinais para Telegram INCLUÍDO (GRÁTIS) (SISTEMA COMPLETO DE TRADING e SINAIS) Nosso melhor EA para Ouro: Gold Slayer Este indicador inclui uma estratégia avançada, um sistema de trading com gestão de ordens personalizável e um sistema de reversão à média que combina extensões de envelopes, apoiado por múltiplos filtros inteligentes de confirmação, como o RSI, para capturar entradas de reversão de
Neuro Poseidon MT5
Daria Rezueva
4.75 (52)
Neuro Poseidon is a new indicator by Daria Rezueva. It combines precise trading signals with adaptive TP/SL levels - creating best possible trades as a result! Message me and get  Neuro Poseidon Assistant  as a gift to automize your trading process! What makes it stand out? 1. Proven profitability on all assets and timeframes 2. Only confirmed BUY and SELL signals present on the chart 3. Adaptive TP & SL levels generated by the software for each trade 4. Easy to understand - suitable for al

Auto Optimized SpeedAngle é um sistema de vetorização de momentum de nível institucional que elimina o sobreajuste ( curve-fitting ) por meio da otimização contínua de avanço ( Walk-Forward Optimization , WFO). Em vez de depender de entradas estáticas que se degradam quando os regimes de mercado mudam, o indicador recalibra dinamicamente seus parâmetros utilizando validação fora de amostra ( Out-of-Sample , OOS), garantindo que os sinais exibidos representem vantagens estatísticas genuínas e não
A lenda está de volta: Entry Points Pro 10. O relançamento do lendário indicador que se manteve por 3 anos no Top-3 do MQL5 Market. Centenas de avaliações entusiasmadas (589 nas duas versões), milhares de traders operam com ele todos os dias, 31.000+ downloads da versão demo   MT4+MT5 . Li cada avaliação de vocês ao longo de cinco anos — e, em vez de promessas, coloquei as respostas dentro da versão 10. Do autor que está no mercado desde 1999 e valoriza a honestidade, a própria reputação e os se
FiboSniper Pro
Van Minh Nguyen
5 (3)
FiboSniper Pro – Multi-Filter Fibonacci System with Auto SL/TP and Control Panel FiboSniper Pro é um indicador técnico que combina Fibonacci Envelopes dinâmicos com vários filtros de confirmação para gerar sinais seletivos de Buy e Sell. Os níveis de Fibonacci são calculados com base em Moving Average e ATR e, em seguida, filtrados por ADX, EMA, RSI, ATR, Volume, Time e estrutura das velas. O indicador exibe diretamente no gráfico os níveis automáticos de Stop Loss e Take Profit baseados em ATR,
Welcome to ENTRY IN THE ZONE AND SMC MULTI TIMEFRAME SPECIAL BENEFIT / FOR OUR MQL5 CUSTOMERS FREE ACCESS TO THE NEW TOOL  — COMING SOON — Learn more on our official website  : https://www.fableedge.net Entry In The Zone and SMC Multi Timeframe is a real-time market analysis tool based on Smart Money Concepts (SMC), designed to analyze market structure, price direction, and key trading zones. It supports both Single-Timeframe Analysis and Multi-Timeframe Analysis, providing a clearer view of the
Unix Scalper
Issam Kassas
4 (4)
Unix Scalper — MetaTrader 5 Após a compra, envie-me uma mensagem no MQL5 para receber Smart Universal Expert Advisor GRÁTIS, além do curso online, do manual em PDF e do acesso ao grupo privado. Identifique a oportunidade. Veja o plano. Escolha como operar. O UNIX Scalper reúne análise de mercado, decisões BUY/SELL/WAIT e níveis de Entry, Stop Loss, TP1 e TP2 em um painel organizado. VEJA O SINAL E O PLANO • Decisões claras: BUY, SELL ou WAIT. • Níveis definidos: Entry, Stop Loss, TP1 e TP2. •
M1 Sniper MT5
Oleg Rodin
5 (7)
O   M1 SNIPER   é um sistema indicador de negociação fácil de usar. É um indicador de seta projetado para o período M1. O indicador pode ser usado como um sistema independente para scalping no período M1 e pode ser usado como parte do seu sistema de negociação existente. Embora este sistema de negociação tenha sido projetado especificamente para negociação no M1, ele também pode ser usado em outros períodos. Originalmente, desenvolvi este método para negociar XAUUSD e BTCUSD. Mas considero-o úti
Adaptive Price Action Engine Compre um indicador, ganhe o EA de graça Análise Auto-Otimizada de Tendências e Padrões de Candlestick em Múltiplos Timeframes Os mercados estão em constante mudança, e nem todos os padrões de Price Action têm o mesmo valor em todas as condições de mercado. O Adaptive Price Action Engine foi desenvolvido para se adaptar às mudanças nas condições do mercado, combinando estrutura de tendência, análise Multi-Timeframe, padrões de candlestick e otimização estatística em
Scalper Vault   é um sistema profissional de escalpelamento que fornece tudo o que você precisa para um escalpelamento bem-sucedido. Este indicador é um sistema de negociação completo que pode ser usado por comerciantes de forex e opções binárias. O período de tempo recomendado é M5. O sistema fornece sinais de seta precisos na direção da tendência. Ele também fornece sinais superiores e inferiores e níveis de mercado Gann. Os indicadores fornecem todos os tipos de alertas, incluindo notificaçõe
FX Trend MT5 NG
Daniel Stein
5 (6)
FX Trend NG: A Nova Geração de Inteligência de Tendência Multi-Mercado Visão Geral FX Trend NG é uma ferramenta profissional de análise de tendências e monitoramento de mercado em múltiplos períodos de tempo. Permite compreender a estrutura completa do mercado em segundos. Em vez de alternar entre vários gráficos, você visualiza instantaneamente quais ativos estão em tendência, onde o momentum está enfraquecendo e onde existe alinhamento forte entre diferentes timeframes. Oferta de Lançamento
FX Power MT5 NG
Daniel Stein
5 (33)
FX Power: Analise a Força das Moedas para Decisões de Negociação Mais Inteligentes Visão Geral FX Power é a sua ferramenta essencial para compreender a força real das principais moedas e do ouro em quaisquer condições de mercado. Identificando moedas fortes para comprar e fracas para vender, FX Power simplifica as decisões de negociação e revela oportunidades de alta probabilidade. Quer você prefira seguir tendências ou antecipar reversões usando valores extremos de Delta, esta ferramenta adap
Power Candles MT5
Daniel Stein
4.58 (12)
Power Candles V3 - Indicador de força com auto-otimização O Power Candles V3 transforma a força da moeda e do instrumento num plano de negociação prático em todos os gráficos aos quais está associado. Em vez de se limitar a colorir as velas, executa uma otimização automática em tempo real em segundo plano e apresenta-lhe os melhores valores de Stop Loss, Take Profit e limiar de sinal para o símbolo em questão. Basta um clique para o adotar na negociação em tempo real — as linhas de entrada, Stop
M1 Quantum MT5
Hamed Dehgani
4.2 (10)
Sinais de Trading ao Vivo usando o M1 Quantum: Sinal   (Operação executada automaticamente pelo Quantum Trade Assistant , incluído gratuitamente neste produto.) Últimas Notícias : A versão 1.64 foi lançada. Agora, todas as operações têm um Stop Loss colocado atrás das zonas relevantes de Suporte/Resistência. A função Smart Close também foi aprimorada para aumentar o desempenho do EA nesta versão. Desde 9 de agosto, o sinal ao vivo está sendo executado na versão 1.64. Plano de Preços: Preço Atua
Atomic Analyst MT5
Issam Kassas
4.47 (60)
Atomic Analyst — MetaTrader 5 Após a compra, envie-me uma mensagem no MQL5 para receber Smart Universal Expert Advisor GRÁTIS, além do curso online, do manual em PDF e do acesso ao grupo privado. O Atomic Analyst reúne a ação do preço, a direção da tendência, sinais de entrada e saída, Stop Loss e vários níveis de Take Profit diretamente no seu gráfico. VEJA O SINAL. ENTENDA O CENÁRIO. O Atomic Analyst organiza sua análise em informações visuais claras: • Setas de compra e venda para identificar
Crystal Heikin Ashi Signals
Muhammad Jawad Shabir
5 (4)
Crystal Heikin Ashi Signals—Professional Trend & Signal Detection Indicator Advanced Heikin Ashi Visualization with Intelligent Signal System for Manual & Automated Trading Final Price: $149 ---------> Price goes up $10 after every 10 sales . Limited slots available — act fast . Overview User Guide PDF Crystal Heikin Ashi Signals is a professional-grade MetaTrader 5 indicator that combines pure Heikin Ashi candle visualization with an advanced momentum-shift detection system. Designed for both m
Divergence Bomber
Ihor Otkydach
4.89 (94)
Cada comprador deste indicador recebe adicionalmente, e de forma gratuita: A ferramenta exclusiva "Bomber Utility", que acompanha automaticamente cada operação, define os níveis de Stop Loss e Take Profit e fecha operações de acordo com as regras da estratégia; Arquivos de configuração (set files) para ajustar o indicador em diferentes ativos; Set files para configurar o Bomber Utility nos modos: "Risco Mínimo", "Risco Balanceado" e "Estratégia de Espera"; Um vídeo tutorial passo a passo que a
Quant Direction MT5
Georgios Kalomoiropoulos
Quant Direction é uma ferramenta de análise de mercado tridimensional. Ela oferece uma análise de mercado totalmente objetiva, baseada em algoritmos, que calcula simultaneamente desvios percentuais precisos em diversos parâmetros. Desenvolvido com ferramentas avançadas de modelagem com inteligência artificial e rigorosamente testado, o algoritmo foi projetado para interpretar o mercado com precisão sem precedentes. Você pode analisar qualquer par de moedas ou instrumento financeiro em sua plataf
Btmm state engine pro
Garry James Goodchild
5 (4)
BTMM State Engine Pro by G-Labs — Beat The Market Maker indicator for MetaTrader 5. Asian session range, London and New York kill zones, level progression (L1/L2/L3), peak formation detection (PFH/PFL), entry signals, and a multi-pair scanner from one chart. Stop scanning charts one pair at a time. The State Engine tracks the BTMM daily cycle automatically — Asian box, room boundaries, level blocks, peak formations, and filtered entries — while the scanner dashboard shows level, peak status, d
SkyHammer Signal Pro Indicador profissional de sinais de tendência sem repaint, com níveis Entry, SL e TP bloqueados SkyHammer Signal Pro é um indicador estruturado de tendência e momentum, desenvolvido para traders que procuram sinais claros, fixos e verificáveis. Funciona melhor em timeframes baixos, como M1 e M5 . O indicador não tenta prever topos ou fundos do mercado. Em vez disso, ele aguarda estrutura de mercado confirmada, direção de tendência, força de momentum, volatilidade saudável e
Precision Spike Detector
Francisco Mandomo Simbine
5 (2)
Precision Spike Detector V3 – Institutional-Grade AI Trading System Attention: The price increases by US$50 for every 10 purchases.  Final price: US$599 Precision Spike Detector V3   is a   state-of-the-art, institutional-grade market analysis system   for   MetaTrader 5 , designed to detect   high-probability market movements   in synthetic indices such as   Boom, Crash, GainX, and PainX . After purchase, send me a private message to receive the optimized configuration files,  the installation
O UZFX {SSS} Scalping Smart Signals v5.0 MT5 é um indicador de negociação de alto desempenho, sem repintura, concebido para scalpers, day traders e swing traders que exigem sinais precisos e em tempo real em mercados em rápida evolução. Desenvolvido pela (UZFX-LABS), este indicador combina a análise da ação do preço, a confirmação de tendências e a filtragem inteligente para gerar sinais de compra e venda de alta probabilidade, sinais de alerta e oportunidades de continuação de tendências em tod
Spike Fakeout Detector
Brighton Mufaro Mudzingwa
PainX 400 FAKEOUT DETECTOR MT5 Custom Indicator  ·  Sell-Side Bias  ·  Scalping  ·  RSI(6) Filtered   OVERVIEW   The Spike Fakeout Detector is a non repaint precision technical indicator built exclusively for Crash / PainX synthetic indices on the platform. It is engineered around one of the most consistent and exploitable patterns on this instrument — the false breakout above resistance followed by a sharp price drop. Crash/PainX is a growing index that produces a significant price drop app
Currency Strength Wizard   é um indicador muito poderoso que fornece uma solução completa para uma negociação bem-sucedida. O indicador calcula o poder deste ou daquele par forex usando os dados de todas as moedas em vários intervalos de tempo. Esses dados são representados em uma forma de índice de moeda fácil de usar e linhas de energia de moeda que você pode usar para ver o poder desta ou daquela moeda. Tudo o que você precisa é anexar o indicador ao gráfico que deseja negociar e o indicador
Mais do autor
Trend and Consolidation Matrix is an MT5 market structure and price action indicator combining a 6-layer adaptive trend ribbon, spatial consolidation zone mapping, and dynamic breakout-retest alerts for Forex, Gold (XAUUSD), and Indices. Engineered for scalping, day trading, and swing trading, this tool unifies multi-layer trend direction, volatility structure, and price density geometry calculated strictly on completed bars with zero historical repainting. Core Market Structure Architecture The
FREE
SWING DETECTOR WITH RSI AND FIBONACCI Structural Swing Points + Fibonacci Retracement + RSI Overlay -------------------------------------------------- FREE INDICATOR Identify swings. See Fibonacci levels. Check RSI. All in one free indicator. -------------------------------------------------- WHAT THIS INDICATOR DOES This indicator automatically detects structural swing highs and lows using configurable depth and deviation filtering. It connects swings with trend lines, overlays standard
FREE
SWING VOLUME PROFILE Swing-Based Volume Profile + Fibonacci + RSI -------------------------------------------------- Auto-detected swings. Volume profile. Fibonacci. RSI. All-in-one. -------------------------------------------------- WHAT THIS INDICATOR DOES Swing Volume Profile (SVP) automatically detects structural swings and displays a volume profile for the most recent completed swing — with Fibonacci retracement and RSI overlay. No manual range selection needed. The indicator finds
SWING DETECTOR WITH RSI AND FIBONACCI Structural Swing Points + Fibonacci Retracement + RSI Overlay -------------------------------------------------- FREE INDICATOR Identify swings. See Fibonacci levels. Check RSI. All in one free indicator. -------------------------------------------------- WHAT THIS INDICATOR DOES This indicator automatically detects structural swing highs and lows using configurable depth and deviation filtering. It connects swings with trend lines, overlays standard
FREE
Fixed Range Volume Profile is an MT5 volume analysis tool that calculates and displays volume distribution across any custom price and time range using standard chart trendlines for Forex, Gold (XAUUSD), Indices, and Crypto. Designed for day trading, scalping, and swing trading, this indicator automatically maps the Point of Control (POC), Value Area boundaries (VAH/VAL), and high-volume support and resistance levels without requiring manual object naming or complex setup. Core Volume Profile Ar
SWING HIGHS LOWS DETECTOR Swing Detection with Divergence Analysis -------------------------------------------------- Identify swings. Spot divergences. Trade with confluence. -------------------------------------------------- WHAT THIS INDICATOR DOES This indicator automatically detects structural swing highs and lows using configurable depth and deviation filtering. It then analyzes RSI and MACD to detect regular and hidden divergences between consecutive swings of the same type. Diver
FREE
SWING HIGHS LOWS DETECTOR Swing Detection with Divergence Analysis -------------------------------------------------- Identify swings. Spot divergences. Trade with confluence. -------------------------------------------------- WHAT THIS INDICATOR DOES This indicator automatically detects structural swing highs and lows using configurable depth and deviation filtering. It then analyzes RSI and MACD to detect regular and hidden divergences between consecutive swings of the same type. Diver
FREE
VWAP Ribbons
Charles Mwangi Ndungu
VWAP Ribbon Intelligence is an MT5 technical analysis indicator combining Volume-Weighted Average Price (VWAP), dynamic Wilder ATR volatility ribbons, and on-chart RSI momentum telemetry for Forex, Gold (XAUUSD), Indices, and Crypto. Engineered for day trading, scalping, and swing trading, this tool projects volatility expansion and momentum values directly onto the main price chart without requiring secondary subwindow oscillators. Core Analytical Architecture The indicator features a dual-mode
FREE
VWAP Ribbon Intelligence is an MT4 technical analysis indicator combining Volume-Weighted Average Price (VWAP), dynamic Wilder ATR volatility ribbons, and on-chart RSI momentum telemetry for Forex, Gold (XAUUSD), Indices, and Crypto. Engineered for day trading, scalping, and swing trading, this tool projects volatility expansion and momentum values directly onto the main price chart without requiring secondary subwindow oscillators. Core Analytical Architecture The indicator features a dual-mode
FREE
Fixed Range Volume Profile MT4 Volume Profile Indicator — Auto-Detecting Trendline Tracking, POC, Value Area & High Volume Nodes in Real Time Fixed Range Volume Profile (FRVP) displays volume distribution over a user-defined range — automatically detecting the latest trendline you draw or drag on the chart. No manual range selection. No naming conflicts. Just draw a trendline and the profile appears. Update it live by dragging. MT4 Native • No Repainting • Real-Time Trendline Tracking • Fully Cu
Adaptive Swing Density Heat Map MT4 Structural Density Indicator — Swing Clustering, Participation Tracking, Acceptance vs Rejection & Color-Coded Heat Map Adaptive Swing Density Heat Map analyzes swing point density across price levels, then tracks how price actually interacts with each zone — measuring participation, acceptance, and rejection. The result is a heat map of structural zones, color-coded by density strength. Not all support and resistance levels are equal — this indicator quantif
CONSOLIDATION INTELLIGENCE PRO MT4 Consolidation Indicator | Automatic Range Detection + 5-Tier Price-Density Heatmaps + Re-Entry Alerts Consolidation Intelligence Pro is a MetaTrader 4 indicator designed to identify areas where price repeatedly overlaps and trades within a concentrated range. The indicator analyzes candle overlap, body-to-wick structure, zone strength, and price-density distribution, then displays detected consolidation areas as 5-tier heatmaps directly on the chart. It also su
DONCHIAN MARKET & TREND INTELLIGENCE ENGINE (MT4) Multi-Factor Volatility, Trend Structure & Institutional Breakout Validation Dashboard MOST BREAKOUT INDICATORS ARE TRAPPING YOU. They Tell You THAT Price Broke Out. They Never Tell You IF It Will Hold. You have lived this scenario dozens of times: Price spends days coiling inside a tight Donchian band on your MT4 chart. A massive candle punches above the 20-period high. You buy the breakout — expecting momentum. Three candles later, price colla
BOLLINGER MARKET & TREND INTELLIGENCE MT4 Bollinger Breakout Analysis • Volatility Regimes • Trend Structure • Breakout Validation • Post-Breakout Analysis STOP GUESSING WHICH BREAKOUTS ARE REAL. You've been here before. Price closes outside the upper Bollinger Band. You see the breakout. You hesitate for a second — then enter. Three candles later, price is back inside the band. The breakout failed. Now you're wondering whether you entered too early, whether you should have waited for a retest,
VWAP Sniper Reversal
Charles Mwangi Ndungu
VWAP Sniper Reversal Pro v3.00 MT4 Mean-Reversion Indicator — Rolling VWAP, Dual-Layer ATR Bands, Volume Exhaustion, RSI Gate & Confirmation Modes VWAP Sniper Reversal Pro identifies potential mean-reversion setups at statistical price extremes. It combines a rolling volume-weighted average price (VWAP) baseline, dual-layer ATR deviation bands, volume and wick exhaustion filters, and an RSI gate to confirm reversal signals on completed bars. Built for traders who want multi-factor confluence ra
Swing Volume Profile MT5 Swing Volume Profile Indicator — Auto Swing Detection, Volume Profile, Fibonacci Retracement & RSI Overlay in One Chart Tool Swing Volume Profile (SVP) automatically detects structural swings and displays a volume profile for the most recent completed swing — with Fibonacci retracement and RSI overlay. No manual range selection. No trendline required. The indicator finds the swings and builds the profile automatically. MT5 Native • No Repainting • Auto Swing Detection •
Consolidation Intelligence Pro MT5 Consolidation Indicator — Automatic Range Detection, 5-Tier Price-Density Heatmaps & Re-Entry Alerts Consolidation Intelligence Pro automatically identifies where price repeatedly overlaps and trades within a concentrated range — then renders that structure as a 5-tier price-density heatmap directly on your chart. No more manually drawing every consolidation box. The indicator analyzes historical price structure, measures candle overlap and body-to-wick charac
DONCHIAN MARKET & TREND INTELLIGENCE The Only Donchian Tool That Tells You WHY the Market Is Moving — Not Just Where Most Donchian indicators draw three lines and call it a day. You get an upper band. A middle band. A lower band. And when price pokes above the upper band, you're supposed to just... buy? That's not analysis. That's guessing with extra steps. THE PROBLEM EVERY DONCHIAN TRADER KNOWS You've seen it a hundred times. Price finally breaks above the 20-period high after days of compress
BOLLINGER MARKET & TREND INTELLIGENCE — MT5 STOP GUESSING WHAT A BOLLINGER BREAKOUT IS TELLING YOU You've been here before. It's 2 AM. You're staring at a chart. Price has just closed outside the upper Bollinger Band. You enter. Three candles later, price is back inside the band. Then the move reverses. You tell yourself: "I should have waited for a retest." But when you wait for the retest, sometimes price continues without giving you the entry you wanted. So you add another filter. RSI. Then M
VWAP Sniper Reversal Pro is an MT5 reversal and pullback indicator combining Volume-Weighted Average Price (VWAP), dual-layer ATR volatility bands, volume exhaustion spikes, and RSI momentum filters for Forex, Gold (XAUUSD), Indices, and Crypto. Designed for scalping, day trading, and swing trading, this tool identifies market turning points when price becomes overstretched from fair value, calculating all confirmed signals strictly on completed bars with zero historical repainting. Core 4-Facto
Super Trend and Consolidation Matrix is an MT5 market structure and price action indicator combining a 6-layer trend ribbon, volatility squeeze engine, dynamic consolidation zones, and a real-time confluence dashboard for Forex, Gold (XAUUSD), and Indices. Engineered for scalping, day trading, and swing trading, this system provides objective structural analysis calculated strictly on completed bars with zero historical repainting. Core Market Structure Engine The indicator synchronizes multiple
Filtro:
Sem comentários
Responder ao comentário