Adaptive Swing Density Heat Map

Adaptive Swing Density Heat Map
MT5 Structural Density Indicator — Swing Clustering, Participation Tracking, Acceptance vs Rejection & Color-Coded Heat Map

Adaptive Swing Density Heat Map analyzes swing point density across price levels, then tracks how price actually interacts with each zone — measuring participation, acceptance, and rejection.

The result is a heat map of structural zones, color-coded by density strength. Not all support and resistance levels are equal — this indicator quantifies the difference.

MT5 Native • No Repainting • Adaptive to Volatility • Fully Customizable

The Idea in One Line

See where price clusters. See where price fights.

What the Indicator Does

Adaptive Swing Density Heat Map answers one core question:

Where have swings repeatedly clustered — and is price accepting or rejecting those levels right now?

The indicator detects swing points using a fractal algorithm, clusters them by ATR-based price proximity, and assigns each cluster a density score from 0 to 100%. It then tracks how price interacts with each zone over a configurable behavior window — separating genuine structural levels from weak ones.

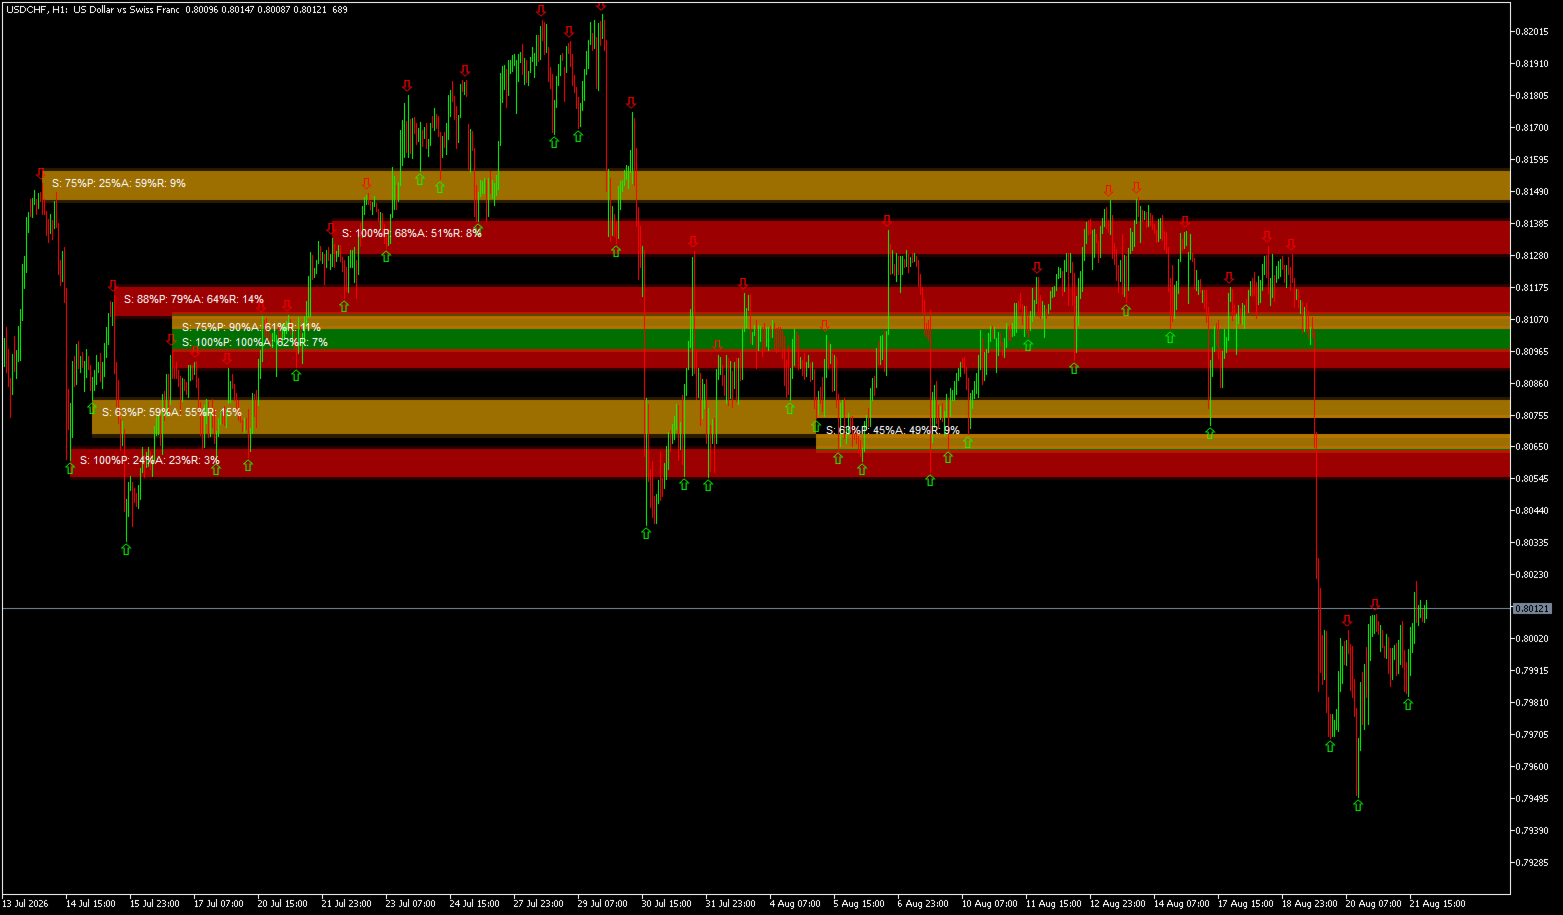
Zones are color-coded by density strength:

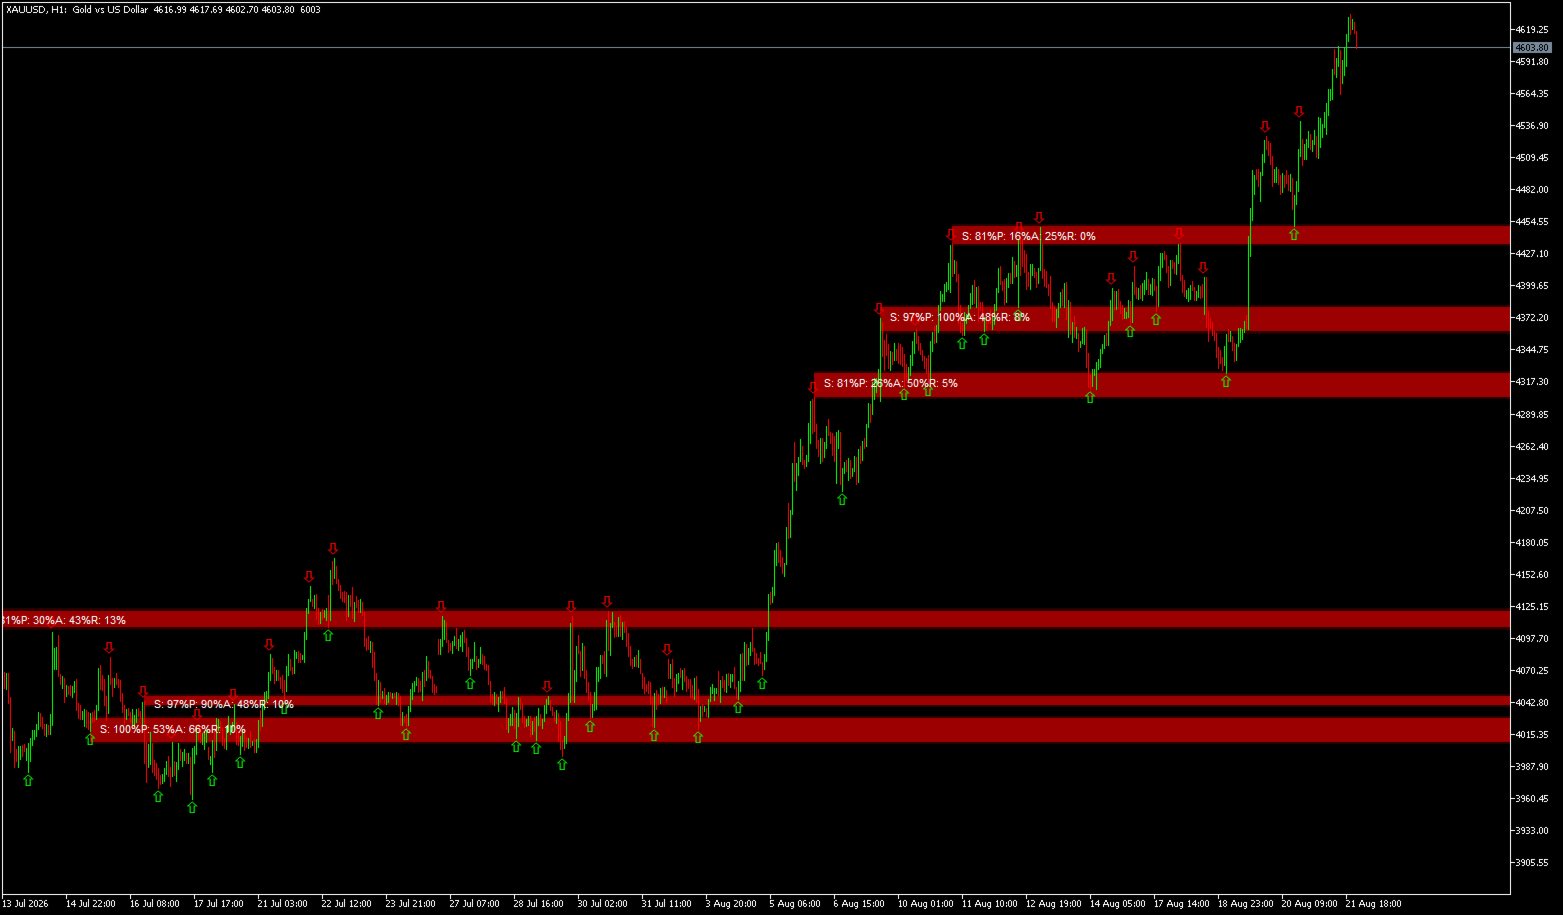
  • Red zones = Highest density (80–100%) — levels where price has repeatedly turned

  • Orange zones = High density (60–80%) — significant structural levels with active interest

  • Yellow zones = Moderate density (40–60%) — areas of some interest but less conviction

  • Blue zones = Low density (below 40%) — weak structural levels, best ignored

A level where many swings have clustered indicates genuine market attention. A level with only one or two touches is statistically less significant. This indicator quantifies that difference.

Core Logic and Calculation

The indicator begins by detecting swing points using a fractal algorithm. Each swing point represents a structural high or low where price reversed direction — these points are the foundation of all subsequent analysis.

Swings are then clustered by price proximity using an ATR-based radius. This radius adapts to market volatility, ensuring clusters are meaningful in both quiet and volatile conditions. Clusters that are too wide are rejected, as they represent broad ranges rather than specific levels.

Density is normalized by comparing each cluster to the top clusters in the current analysis window. This creates a 0 to 100 percent scale that remains consistent across different market conditions. A zone with 80 percent density has significantly more swing clustering than the reference zone, indicating strong structural importance.

Participation analysis measures how often price candles touch each zone. This is distinct from density — a zone may have many swings (high density) but rarely be visited (low participation). Such zones are less actionable.

Acceptance and rejection analysis distinguishes support from resistance. When price closes inside a zone, it indicates acceptance and suggests the zone is acting as support. When price leaves long wicks without closing inside, it indicates rejection and suggests the zone is acting as resistance.

A smoothing mechanism stabilizes the density reference across bars, preventing zone colors from flickering due to normal variations in which zones qualify as the strongest. This makes the indicator visually reliable and easier to interpret.

Key Strengths

Swing Density Analysis
Clusters swing points by price proximity using an ATR-based radius that adapts to volatility. The more swings at a level, the higher the density score — directly indicating structural significance.

Participation Tracking
Measures how often candles touch each zone as a percentage. A zone with high density but low participation is less actionable than one with high participation.

Acceptance vs Rejection
Tracks closes inside the zone as acceptance and wick rejections as rejection. This distinguishes support levels from resistance levels based on actual price behavior.

Adaptive Smoothing
Density reference is smoothed across bars to prevent color flickering, making the visual output stable and reliable.

Color-Coded Heat Map
Uses a Red to Blue intensity scale for instant visual interpretation of zone strength.

Fully Customizable
Swing strength, lookback, clustering radius, zone filtering, and behavior lookback are all adjustable.

Anchor Zones to Formation
Zones remain fixed to their structural formation period, preserving the context of their origin.

No Repainting
All calculations are based on historical data and do not change on the current bar, ensuring consistency for backtesting.

What You See on the Chart

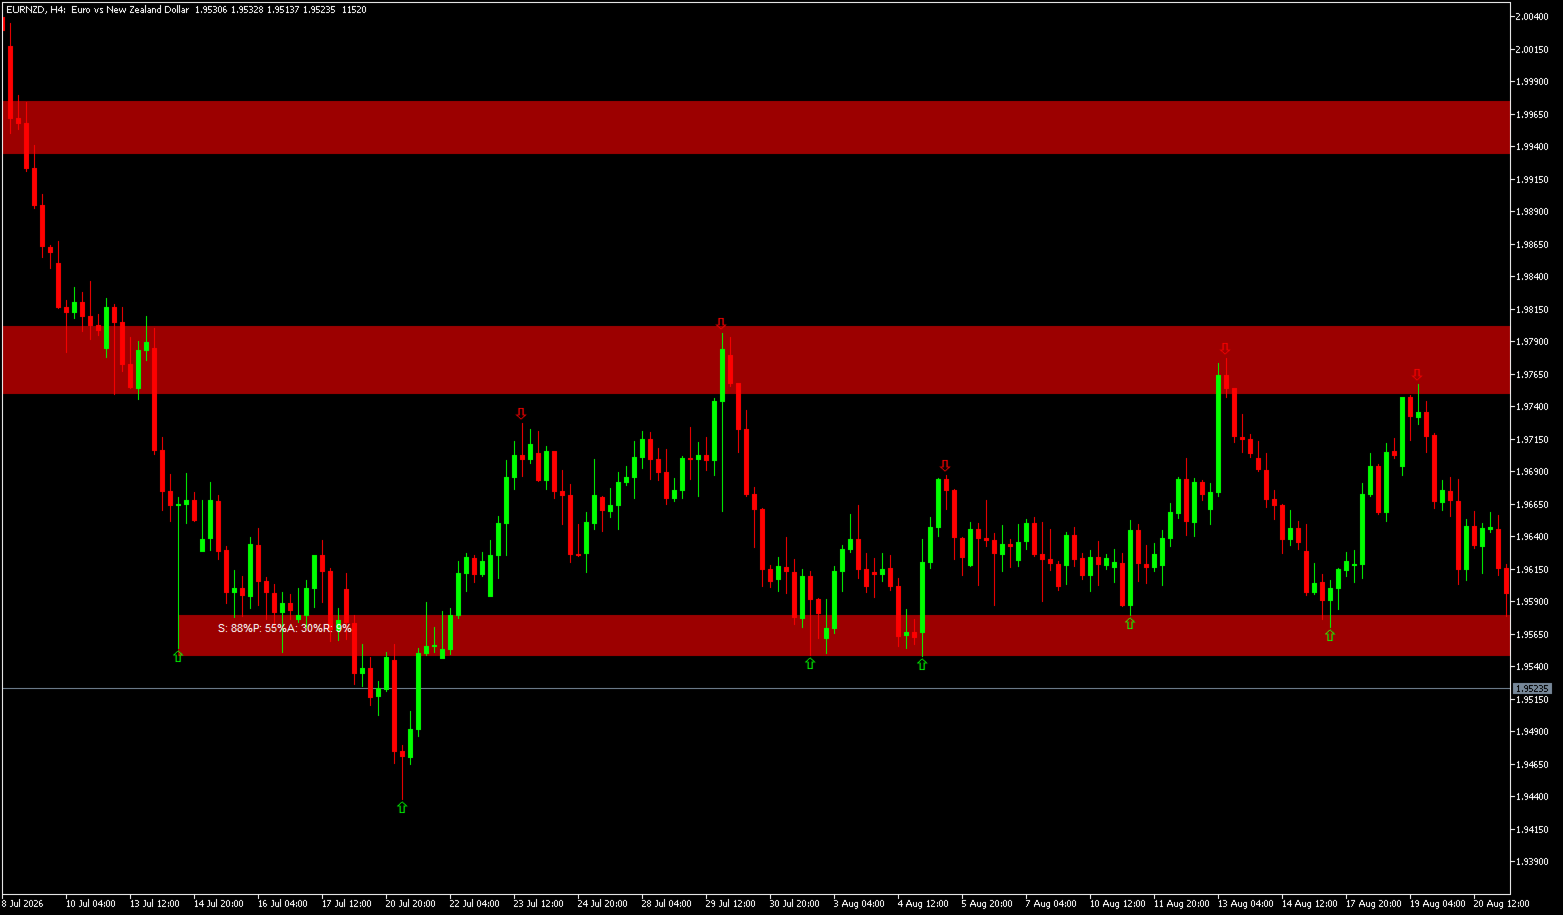
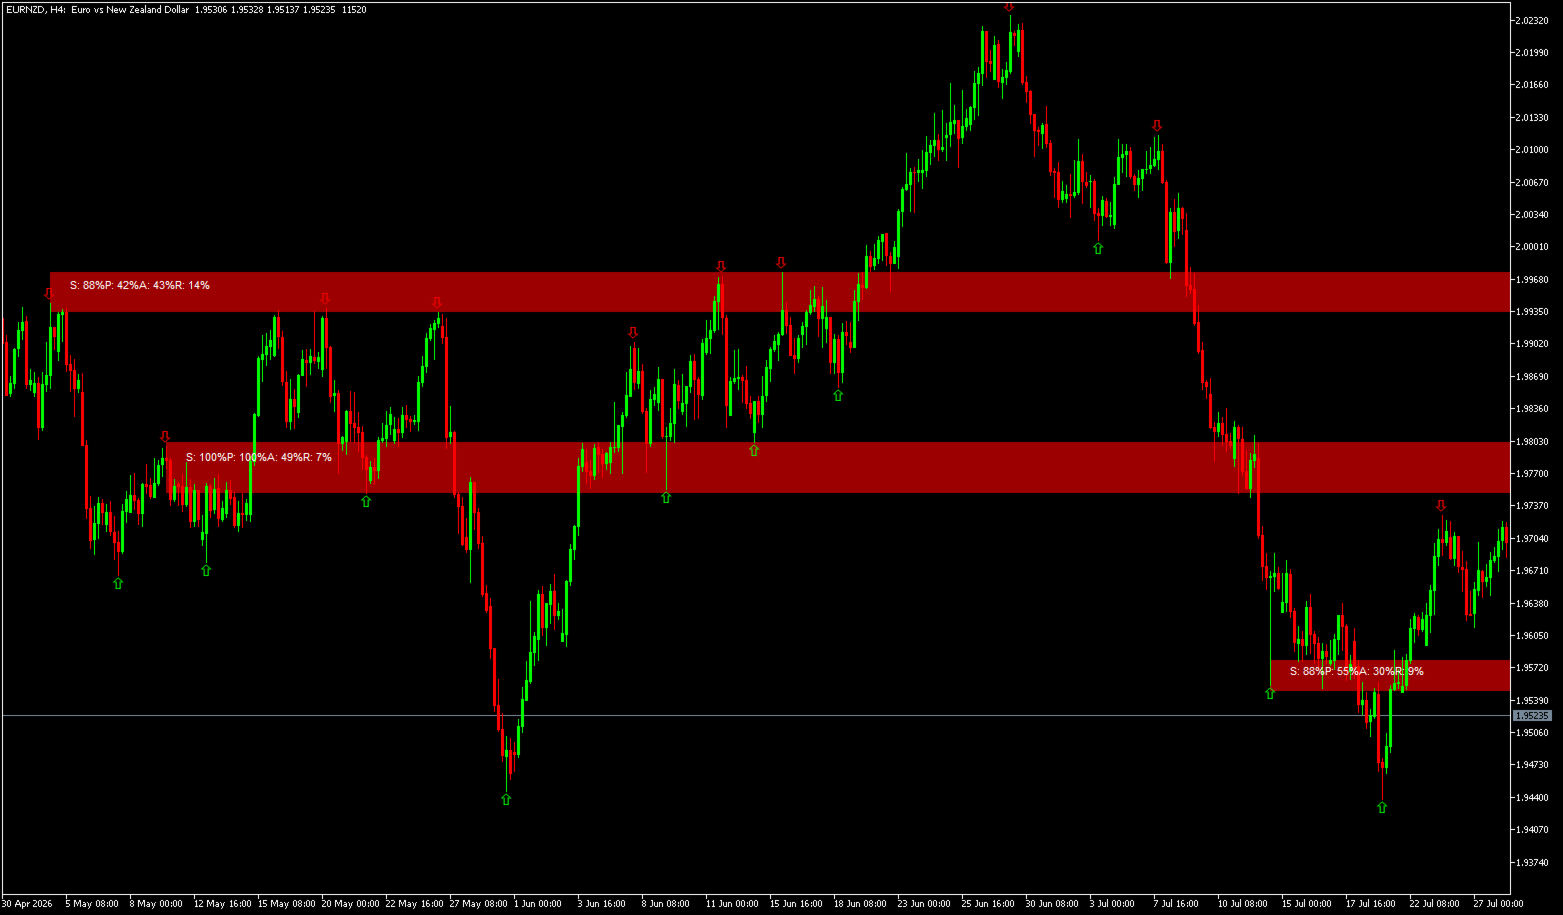
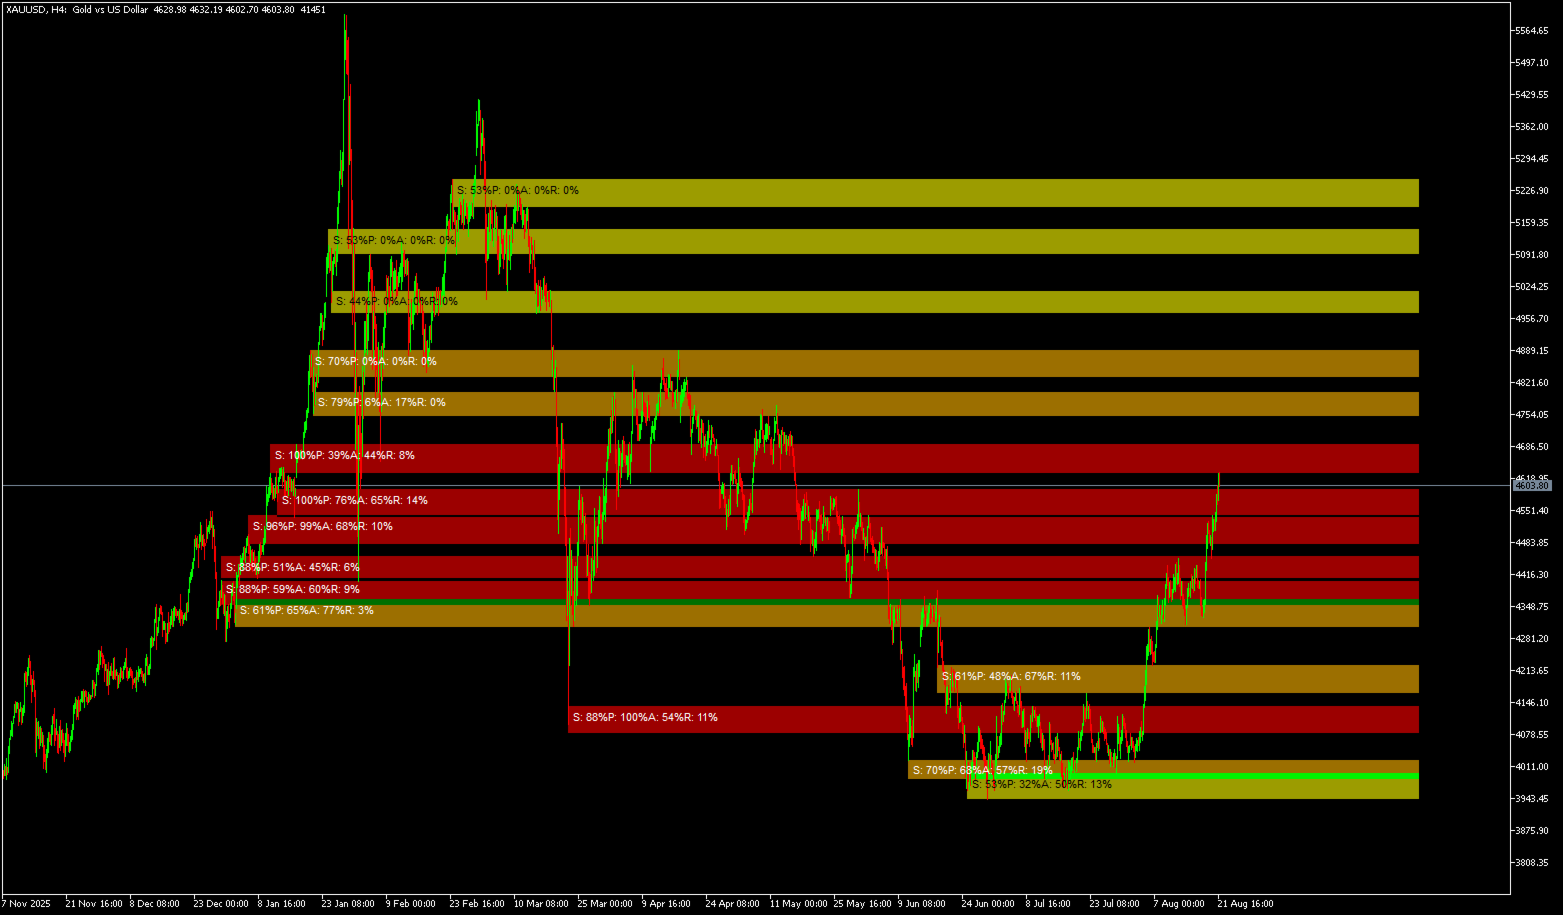
  • Red zones represent the highest density levels, indicating the strongest structural interest

  • Orange zones represent high density levels with significant swing clustering

  • Yellow zones represent moderate density levels with some market attention

  • Blue zones represent low density levels where structural interest is minimal

  • Semi-transparent halo extends above and below each zone for rejection detection

  • Data labels show Density percent, Participation percent, Acceptance percent, and Rejection percent

  • Swing high and low arrows can be toggled on or off

  • Zones auto-clean and redraw automatically on each new bar

How It Works

  1. Detects swing points using configurable strength and lookback limits.

  2. Clusters swings by price proximity using an ATR-based radius that adapts to volatility.

  3. Filters clusters by compactness — rejecting zones that are too wide.

  4. Assigns density scores normalized from 0 to 100 percent.

  5. Analyzes price behavior around each zone to measure participation, acceptance, and rejection.

  6. Draws a color-coded heat map with data labels and halo extensions.

Detailed Parameter Guide

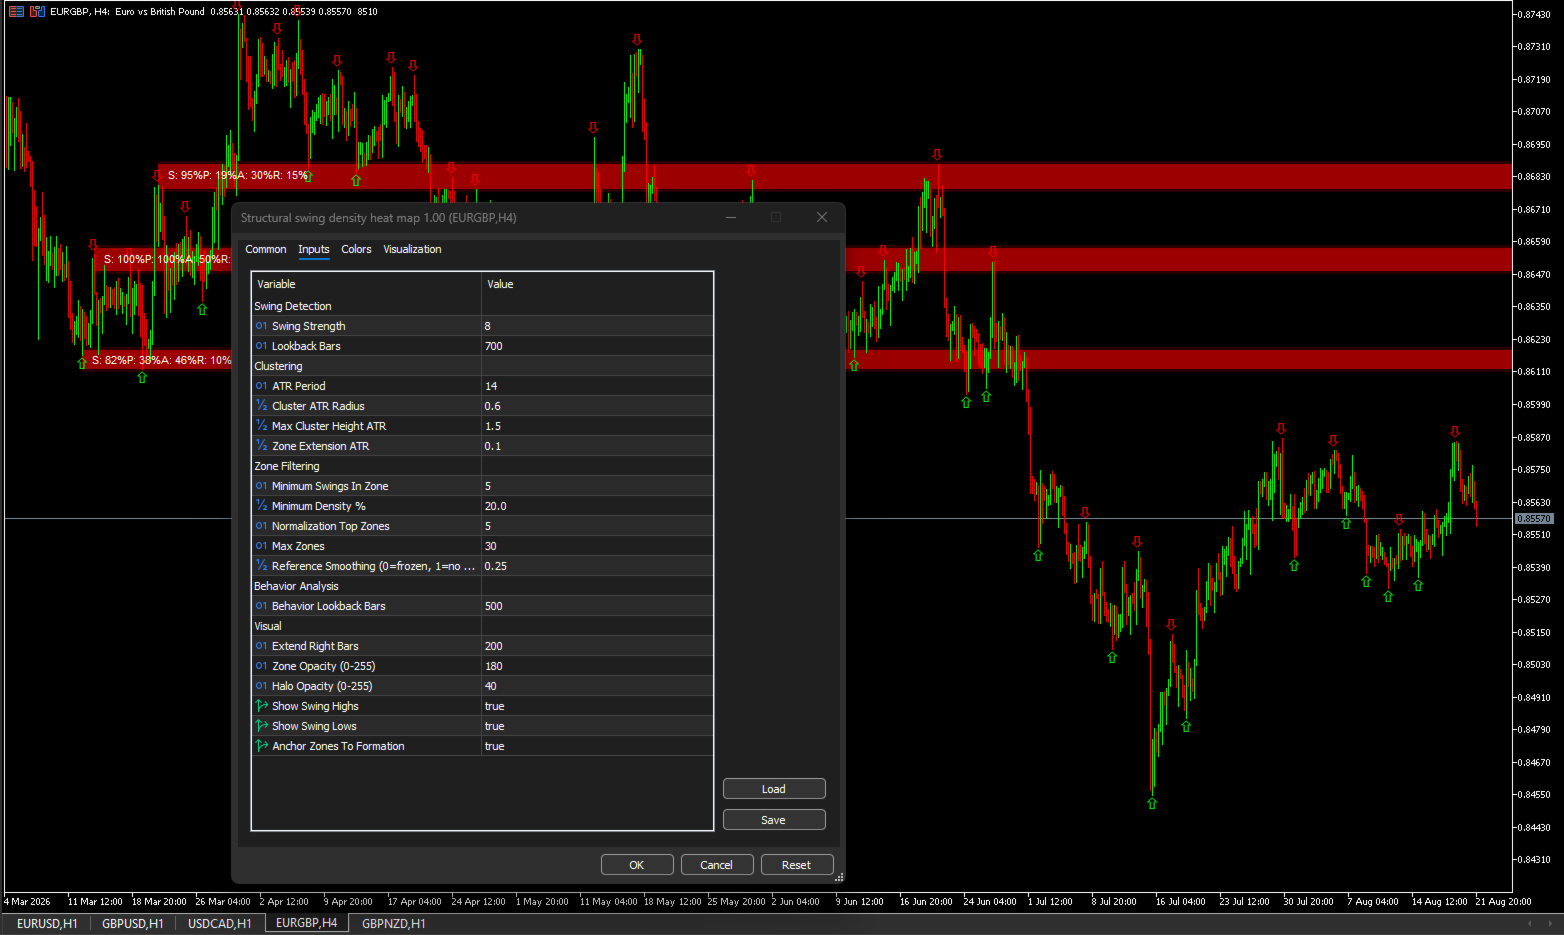
Swing Detection Parameters

Swing Strength
Controls how many bars are checked on each side of a bar to determine if it is a swing high or low. Higher values produce fewer, more significant swings by requiring more bars to confirm a turn. Lower values produce more swings, including smaller structural moves.
Default: 12 — works well on H1 charts. For M5, consider 8 to capture more movement. For H4, consider 16 to filter out minor noise. The key is finding the balance where swings represent meaningful turns rather than noise.

Lookback Bars
Limits how far back the indicator searches for swings.
Default: 1000 bars. This is a performance optimization that prevents the indicator from scanning the entire chart history. On longer timeframes like D1 or W1, you may need to increase this value. On shorter timeframes like M1 or M5, you can decrease it. The indicator will still draw zones from the lookback period; older history is ignored.

Clustering Parameters

ATR Period
Determines the period used for ATR calculation, which affects the adaptive radius for clustering.
Default: 14 — standard for volatility measurement. In volatile markets, consider a shorter period for more responsive clustering. In quiet markets, consider a longer period for more stable clustering.

Cluster ATR Radius
Determines how close swing points must be to cluster together. The value is multiplied by the current ATR. Higher values create wider clusters, capturing more swings at the cost of precision. Lower values create tighter clusters with fewer swings but greater accuracy.
Default: 1.0 × ATR. In volatile markets, consider lowering this to keep clusters tight. In quiet markets, consider raising it to capture enough swings for meaningful clusters.

Max Cluster Height ATR
Rejects clusters that are too wide. A cluster with a wide price range indicates the swings are not actually clustered at a specific level.
Default: 1.5 × ATR. Any cluster wider than this is rejected as too diffuse. This ensures zones represent genuine structural levels rather than broad ranges.

Zone Extension ATR
Controls the halo size around each zone, used for rejection detection. When price touches the halo but fails to close inside the zone, it is counted as a rejection.
Default: 0.0 (no extension). Setting this to 0.5 × ATR captures rejections that occur just outside the zone, which is valuable for identifying resistance levels.

Zone Filtering Parameters

Minimum Swings In Zone
Sets the minimum number of swings required to form a zone.
Default: 4. Zones with fewer swings are rejected as too sparse. This prevents drawing zones on isolated swings that do not represent repeated market interest.

Minimum Density Percent
Filters out weak zones. Only zones with density above this threshold are displayed.
Default: 20 percent. Increasing this value to 40 percent will show only the strongest zones, reducing chart clutter. Decreasing it to 10 percent will show more zones but include weaker ones.

Normalization Top Zones
Determines how density is normalized. The indicator takes the top N zones by swing count and averages their swing counts to create a reference.
Default: 5. This reference is used to calculate density percentages for all zones. A zone with 10 swings when the top 5 zones average 5 swings would have 200 percent density, capped at 100.

Reference Smoothing
Smooths the density reference across bars to prevent color flickering.
Default: 0.25. A value of 0 freezes the reference, preventing color changes entirely. A value of 1 uses the raw reference from each bar, allowing colors to change more freely. The default provides a good balance between stability and responsiveness.

Behavior Analysis Parameters

Behavior Lookback Bars
Controls how many bars are analyzed for participation, acceptance, and rejection.
Default: 500. Longer lookbacks provide more statistically significant behavior analysis but may include outdated price action. Shorter lookbacks focus on recent behavior but may lack sufficient data. For swing trading on H4 and above, consider 500 to 1000. For day trading on H1 and below, consider 200 to 500.

Visual Parameters

Extend Right Bars
Projects zones forward by a specified number of bars.
Default: 200. Useful for anticipating potential support and resistance levels ahead of price. Reducing this value keeps zones closer to current price.

Zone Opacity
Controls the transparency of the zone core. Range is 0 to 255, with higher values being more opaque.
Default: 180. Lower values create more transparent zones that allow price action to be seen underneath.

Halo Opacity
Controls the transparency of the halo extension.
Default: 40 — creates a subtle visual that does not obscure price action. Higher values make the halo more visible.

Show Swing Highs and Lows
Toggles the display of swing point arrows on the chart.
Default: true for both. Disabling these reduces chart clutter while preserving the zone display.

Anchor Zones To Formation
When enabled, zones remain fixed to their structural formation period rather than extending to the current bar.
Default: true — preserves the context of each zone's origin.

Practical Usage Guide

The primary use of this indicator is to identify genuine structural levels for entries, exits, and stop placement. Red zones are your strongest levels. They represent price levels where swings have repeatedly clustered, indicating institutional interest. These zones are the most reliable for support and resistance decisions.

To interpret a zone, examine the four metrics displayed in the label:

  • Density tells you how strong the zone is relative to others.

  • Participation tells you whether price actually visits the zone.

  • Acceptance tells you if price closes inside — meaning the zone acts as support.

  • Rejection tells you if price leaves long wicks — meaning the zone acts as resistance.

A high density zone with high acceptance (above 50%) is a strong support level. Price tends to hold above this zone, making it suitable for buy entries and stop placement below.

A high density zone with high rejection (above 50%) is a strong resistance level. Price tends to reverse at this zone, making it suitable for sell entries and stop placement above.

A zone with high density but low participation (below 20%) may be less reliable. The market has shown interest through swing clustering but has not recently interacted with the level. Consider waiting for a touch and reaction before trading.

A zone with low density but high participation may be a temporary area of interest rather than a structural level.

For the most reliable trades, combine high density with high participation. These are zones where price has historically fought. When price returns to a high density zone, watch for acceptance or rejection to confirm the direction. Entry can be made on rejection candles or close confirmations.

Practical Example

On a EURUSD H1 chart, you observe a red zone (density 85%) between 1.0850 and 1.0875. The label shows S:85, P:65, A:40, R:35. This indicates strong swing clustering, active participation, moderate acceptance, and moderate rejection. The zone has not shown a clear direction yet.

Price approaches the zone from above, touching the halo and leaving a long lower wick. The rejection count increases to 45%. This suggests the zone is acting as resistance. You consider a sell entry with a stop above the zone.

Alternatively, price approaches the zone from below and closes inside. The acceptance count increases to 50%. This suggests the zone is acting as support. You consider a buy entry with a stop below the zone.

Recommended Workflow

  1. Attach the indicator to your chart with default settings.

  2. Identify the highest density zones, shown in red and orange.

  3. Check participation, acceptance, and rejection metrics for each zone.

  4. Use acceptance zones as support and rejection zones as resistance.

  5. Confirm with price action, such as candlestick patterns, before entering trades.

Practical Use Cases

  • Identify high-density structural zones where the strongest levels are located

  • Distinguish acceptance zones that act as support from rejection zones that act as resistance

  • Avoid low-density, low-participation areas that are unlikely to hold

  • Find structural clusters for entry and exit placement with higher probability

  • Use as confluence with trend indicators or order flow analysis

Technical Notes

  • Overlay indicator that draws directly on the price chart

  • Works on any timeframe from M1 to MN1

  • Works on any symbol including forex, commodities, indices, and crypto

  • Adaptive to volatility via ATR-based radius calculations

  • No repainting — all calculations are historical and do not change on the current bar

  • Optimized for performance with once-per-bar recalculation and configurable lookback limits

  • Compatible with MetaTrader 5

Support

Lifetime updates included. For assistance, click Developer's Profile below.

Adaptive Swing Density Heat Map — MT5 Structural Density Indicator | Swing Density Heat Map | Swing Clustering Indicator | Participation Tracking | Acceptance Rejection Analysis | Support Resistance Heat Map | ATR Adaptive Zones | Structural Levels MT5 | High Density Zones | No Repaint Heat Map | Market Structure Indicator | Swing Point Analysis | Price Cluster Indicator | MT5 Heat Map Indicator | Order Flow Alternative | Institutional Levels Indicator
Рекомендуем также
Adaptive Math Zones Indicator is a professional MT5 indicator designed to identify high-probability price reaction areas using mathematical price projections and Fibonacci-based channel structures. The indicator automatically builds a reference price channel, highlights neutral zones, and projects future price levels (50%, 100%, and 200%), helping traders visually understand market structure and potential reaction points. This tool is especially effective during ranging and corrective market con
This easy to setup indicator shows you the market volumes in a different way, with support and resistance as showed. You can setup: - Backdays volume to show - Heiken Ashi candle view It works for every kind of graph and every kind of period. The program shows the volumes based on the number of candles displayed in the chart: the more candles the more volumes. Enjoy this very useful indicator. Please feel free to message me to report any kind of improvements! :D
Develop this indicator for periods of 30 minutes or more, focus on getting market trends right and making sure they are met. MFOP v8.1 gets straight to the point: it scans the market and tells you exactly when there is enough strength to enter a trade. This indicator doesn't do magic, it uses mathematical algorithms to filter out market noise, not enter into false breakouts and show you clear BUY (blue arrow) and SELL (red arrow) opportunities. It is designed and optimized specifically to take
ICT Institutional Zones Pro — Trade with Institutional Precision Stop wasting time manually drawing key ICT levels every day. ICT Institutional Zones Pro is a professional-grade MT5 indicator built for traders who use ICT (Inner Circle Trader) and Smart Money Concepts (SMC) to read market structure with precision. This indicator automatically maps the most important institutional levels directly on your chart, helping you instantly identify where smart money is likely accumulating, distributing
Strength Candles
Luis Paulo Rodrigues Pastor
Индикатор в формате гистограммы, который рассчитывается на основе данных о финансовом объеме, тиковом объеме и теле бара. Можно визуализировать моменты, когда произошел большой вход в объем, как финансовый, так и в тиках, и что рынку удалось прогрессировать и двигаться в одном направлении (вверх или вниз) благодаря размеру тела бара, где действительно была победа одной стороны переговоров (покупателей и продавцов). По умолчанию все столбцы гистограммы индикатора окрашены в синий цвет, но в его п
AURUM MID-QUANT PRO v5.60 Quantitative Excellence for Gold (XAU/USD) & Volatility Trading Gain a professional edge over institutional markets with AURUM MID-QUANT PRO , an advanced Price Action Pattern Detection and Breakout Engine designed exclusively for MetaTrader 5 . Built specifically to capture the unique volatility of Gold (XAU/USD) and other major financial instruments, this powerful indicator combines high-precision algorithmic pattern recognition with real-time dynamic accumulation z
Linear Trend Predictor - Трендовый индикатор сочетающий в себе точки для входа и линии поддержки направления. Работает по принципу пробития ценового канала High/Low. Алгоритм индикатора фильтрует рыночный шум, учитывает волатильность и рыночную динамику. Возможности индикатора Методами сглаживания показывает рыночную тенденцию и точки входа для открытия ордеров BUY или SELL. Подходит для определения краткосрочных и долгосрочных движений рынка, анализируя графики на любых таймфреймах. Адаптивн
Индикатор для поиска разворотных участков цены  Хорошо работает на индексах сырьё и валютных парах  На графиках таких как Boom Cash хорошо показывает начало затяжного движение Так же можно улавливать всплески В индикаторе использован алгоритм канала осцылятора и трендового индикатора которые работают совместно  Индикатор показывает сигнал на открытии свечи ( не исчезнет не перерисовывает и не пересчитывает свои показания) Хорошо качественный инструмент который может стать основой для создания со
это универсальный аналитический индикатор, сочетающий в себе классический трендовый анализ и автоматическое построение ключевых уровней Фибоначчи. Инструмент разработан в виде удобной интерактивной панели и идеально подходит как для профессиональных трейдеров, так и для новичков. Индикатор самостоятельно определяет приоритетное направление рынка, рассчитывает сильные ценовые зоны и предоставляет четкие маркеры для входа в сделку и фиксации прибыли. Ключевой функционал и логика работы Автомат
Этот индикатор представляет собой индикатор автоматического волнового анализа, который идеально подходит для практической торговли! Случай... Примечание.   Я не привык использовать западные названия для классификации волн. Из-за влияния соглашения об именах Тан Лунь (Тан Чжун Шуо Дзен) я назвал основную волну   ручкой   , а вторичную полосу волн —   сегментом   Ат. в то же время сегмент имеет направление тренда. Именование   в основном является трендовым сегментом   (этот метод именования буде
Description: EuroPulse MACD Hist Flow — EMA200 Trend Filter with MACD Histogram EA (Swap-Free) PRODUCT OVERVIEW EuroPulse MACD Hist Flow is a premium automated trading solution designed for MetaTrader 5, specialized for the EURUSD currency pair. The EA implements a robust trend-following strategy: • EMA200 as long-term trend filter • MACD Histogram for momentum confirmation • ATR-based stop loss and take profit • Daily loss protection • Swap-Free mode for Islamic accounts WHY EUR
This is a simple arrow system based on Engulfing Candlestick Pattern. It gives you alerts on your smartphone when there is an engulfing candlestick pattern happens. Which type of alerts available? 1. It paints on chart Up/Down Arrows. 2. Popup message and sound alert in trading terminal window. 3. Push notification or Alert on your Android and IOS mobile phones (requires MT4 or MT5 app installed!) *Note: Use it on higher timeframes like H4 (4 hours), D1 (1 Day) then find trade opportunities on s
The Premium RangeXpert Extension with Multi-Timeframe Trading Signals for Forex, Gold & Bitcoin RangeXpert+ is the premium extension of the well-known RangeXpert — one of the Top-10 free indicators on the market, with over 10,000 downloads and an extremely active community. While the free version delivers precise breakout signals on a single chart, RangeXpert+ provides exactly what professional traders demand: a complete multi-timeframe cockpit directly in your chart, perfectly optimized for h
Представляем RSIScalperPro - революционный индикатор на основе RSI для MetaTrader 5, специально разработанный для скальпинга на графике одной минуты. С RSIScalperPro у вас будет мощный инструментарий для точных сигналов входа и выхода, чтобы повысить вашу торговую эффективность. RSIScalperPro использует два различных индикатора RSI, которые предоставляют четкие сигналы для уровней перекупленности и перепроданности. Вы можете настроить временные периоды и ограничительные значения двух RSI в соот
The  OBV MTF  is an Enterprise-grade On-Balance Volume indicator that transforms standard OBV into a complete trading system. It combines gradient-aware momentum analysis, divergence detection, multi-timeframe alignment, and dynamic customisable midpoint-filtering in a single intuitive professional volume analysis tool. Core Features 1. 5-State Momentum Engine Aqua (Strong Bullish) : OBV slope rising with positive acceleration SteelBlue (Weak Bullish) : OBV rising but losing momentum Gray (Neutr
This indicator shows external bars ("Aussenstäbe") in the chart in candle form. The colors of the candles can be set individually. Also different colors for bearish and bullish bars are possible. In addition, the color of the wicks or outlines is also adjustable. Outside bars are mentioned e.g. by Michael Voigt in the book "Das große Buch der Markttechnik". All other candles are inner bars.
Что делает советник - 174 фиксированных варианта стратегий в 31 группе, у каждой группы фиксированный вес - Bitcoin и Ethereum: пробойные входы, входы по тренду Keltner и скользящим средним на H1 и H4, дневной тренд и моментум, входы на расширении диапазона на H4, H6 и H8, Ichimoku на H8, сжатие Bollinger на H12 - USDJPY и Brent: дневной тренд и моментум. Золото: пробой H4 и тренд Keltner - У каждой сделки есть стоп-лосс. Выход по трейлинг-стопу, выходу из канала, противоположному сигналу или п
Link to our products: LINK The ICT Asian Killzone Indicator delivers a professional, institutional-grade framework by precisely defining the Asian trading session from 00:00 to 04:00 GMT with absolute accuracy. It streamlines market structure analysis by isolating liquidity accumulation, range formation, and volatility compression during the Asian session. Built for serious ICT and Smart Money traders, it enhances strategic decision-making, execution confidence, and Tokyo session directional bi
Product Name: Fair Value Channel Consolidation Breakout THE MACHINE LEARNING HAVE BEEN DESACTIVATED FOR A EASY TEST!!( OBS: IF THE CLIENT WANT IT WE CAN INTEGRATE IT EASILY) ATTENTION !!!! THE RIGHT INPUTS TO USE IN XAU/USD  CAN BE VIZUALIZED IN THE SCREENSHOTS, IF THE INPUTS ARE NOT USED THE RESULT CAN DIFFERS! TAKE PROFIT , SELL LOSS AND TRAILLING STOP CAN BE CHANGED IF YOU DESIRE Stop trading the past. Start trading the true Fair Value. Fair Value Channel Consolidation Breakout  is not just
MULTICANDLE SCANNER DASHBOARD PRO MT5: Institutional Multi-Pair Multi-Timeframe Price Action Scanner with Dynamic ATR SL/TP & 16-Filter Confluence Engine PRODUCT TYPE Category: MetaTrader 5 Multi-Asset Technical Scanner & Trading Dashboard Strategy Engine: Multi-Candle Price Action Momentum (4C / 5C / 6C Patterns) Signal Integrity: 100% Non-Repainting Execution (Strict Bar-Close Confirmation) Trading Styles: High-Frequency Scalping (M1/M5), Day
Aegis XAU Extreme Edition Overview Aegis XAU Extreme Edition is a trend-following Expert Advisor designed exclusively for XAUUSD M1 . Rather than trading throughout the entire day, it focuses only on carefully selected trading sessions identified through extensive historical testing. By avoiding statistically unfavorable hours, the EA aims to improve overall trading efficiency while maintaining consistent long-term performance. The strategy combines: EMA Trend Filter EMA Pullback Entry ADX Tr
Bestofthebest
Francisco Marcio Serafim
Лучший индикатор, который я создал для скальпинга и внутридневной торговли. Забудьте обо всех остальных и изучите этот. До скорого. Этот индикатор показывает точки истощения цены на основе движений. За несколько месяцев он доказал свою высокую эффективность на паре XAU/USD. При использовании методов скальпинга и мартингейла он становится очень точным. Изучайте и используйте этот индикатор по максимуму, пока не обретете уверенность. Старайтесь входить в позицию постепенно и увеличивайте размер
An all‑in‑one trading assistant that blends AI candle synthesis with a 15‑pattern Heat Map, ATR‑scaled S/R & pivots, and a Vigilant risk monitor (LOC/TF/SR/PAT gates, Ready%, EM points, SR‑distance bar). The Opportunity Advisor adds ETAs, checklists and gate status; Multi‑TF Confluence confirms alignment from M1–D1. The Professional Trade Suggestion panel shows regime, session filter, R:R presets, Partials and Quality Pause. Clean, readable UI with one‑click S/R toggles, scanners and a built‑in,
Anchored VWAP Trading Indicator Struggling to identify true market value and key support/resistance levels? The Anchored VWAP Trading Indicator helps you track price based on real traded volume, giving you a clear edge in your trading decisions. This tool allows you to anchor VWAP from any point on the chart, making it ideal for analyzing trends, reversals, and institutional activity. Key Features Anchored VWAP from any candle Accurate volume-weighted price calculation Works on all symbol
Inspired by the popular beat the market maker Multi MA. Now available for MT5 to be utilized. Multi Exponential Moving Average (Multi-EMA) Indicator for MT5 The Multi-EMA Indicator is designed to help traders visualize multiple exponential moving averages on one chart with precision and clarity. It plots five customizable EMA lines, each with distinct colors, making it easy to identify market trend direction, strength, and potential reversal zones at a glance. Key Features: Plots five indepen

ForeCastX AI — индикатор для MetaTrader 5. На графике отображаются окраска тренда по свингам, стрелки покупки и продажи, зоны спроса и предложения, панель силы покупателей и продавцов по нескольким таймфреймам и необязательная проекция пути. Проекция — визуальная схема по текущей структуре и панели. Это не прогноз цены и не самостоятельный торговый сигнал. На графике Свечи окрашены по текущему свинговому тренду Стрелки при пробое подтвержденного свингового максимума или минимума Прямоугольники с
Harraz Master HUD
Muhammad Azraf Bin Dzul Fauzi
HARRAZ MASTER HUD v4.4 - The Ultimate Neural Trading Command Center ​ Transform your MetaTrader 5 into a professional, institutional-grade trading terminal. Harraz Master HUD is not just an indicator; it is a complete Artificial Intelligence ecosystem designed specifically for XAUUSD (Gold) and major pairs. ​ EXCLUSIVE FEATURES: ​1. Live Neural AI Typewriter (Jarvis Mode) Experience a live, animated Heads-Up Display that types out real-time market sentiment and advice. It acts as your persona
Gann Box MT5
Frederic Jacques Collomb
aИндикатор Gann Box — это мощный и многофункциональный инструмент, разработанный для помощи трейдерам в выявлении и использовании ключевых уровней на рынке. Этот индикатор позволяет нарисовать на графике прямоугольник, который автоматически разделяется на несколько зон со стратегическими уровнями 0, 0.25, 0.50, 0.75, 1 . Когда цена касается одного из этих уровней, срабатывают предупреждения, что является ценным помощником в принятии торговых решений. Вы мгновенно видите, как развивается рынок п
【Super Scanner】Indicator Introduction : The color of the Super Scanner which is green and climbing up means that the price trend is going up.The color of the Super Scanner is red and going down means that the price trend is going down. It is very simple to use it to judge the market trend! What's even better is that the open parameters of the indicators allow investors to adjust. You can adjust【Super Scanner】according to your needs. Adjust it faster to be closer to short-term market fluctuatio

ICT Market Time Cycle MT5 – Complete Session & Time Window Индикатор ICT Market Time Cycle — это профессиональный торговый инструмент, разработанный для того, чтобы помочь трейдерам легко следовать методологии ICT (Inner Circle Trader). Он автоматически отображает основные сессии рынка (Азия, Лондон и Нью-Йорк), а также зоны Killzones, окна Silver Bullet и макро-времена (Macro times) прямо на вашем графике. С этим инструментом вам больше не нужно вычислять время сессий вручную — все строится авт
С этим продуктом покупают
Trend Sniper X
Sarvarbek Abduvoxobov
4.9 (40)
Trend Sniper X — это трендовый индикатор для MetaTrader 5, работающий на нескольких таймфреймах, который помогает трейдерам точно и ясно определять направление тренда и потенциальные точки разворота. для MT4: https://www.mql5.com/en/market/product/193245 Информация о цене: Текущая цена является промо-ценой и может измениться по мере выхода предстоящих обновлений и новых функций. Бонусное предложение: Чтобы получить БЕСПЛАТНЫЙ авто-трейд советник Assistant EA для этого индикатора, пожалуйста, на
Smart Trend Trading System — MetaTrader 5 После покупки напишите мне на MQL5, чтобы БЕСПЛАТНО получить Smart Universal Expert Advisor, а также доступ к онлайн-курсу, руководство в формате PDF и доступ к закрытой группе. STTS объединяет направление тренда, сигналы входа и выхода, зоны разворота и важные ценовые уровни прямо на графике. Торгуйте по системе вручную или подключите отдельный совместимый советник для автоматического исполнения с выбранными вами настройками. ОДНА СИСТЕМА. ЧЕТЫРЕ ТОРГОВ
ARIPoint
Temirlan Kdyrkhan
1 (4)
ARIBot is a powerful trading companion designed to generate high-probability entry signals with dynamic TP/SL/DP levels based on volatility. Built-in performance tracking shows win/loss stats, PP1/PP2 hits, and success rates — all updated live. Key Features: Buy/Sell signals with adaptive volatility bands Real-time TP/SL/DP levels based on ATR Built-in MA Filter with optional ATR/StdDev volatility Performance stats panel (Success, Profit/Loss, PP1/PP2) Alerts via popup, sound, push, or email Cus
SuperScalp Pro
Van Minh Nguyen
4.66 (35)
SuperScalp Pro - Professional Multi-Layer Confluence Scalping System SuperScalp Pro — это продвинутый индикатор для скальпинга, который улучшает классический Supertrend с помощью нескольких интеллектуальных фильтров подтверждения. Он помогает определять торговые возможности Buy/Sell с более высокой вероятностью, значительно сокращая количество ложных сигналов. Чёткие стрелки Buy и Sell отображаются непосредственно на графике, а уровни Stop Loss и Take Profit на основе ATR автоматически рассчитыв
Gann Made Easy   - это профессиональная, но при этом очень простая в применении Форекс система, основанная на лучших принципах торговли по методам господина У.Д. Ганна. Индикатор дает точные BUY/SELL сигналы, включающие в себя уровни Stop Loss и Take Profit. ПОЖАЛУЙСТА, СВЯЖИТЕСЬ СО МНОЙ ПОСЛЕ ПОКУПКИ, ЧТОБЫ ПОЛУЧИТЬ ТОРГОВЫЕ ИНСТРУКЦИИ И ОТЛИЧНЫЕ ДОПОЛНИТЕЛЬНЫЕ ИНДИКАТОРЫ БЕСПЛАТНО! Вероятно вы уже не раз слышали о торговли по методам Ганна. Как правило теория Ганна отпугивает от себя не только
SMC Intraday Formula
VividMind Digital Solutions
5 (26)
Давайте сначала будем честны. Ни один индикатор сам по себе не сделает вас прибыльным. Если кто-то говорит вам обратное — он продаёт вам мечту. Любой индикатор, который показывает идеальные стрелки покупки/продажи, можно сделать безупречным — просто увеличьте нужный участок истории и сделайте скриншот успешных сделок. Мы так делать не будем. SMC Intraday Formula — это инструмент. Он считывает структуру рынка за вас, определяет зоны с наивысшей вероятностью движения цены и точно показывает, как
Новый король в городе — Индикатор + управление ордерами (TP1 + TP2 + TP3) + опциональный Telegram-сигнал-сендер ВКЛЮЧЁН (БЕСПЛАТНО) (ПОЛНОЦЕННАЯ ТОРГОВАЯ И СИГНАЛЬНАЯ СИСТЕМА) Gold Slayer EA Этот индикатор включает в себя продвинутую стратегию, торговую систему с настраиваемым управлением ордерами и систему mean reversion, которая сочетает расширения Envelope и поддерживается несколькими интеллектуальными фильтрами подтверждения, такими как RSI, для поиска высоковероятных точек разворота с сигн
Neuro Poseidon - новый индикатор от Дарьи Резуевой. Он сочетает точные торговые сигналы с адаптивными уровнями TP/SL , в результате создавая максимально выгодные сделки! TO SWITCH TO   ENG   PLEASE CHOOSE IT IN THE UPPER-RIGHT CORNER OF THE WEBSITE Напишите мне и получите  Neuro Poseidon Assistant  в подарок для автоматизации вашей торговли! Что отличает его от других индикаторов? 1. Доказанная прибыльность на всех активах и таймфреймах 2. На графике присутствуют только подтвержденные сигналы н
Auto Optimized SpeedAngle — это система векторизации импульса институционального уровня, которая исключает подгонку под исторические данные (curve-fitting) за счет непрерывной форвард-оптимизации (Walk-Forward Optimization, WFO). Вместо того чтобы полагаться на статические входные параметры, которые теряют эффективность при смене рыночных режимов, индикатор динамически перекалибрует свои настройки, используя валидацию на вневыборочных данных (Out-of-Sample, OOS). Это гарантирует, что отображаемы
Entry Points Pro — топ-1 индикатор по количеству отзывов (600 отзывов и 31 000 скачиваний обеих версий). Индикатор даёт самые перспективные точки входа в сделки без перерисовки на любых инструментах. Индикатор покажет заранее стрелкой точку входа в сделку, укажет цену входа и нарисует на графике уровень входа и стопа, а так же рассчитает рабочий лот под твой депозит и риск, а панель статистики поможет выбрать самый перспективный инструмент и таймфрейм .  Тебе остаётся поставить отложенный ордер
FiboSniper Pro – Multi-Filter Fibonacci System with Auto SL/TP and Control Panel FiboSniper Pro — это технический индикатор, который объединяет динамические Fibonacci Envelopes с несколькими фильтрами подтверждения для формирования отборных сигналов Buy и Sell. Уровни Fibonacci рассчитываются на основе Moving Average и ATR, а затем фильтруются с помощью ADX, EMA, RSI, ATR, Volume, Time и структуры свечи. Индикатор отображает на графике автоматические уровни Stop Loss и Take Profit на основе ATR,
Welcome to ENTRY IN THE ZONE AND SMC MULTI TIMEFRAME SPECIAL BENEFIT / FOR OUR MQL5 CUSTOMERS FREE ACCESS TO THE NEW TOOL  — COMING SOON — Learn more on our official website  : https://www.fableedge.net Entry In The Zone and SMC Multi Timeframe is a real-time market analysis tool based on Smart Money Concepts (SMC), designed to analyze market structure, price direction, and key trading zones. It supports both Single-Timeframe Analysis and Multi-Timeframe Analysis, providing a clearer view of the
Unix Scalper — MetaTrader 5 После покупки напишите мне на MQL5, чтобы БЕСПЛАТНО получить Smart Universal Expert Advisor, а также доступ к онлайн-курсу, руководство в формате PDF и доступ к закрытой группе. Найдите торговую ситуацию. Оцените план. Выберите способ торговли. UNIX Scalper объединяет анализ рынка, решения BUY/SELL/WAIT и уровни Entry, Stop Loss, TP1 и TP2 в одной удобной панели. УВИДЬТЕ СИГНАЛ И ТОРГОВЫЙ ПЛАН • Понятные решения: BUY, SELL или WAIT. • Определённые уровни: Entry, Stop
M1 SNIPER   — это простая в использовании торговая система. Это стрелочный индикатор, разработанный для тайм фрейма M1. Индикатор можно использовать как отдельную систему для скальпинга на тайм фрейме M1, а также как часть вашей существующей торговой системы. Хотя эта торговая система была разработана специально для торговли на M1, ее можно использовать и с другими тайм фреймами. Первоначально я разработал этот метод для торговли XAUUSD и BTCUSD. Но я считаю этот метод полезным и для торговли на
Adaptive Price Action Engine Купи индикатор — получи советник (EA) к нему бесплатно Самооптимизирующийся мульти-таймфреймовый анализ тренда и свечных моделей Рынок постоянно меняется — и не каждая модель Price Action имеет одинаковую ценность в разных рыночных режимах. Adaptive Price Action Engine создан для адаптации к изменяющимся рыночным условиям, объединяя трендовую структуру, мульти-таймфреймовый анализ, свечные модели и статистическую оптимизацию в единой аналитической системе. Два адапти
Scalper Vault   — это профессиональная торговая система, которая дает вам все необходимое для успешного скальпинга. Этот индикатор представляет собой полную торговую систему, которую могут использовать трейдеры форекс и бинарных опционов. Рекомендуемый тайм фрейм М5. Система дает точные стрелочные сигналы в направлении тренда. Она также предоставляет вам сигналы выхода и рассчитывает рыночные уровни Ганна. Индикатор дает все типы оповещений, включая PUSH-уведомления. Пожалуйста, напишите мне пос
FX Trend NG: Следующее поколение интеллектуального анализа трендов на разных рынках Обзор FX Trend NG — это профессиональный инструмент анализа трендов и мониторинга рынка с поддержкой нескольких таймфреймов. Он позволяет за секунды получить полное структурное понимание текущего состояния рынка. Вместо переключения между десятками графиков вы мгновенно видите, какие инструменты находятся в тренде, где импульс ослабевает и где наблюдается сильная синхронизация между таймфреймами. Специальное пр
FX Power: Анализируйте силу валют для более эффективной торговли Обзор FX Power — это ваш незаменимый инструмент для понимания реальной силы валют и золота в любых рыночных условиях. Определяя сильные валюты для покупки и слабые для продажи, FX Power упрощает принятие торговых решений и выявляет высоковероятные возможности. Независимо от того, хотите ли вы следовать за трендами или предсказывать развороты с использованием экстремальных значений дельты, этот инструмент идеально адаптируется под
Power Candles V3 — самооптимизирующийся индикатор силы Power Candles V3 преобразует силу валюты и инструмента в готовый к использованию торговый план на каждом графике, к которому он прикреплен. Вместо того, чтобы просто раскрашивать свечи, он выполняет автоматическую оптимизацию в режиме реального времени в фоновом режиме и предоставляет вам оптимальные значения Stop Loss, Take Profit и порог сигнала для выбранного вами символа. Один клик — и все готово для реальной торговли: на графике появляю
M1 Quantum MT5
Hamed Dehgani
4.2 (10)
Торговые сигналы в реальном времени с использованием M1 Quantum: Сигнал  (Сделка выполнена автоматически с помощью Quantum Trade Assistant , бесплатно включённого в этот продукт.) Последние новости : Выпущена версия 1.64. Теперь для всех сделок Stop Loss размещается за соответствующими зонами поддержки/сопротивления. Функция Smart Close также была улучшена для повышения производительности EA в этой версии. С 9 августа live-сигнал работает на версии 1.64. План цен: Текущая цена: $169 (Предложени
Atomic Analyst — MetaTrader 5 После покупки напишите мне на MQL5, чтобы БЕСПЛАТНО получить Smart Universal Expert Advisor, а также доступ к онлайн-курсу, руководство в формате PDF и доступ к закрытой группе. Atomic Analyst объединяет анализ ценового движения, направление тренда, сигналы входа и выхода, уровни Stop Loss и несколько уровней Take Profit прямо на графике. УВИДЬТЕ СИГНАЛ. ОЦЕНИТЕ ТОРГОВУЮ СИТУАЦИЮ. Atomic Analyst представляет результаты анализа в понятном визуальном виде: • Стрелки п
Crystal Heikin Ashi Signals—Professional Trend & Signal Detection Indicator Advanced Heikin Ashi Visualization with Intelligent Signal System for Manual & Automated Trading Final Price: $149 ---------> Price goes up $10 after every 10 sales . Limited slots available — act fast . Overview User Guide PDF Crystal Heikin Ashi Signals is a professional-grade MetaTrader 5 indicator that combines pure Heikin Ashi candle visualization with an advanced momentum-shift detection system. Designed for both m
Каждый покупатель этого индикатора получает дополнительно Бесплатно: Авторскую утилиту "Bomber Utility", которая автоматически сопровождает каждю торговую операцию, устанавливает уровни Стоп Лосс и Тейк профит и закрывает сделки согласно правилам этой стратегии, Сет-файлы для настройки этого индикатора на различных активах, Сет-файлы для настройки Bomber Utility в режимы: "Минимум Риска", "Взвешенный Риск" и "Стратегия Выжидания", Пошаговый видео-мануал, который поможет вам быстро установить, н
Quant Direction — это инструмент трехмерного анализа рынка. Он обеспечивает полностью объективный, основанный на алгоритмах анализ рынка, одновременно вычисляя точные процентные отклонения по нескольким параметрам. Разработанный с использованием передовых инструментов моделирования на основе искусственного интеллекта и тщательно протестированный, алгоритм предназначен для интерпретации рынка с уникальной точностью. Он может анализировать любую валютную пару или финансовый инструмент на вашей пла
Btmm state engine pro
Garry James Goodchild
5 (4)
BTMM State Engine Pro by G-Labs — Beat The Market Maker indicator for MetaTrader 5. Asian session range, London and New York kill zones, level progression (L1/L2/L3), peak formation detection (PFH/PFL), entry signals, and a multi-pair scanner from one chart. Stop scanning charts one pair at a time. The State Engine tracks the BTMM daily cycle automatically — Asian box, room boundaries, level blocks, peak formations, and filtered entries — while the scanner dashboard shows level, peak status, d
SkyHammer Signal Pro Профессиональный трендовый индикатор без перерисовки с фиксированными уровнями Entry, SL и TP SkyHammer Signal Pro — это структурированный индикатор тренда и momentum, созданный для трейдеров, которым нужны четкие, зафиксированные и проверяемые торговые сигналы. Лучше всего он работает на младших таймфреймах, таких как M1 и M5 . Индикатор не пытается предсказывать вершины или основания рынка. Вместо этого он ожидает подтвержденную рыночную структуру, направление тренда, силу
Precision Spike Detector
Francisco Mandomo Simbine
5 (2)
Precision Spike Detector V3 – Institutional-Grade AI Trading System Attention: The price increases by US$50 for every 10 purchases.  Final price: US$599 Precision Spike Detector V3   is a   state-of-the-art, institutional-grade market analysis system   for   MetaTrader 5 , designed to detect   high-probability market movements   in synthetic indices such as   Boom, Crash, GainX, and PainX . After purchase, send me a private message to receive the optimized configuration files,  the installation
UZFX {SSS} Scalping Smart Signals v5.0 MT5 — это высокопроизводительный торговый индикатор без перерисовки, разработанный для скальперов, дейтрейдеров и свинг-трейдеров, которым требуются точные сигналы в режиме реального времени на быстро меняющихся рынках. Разработанный компанией (UZFX-LABS), этот индикатор сочетает в себе анализ ценового действия, подтверждение тренда и интеллектуальную фильтрацию для генерации высоковероятных сигналов на покупку и продажу, предупреждающих сигналов и возможно
PainX 400 FAKEOUT DETECTOR MT5 Custom Indicator  ·  Sell-Side Bias  ·  Scalping  ·  RSI(6) Filtered   OVERVIEW   The Spike Fakeout Detector is a non repaint precision technical indicator built exclusively for Crash / PainX synthetic indices on the platform. It is engineered around one of the most consistent and exploitable patterns on this instrument — the false breakout above resistance followed by a sharp price drop. Crash/PainX is a growing index that produces a significant price drop app
Currency Strength Wizard   — очень мощный индикатор, предоставляющий вам комплексное решение для успешной торговли. Индикатор рассчитывает силу той или иной форекс-пары, используя данные всех валют на нескольких тайм фреймах. Эти данные представлены в виде простых в использовании индексов валют и линий силы валют, которые вы можете использовать, чтобы увидеть силу той или иной валюты. Все, что вам нужно, это прикрепить индикатор к графику, на котором вы хотите торговать, и индикатор покажет вам
Другие продукты этого автора
Trend and Consolidation Matrix — это индикатор структуры рынка и ценового действия (Price Action) для MetaTrader 5, объединяющий 6-уровневую адаптивную ленту тренда, модуль пространственных зон консолидации и систему алертов на пробои и ретесты для Forex, Gold (XAUUSD) и индексов. Разработанный для скальпинга, дейтрейдинга и свинговой торговли, алгоритм рассчитывает направление тренда, структуру волатильности и геометрию плотности цен строго на закрытых барах без перерисовки истории. Архитектура
FREE
SWING DETECTOR WITH RSI AND FIBONACCI Structural Swing Points + Fibonacci Retracement + RSI Overlay -------------------------------------------------- FREE INDICATOR Identify swings. See Fibonacci levels. Check RSI. All in one free indicator. -------------------------------------------------- WHAT THIS INDICATOR DOES This indicator automatically detects structural swing highs and lows using configurable depth and deviation filtering. It connects swings with trend lines, overlays standard
FREE
SWING VOLUME PROFILE Swing-Based Volume Profile + Fibonacci + RSI -------------------------------------------------- Auto-detected swings. Volume profile. Fibonacci. RSI. All-in-one. -------------------------------------------------- WHAT THIS INDICATOR DOES Swing Volume Profile (SVP) automatically detects structural swings and displays a volume profile for the most recent completed swing — with Fibonacci retracement and RSI overlay. No manual range selection needed. The indicator finds
SWING DETECTOR WITH RSI AND FIBONACCI Structural Swing Points + Fibonacci Retracement + RSI Overlay -------------------------------------------------- FREE INDICATOR Identify swings. See Fibonacci levels. Check RSI. All in one free indicator. -------------------------------------------------- WHAT THIS INDICATOR DOES This indicator automatically detects structural swing highs and lows using configurable depth and deviation filtering. It connects swings with trend lines, overlays standard
FREE
Fixed Range Volume Profile — это инструмент анализа объема для MetaTrader 5, который рассчитывает и отображает распределение объема по любому выбранному диапазону цен и времени с помощью стандартных трендовых линий для Forex, Gold (XAUUSD), индексов и криптовалют. Разработанный для дейтрейдинга, скальпинга и свинговой торговли, индикатор автоматически строит точку контроля (POC), границы зоны стоимости (VAH/VAL) и сильные уровни поддержки и сопротивления без сложной ручной настройки. Архитектура
SWING HIGHS LOWS DETECTOR Swing Detection with Divergence Analysis -------------------------------------------------- Identify swings. Spot divergences. Trade with confluence. -------------------------------------------------- WHAT THIS INDICATOR DOES This indicator automatically detects structural swing highs and lows using configurable depth and deviation filtering. It then analyzes RSI and MACD to detect regular and hidden divergences between consecutive swings of the same type. Diver
FREE
SWING HIGHS LOWS DETECTOR Swing Detection with Divergence Analysis -------------------------------------------------- Identify swings. Spot divergences. Trade with confluence. -------------------------------------------------- WHAT THIS INDICATOR DOES This indicator automatically detects structural swing highs and lows using configurable depth and deviation filtering. It then analyzes RSI and MACD to detect regular and hidden divergences between consecutive swings of the same type. Diver
FREE
VWAP Ribbons
Charles Mwangi Ndungu
VWAP Ribbon Intelligence — это индикатор технического анализа для MetaTrader 5, объединяющий средневзвешенную цену по объему (VWAP), динамические ленты волатильности ATR Уайлдера и телеметрию импульса RSI на графике для Forex, Gold (XAUUSD), индексов и криптовалют. Разработанный для дейтрейдинга, скальпинга и свинговой торговли, инструмент проецирует зоны расширения волатильности и показатели импульса прямо на основной ценовой график без необходимости использования подвальных осцилляторов. Архит
FREE
VWAP Ribbon Intelligence — это индикатор технического анализа для MetaTrader 4, объединяющий средневзвешенную цену по объему (VWAP), динамические ленты волатильности ATR Уайлдера и телеметрию импульса RSI на графике для Forex, Gold (XAUUSD), индексов и криптовалют. Разработанный для дейтрейдинга, скальпинга и свинговой торговли, инструмент проецирует зоны расширения волатильности и показатели импульса прямо на основной ценовой график без необходимости использования подвальных осцилляторов. Архит
FREE
Fixed Range Volume Profile MT4 Volume Profile Indicator — Auto-Detecting Trendline Tracking, POC, Value Area & High Volume Nodes in Real Time Fixed Range Volume Profile (FRVP) displays volume distribution over a user-defined range — automatically detecting the latest trendline you draw or drag on the chart. No manual range selection. No naming conflicts. Just draw a trendline and the profile appears. Update it live by dragging. MT4 Native • No Repainting • Real-Time Trendline Tracking • Fully Cu
Adaptive Swing Density Heat Map MT4 Structural Density Indicator — Swing Clustering, Participation Tracking, Acceptance vs Rejection & Color-Coded Heat Map Adaptive Swing Density Heat Map analyzes swing point density across price levels, then tracks how price actually interacts with each zone — measuring participation, acceptance, and rejection. The result is a heat map of structural zones, color-coded by density strength. Not all support and resistance levels are equal — this indicator quantif
CONSOLIDATION INTELLIGENCE PRO MT4 Consolidation Indicator | Automatic Range Detection + 5-Tier Price-Density Heatmaps + Re-Entry Alerts Consolidation Intelligence Pro is a MetaTrader 4 indicator designed to identify areas where price repeatedly overlaps and trades within a concentrated range. The indicator analyzes candle overlap, body-to-wick structure, zone strength, and price-density distribution, then displays detected consolidation areas as 5-tier heatmaps directly on the chart. It also su
DONCHIAN MARKET & TREND INTELLIGENCE ENGINE (MT4) Multi-Factor Volatility, Trend Structure & Institutional Breakout Validation Dashboard MOST BREAKOUT INDICATORS ARE TRAPPING YOU. They Tell You THAT Price Broke Out. They Never Tell You IF It Will Hold. You have lived this scenario dozens of times: Price spends days coiling inside a tight Donchian band on your MT4 chart. A massive candle punches above the 20-period high. You buy the breakout — expecting momentum. Three candles later, price colla
BOLLINGER MARKET & TREND INTELLIGENCE MT4 Bollinger Breakout Analysis • Volatility Regimes • Trend Structure • Breakout Validation • Post-Breakout Analysis STOP GUESSING WHICH BREAKOUTS ARE REAL. You've been here before. Price closes outside the upper Bollinger Band. You see the breakout. You hesitate for a second — then enter. Three candles later, price is back inside the band. The breakout failed. Now you're wondering whether you entered too early, whether you should have waited for a retest,
VWAP Sniper Reversal Pro v3.00 MT4 Mean-Reversion Indicator — Rolling VWAP, Dual-Layer ATR Bands, Volume Exhaustion, RSI Gate & Confirmation Modes VWAP Sniper Reversal Pro identifies potential mean-reversion setups at statistical price extremes. It combines a rolling volume-weighted average price (VWAP) baseline, dual-layer ATR deviation bands, volume and wick exhaustion filters, and an RSI gate to confirm reversal signals on completed bars. Built for traders who want multi-factor confluence ra
Swing Volume Profile MT5 Swing Volume Profile Indicator — Auto Swing Detection, Volume Profile, Fibonacci Retracement & RSI Overlay in One Chart Tool Swing Volume Profile (SVP) automatically detects structural swings and displays a volume profile for the most recent completed swing — with Fibonacci retracement and RSI overlay. No manual range selection. No trendline required. The indicator finds the swings and builds the profile automatically. MT5 Native • No Repainting • Auto Swing Detection •
Consolidation Intelligence Pro MT5 Consolidation Indicator — Automatic Range Detection, 5-Tier Price-Density Heatmaps & Re-Entry Alerts Consolidation Intelligence Pro automatically identifies where price repeatedly overlaps and trades within a concentrated range — then renders that structure as a 5-tier price-density heatmap directly on your chart. No more manually drawing every consolidation box. The indicator analyzes historical price structure, measures candle overlap and body-to-wick charac
DONCHIAN MARKET & TREND INTELLIGENCE The Only Donchian Tool That Tells You WHY the Market Is Moving — Not Just Where Most Donchian indicators draw three lines and call it a day. You get an upper band. A middle band. A lower band. And when price pokes above the upper band, you're supposed to just... buy? That's not analysis. That's guessing with extra steps. THE PROBLEM EVERY DONCHIAN TRADER KNOWS You've seen it a hundred times. Price finally breaks above the 20-period high after days of compress
BOLLINGER MARKET & TREND INTELLIGENCE — MT5 STOP GUESSING WHAT A BOLLINGER BREAKOUT IS TELLING YOU You've been here before. It's 2 AM. You're staring at a chart. Price has just closed outside the upper Bollinger Band. You enter. Three candles later, price is back inside the band. Then the move reverses. You tell yourself: "I should have waited for a retest." But when you wait for the retest, sometimes price continues without giving you the entry you wanted. So you add another filter. RSI. Then M
VWAP Sniper Reversal Pro — это индикатор разворотов и откатов для MetaTrader 5, объединяющий средневзвешенную цену по объему (VWAP), двухслойные полосы волатильности ATR, всплески объема и фильтры импульса RSI для Forex, Gold (XAUUSD), индексов и криптовалют. Разработанный для скальпинга, дейтрейдинга и свинговой торговли, инструмент определяет точки разворота при сильном отклонении цены от справедливой стоимости, рассчитывая подтвержденные сигналы строго на закрытых барах без перерисовки истори
Super Trend and Consolidation Matrix — это индикатор структуры рынка и ценового действия (Price Action) для MetaTrader 5, объединяющий 6-уровневую адаптивную ленту тренда, модуль сжатия волатильности, динамические зоны консолидации и информационную панель конфлюэнции в реальном времени для Forex, Gold (XAUUSD) и фондовых индексов. Разработанный для скальпинга, дейтрейдинга и свинговой торговли, алгоритм предоставляет объективный структурный анализ, рассчитываемый строго на закрытых барах без пер
Фильтр:
Нет отзывов
Ответ на отзыв