Adaptive Swing Density Heat Map
- Indicatori
- Versione: 1.0
- Attivazioni: 5

Adaptive Swing Density Heat Map
MT5 Structural Density Indicator — Swing Clustering, Participation Tracking, Acceptance vs Rejection & Color-Coded Heat Map
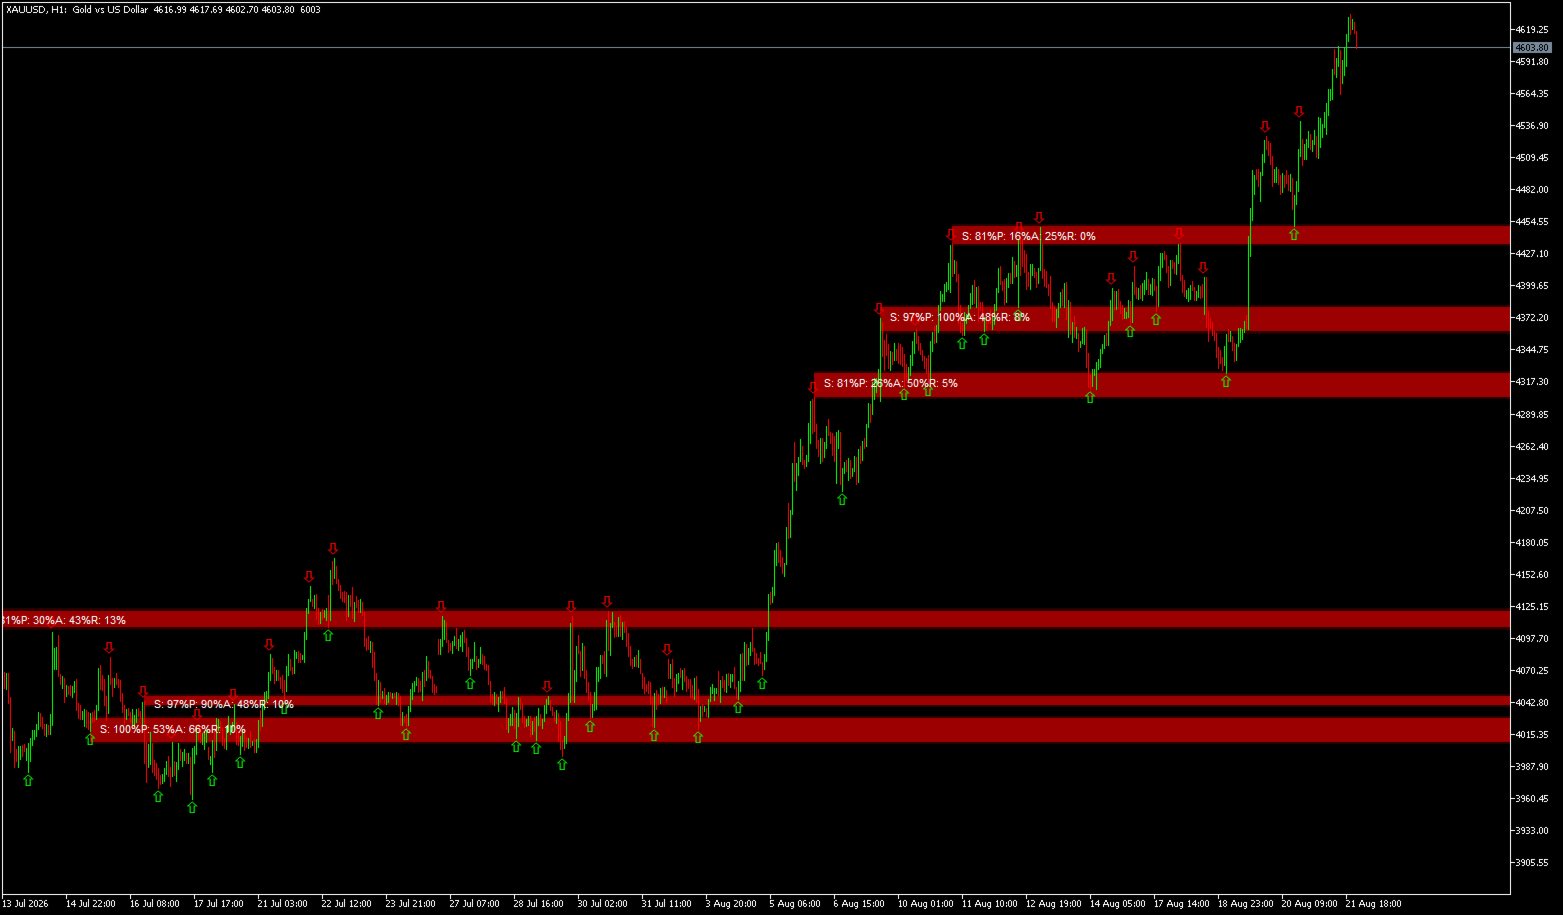
Adaptive Swing Density Heat Map analyzes swing point density across price levels, then tracks how price actually interacts with each zone — measuring participation, acceptance, and rejection.
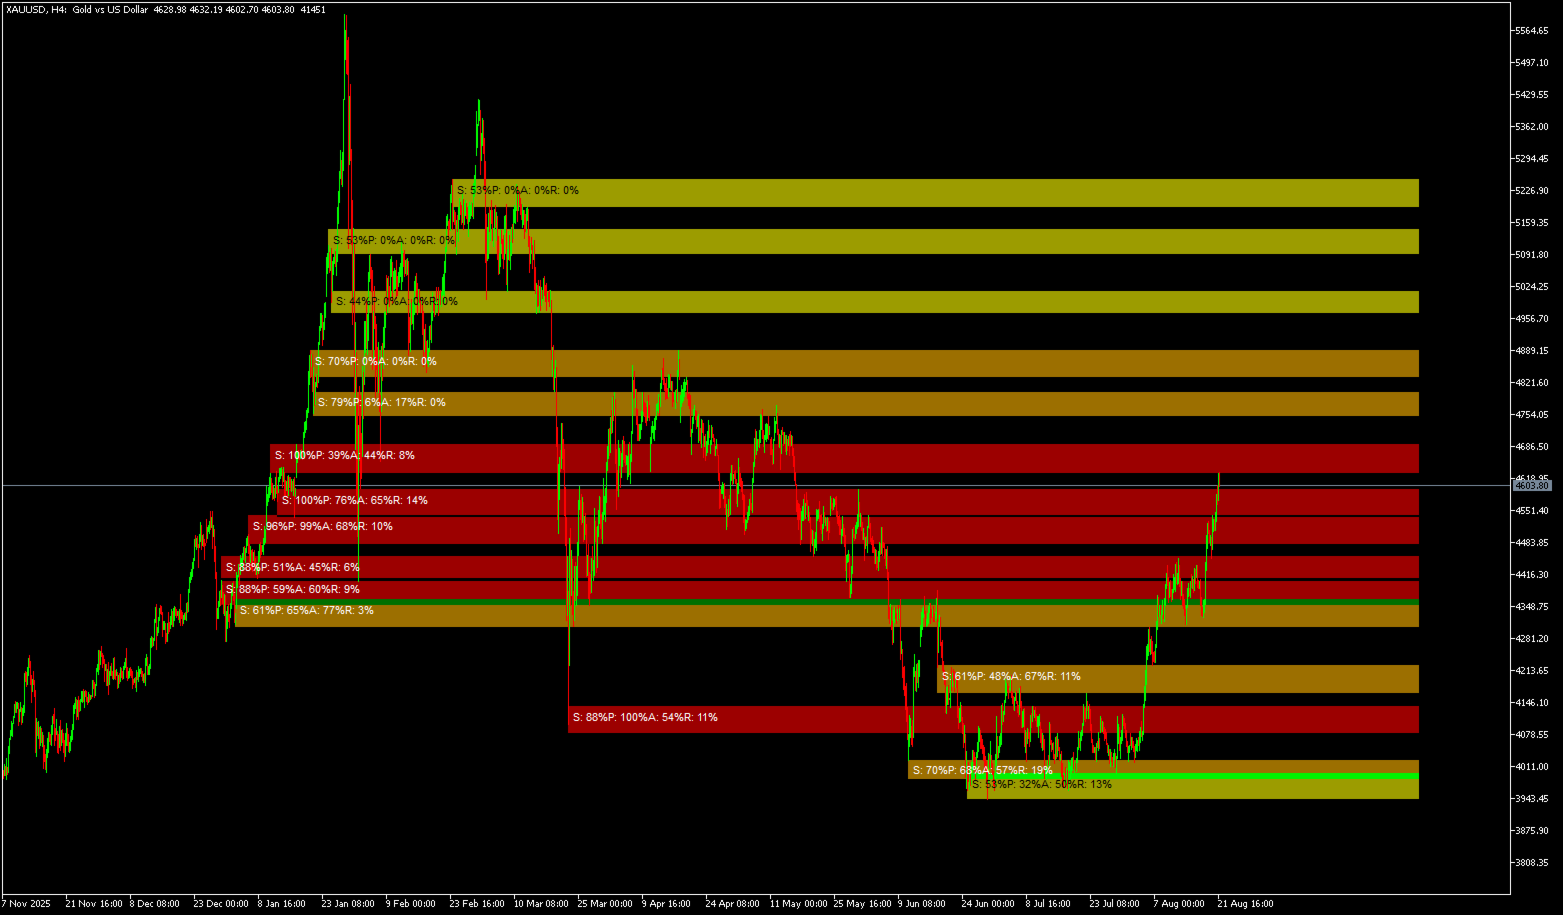
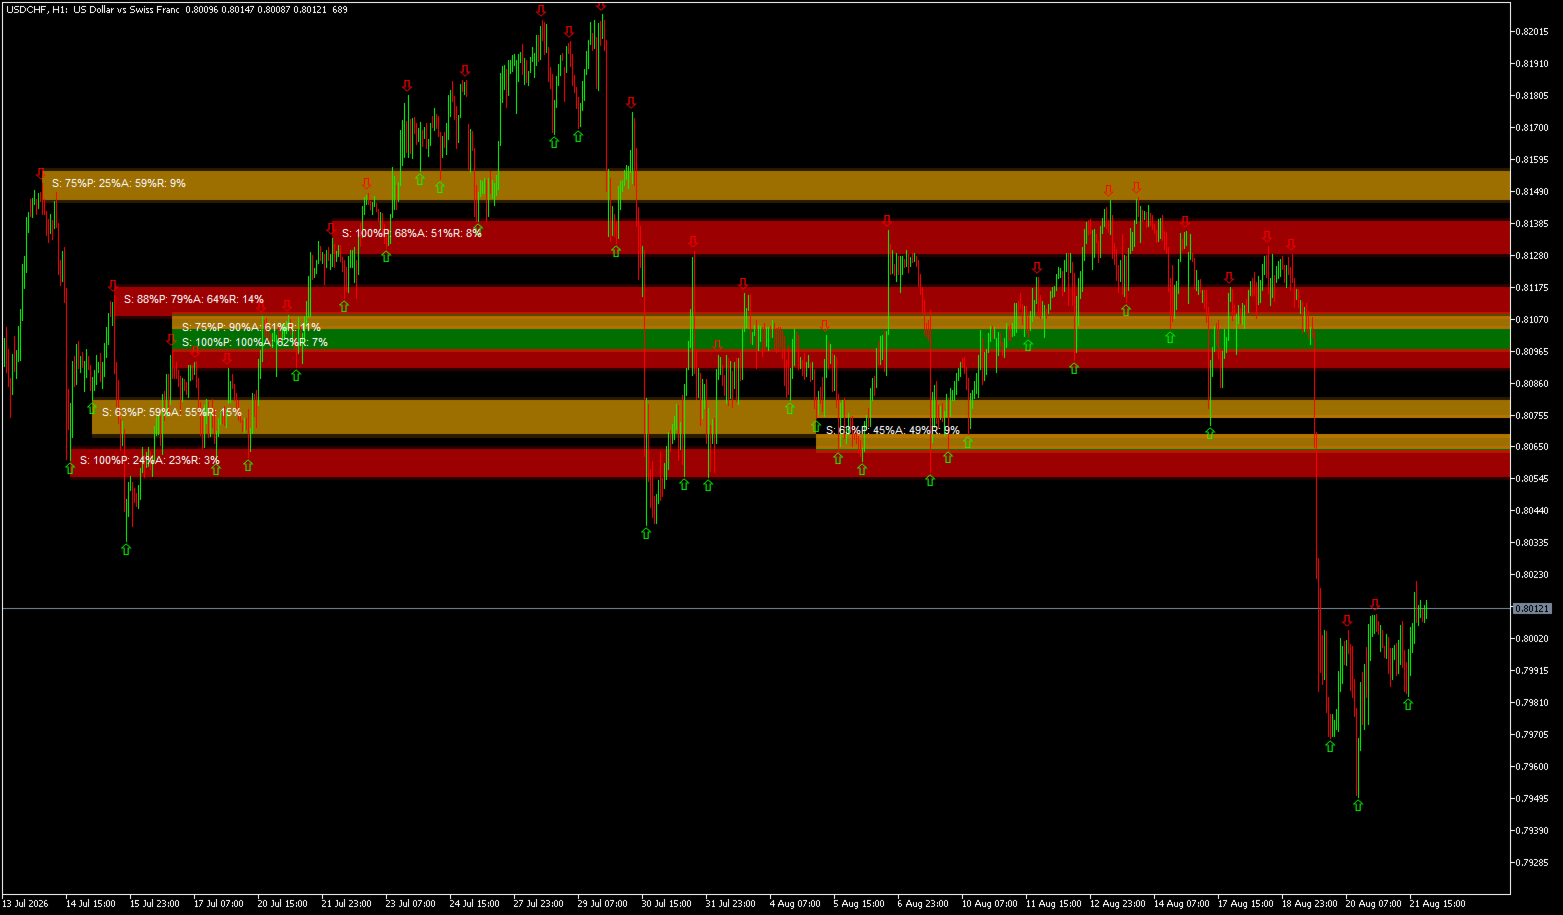
The result is a heat map of structural zones, color-coded by density strength. Not all support and resistance levels are equal — this indicator quantifies the difference.
MT5 Native • No Repainting • Adaptive to Volatility • Fully Customizable
The Idea in One Line
See where price clusters. See where price fights.
What the Indicator Does
Adaptive Swing Density Heat Map answers one core question:
Where have swings repeatedly clustered — and is price accepting or rejecting those levels right now?
The indicator detects swing points using a fractal algorithm, clusters them by ATR-based price proximity, and assigns each cluster a density score from 0 to 100%. It then tracks how price interacts with each zone over a configurable behavior window — separating genuine structural levels from weak ones.
Zones are color-coded by density strength:
-
Red zones = Highest density (80–100%) — levels where price has repeatedly turned
-
Orange zones = High density (60–80%) — significant structural levels with active interest
-
Yellow zones = Moderate density (40–60%) — areas of some interest but less conviction
-
Blue zones = Low density (below 40%) — weak structural levels, best ignored
A level where many swings have clustered indicates genuine market attention. A level with only one or two touches is statistically less significant. This indicator quantifies that difference.
Core Logic and Calculation
The indicator begins by detecting swing points using a fractal algorithm. Each swing point represents a structural high or low where price reversed direction — these points are the foundation of all subsequent analysis.
Swings are then clustered by price proximity using an ATR-based radius. This radius adapts to market volatility, ensuring clusters are meaningful in both quiet and volatile conditions. Clusters that are too wide are rejected, as they represent broad ranges rather than specific levels.
Density is normalized by comparing each cluster to the top clusters in the current analysis window. This creates a 0 to 100 percent scale that remains consistent across different market conditions. A zone with 80 percent density has significantly more swing clustering than the reference zone, indicating strong structural importance.
Participation analysis measures how often price candles touch each zone. This is distinct from density — a zone may have many swings (high density) but rarely be visited (low participation). Such zones are less actionable.
Acceptance and rejection analysis distinguishes support from resistance. When price closes inside a zone, it indicates acceptance and suggests the zone is acting as support. When price leaves long wicks without closing inside, it indicates rejection and suggests the zone is acting as resistance.
A smoothing mechanism stabilizes the density reference across bars, preventing zone colors from flickering due to normal variations in which zones qualify as the strongest. This makes the indicator visually reliable and easier to interpret.
Key Strengths
Swing Density Analysis
Clusters swing points by price proximity using an ATR-based radius that adapts to volatility. The more swings at a level, the higher the density score — directly indicating structural significance.
Participation Tracking
Measures how often candles touch each zone as a percentage. A zone with high density but low participation is less actionable than one with high participation.
Acceptance vs Rejection
Tracks closes inside the zone as acceptance and wick rejections as rejection. This distinguishes support levels from resistance levels based on actual price behavior.
Adaptive Smoothing
Density reference is smoothed across bars to prevent color flickering, making the visual output stable and reliable.
Color-Coded Heat Map
Uses a Red to Blue intensity scale for instant visual interpretation of zone strength.
Fully Customizable
Swing strength, lookback, clustering radius, zone filtering, and behavior lookback are all adjustable.
Anchor Zones to Formation
Zones remain fixed to their structural formation period, preserving the context of their origin.
No Repainting
All calculations are based on historical data and do not change on the current bar, ensuring consistency for backtesting.
What You See on the Chart
-
Red zones represent the highest density levels, indicating the strongest structural interest
-
Orange zones represent high density levels with significant swing clustering
-
Yellow zones represent moderate density levels with some market attention
-
Blue zones represent low density levels where structural interest is minimal
-
Semi-transparent halo extends above and below each zone for rejection detection
-
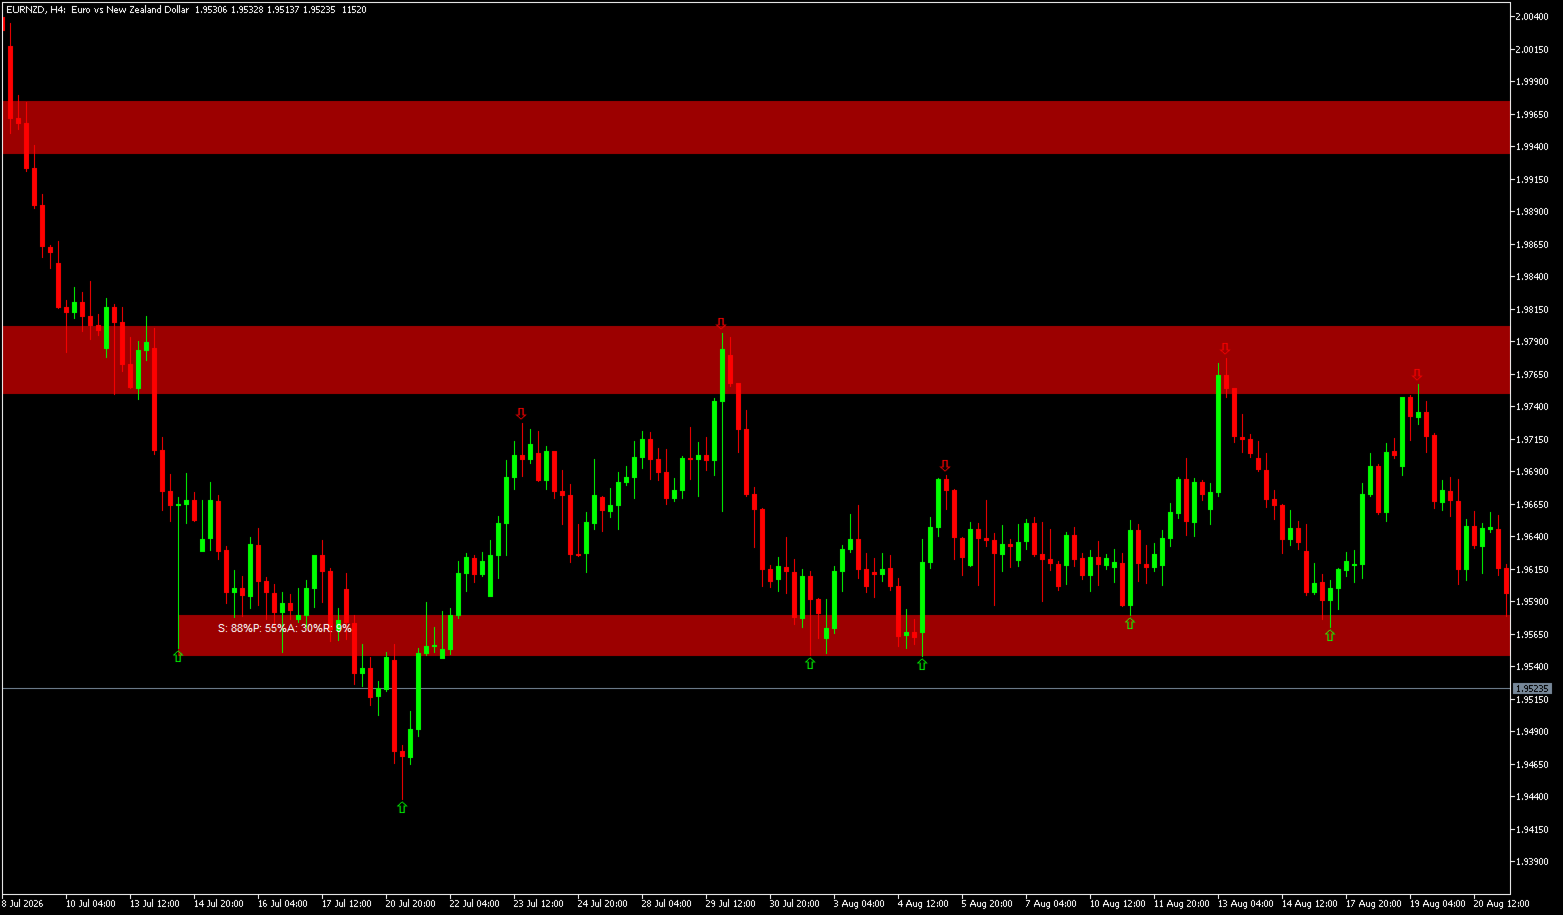
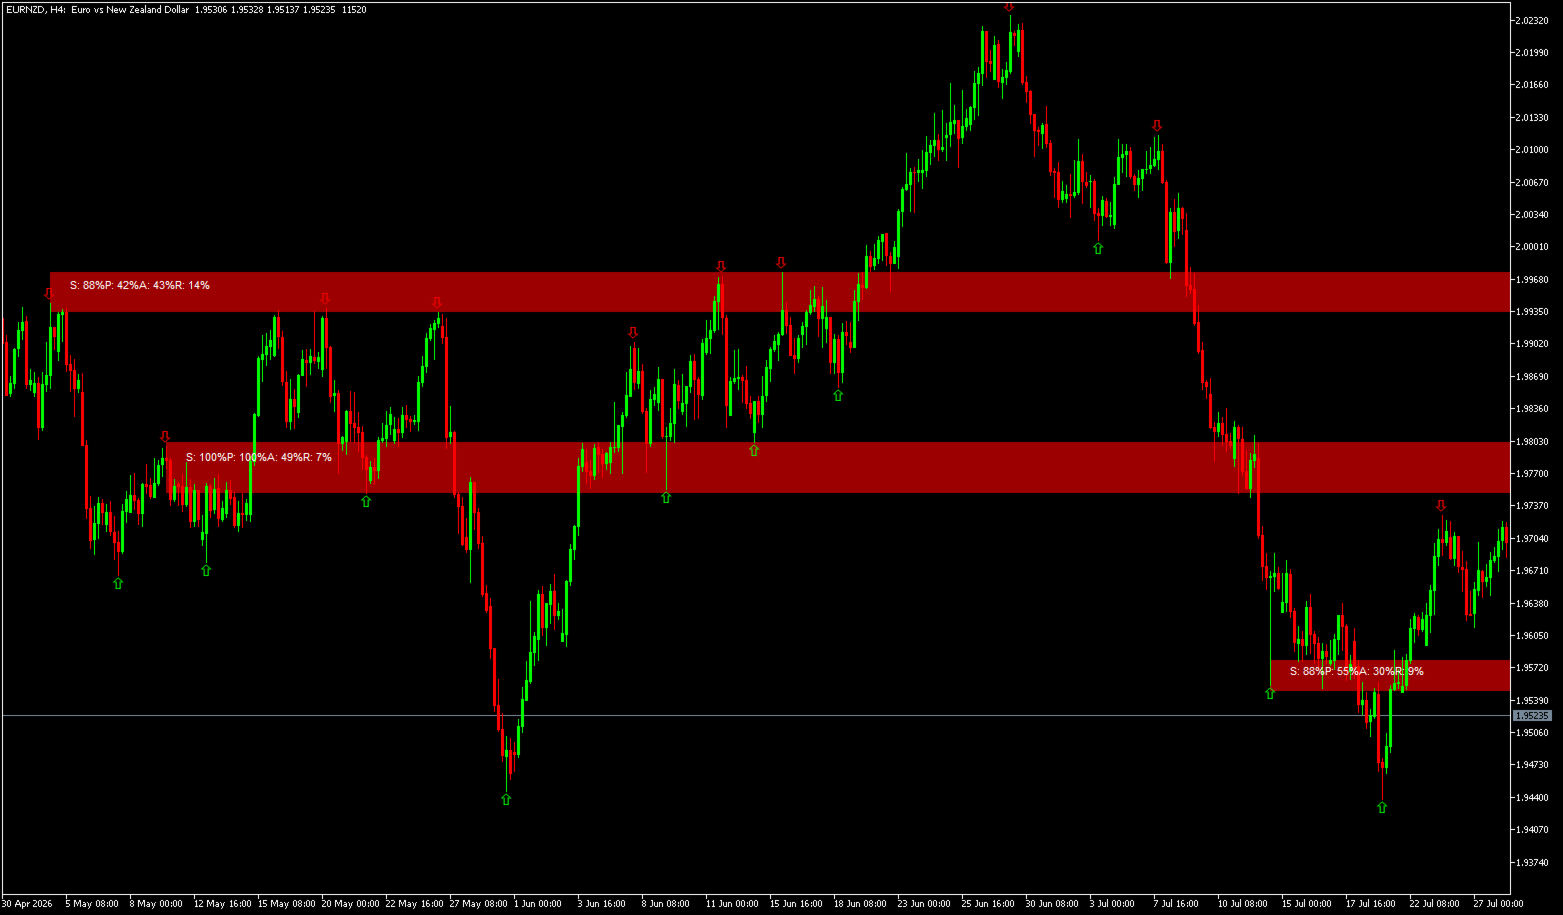
Data labels show Density percent, Participation percent, Acceptance percent, and Rejection percent
-
Swing high and low arrows can be toggled on or off
-
Zones auto-clean and redraw automatically on each new bar
How It Works
-
Detects swing points using configurable strength and lookback limits.
-
Clusters swings by price proximity using an ATR-based radius that adapts to volatility.
-
Filters clusters by compactness — rejecting zones that are too wide.
-
Assigns density scores normalized from 0 to 100 percent.
-
Analyzes price behavior around each zone to measure participation, acceptance, and rejection.
-
Draws a color-coded heat map with data labels and halo extensions.
Detailed Parameter Guide
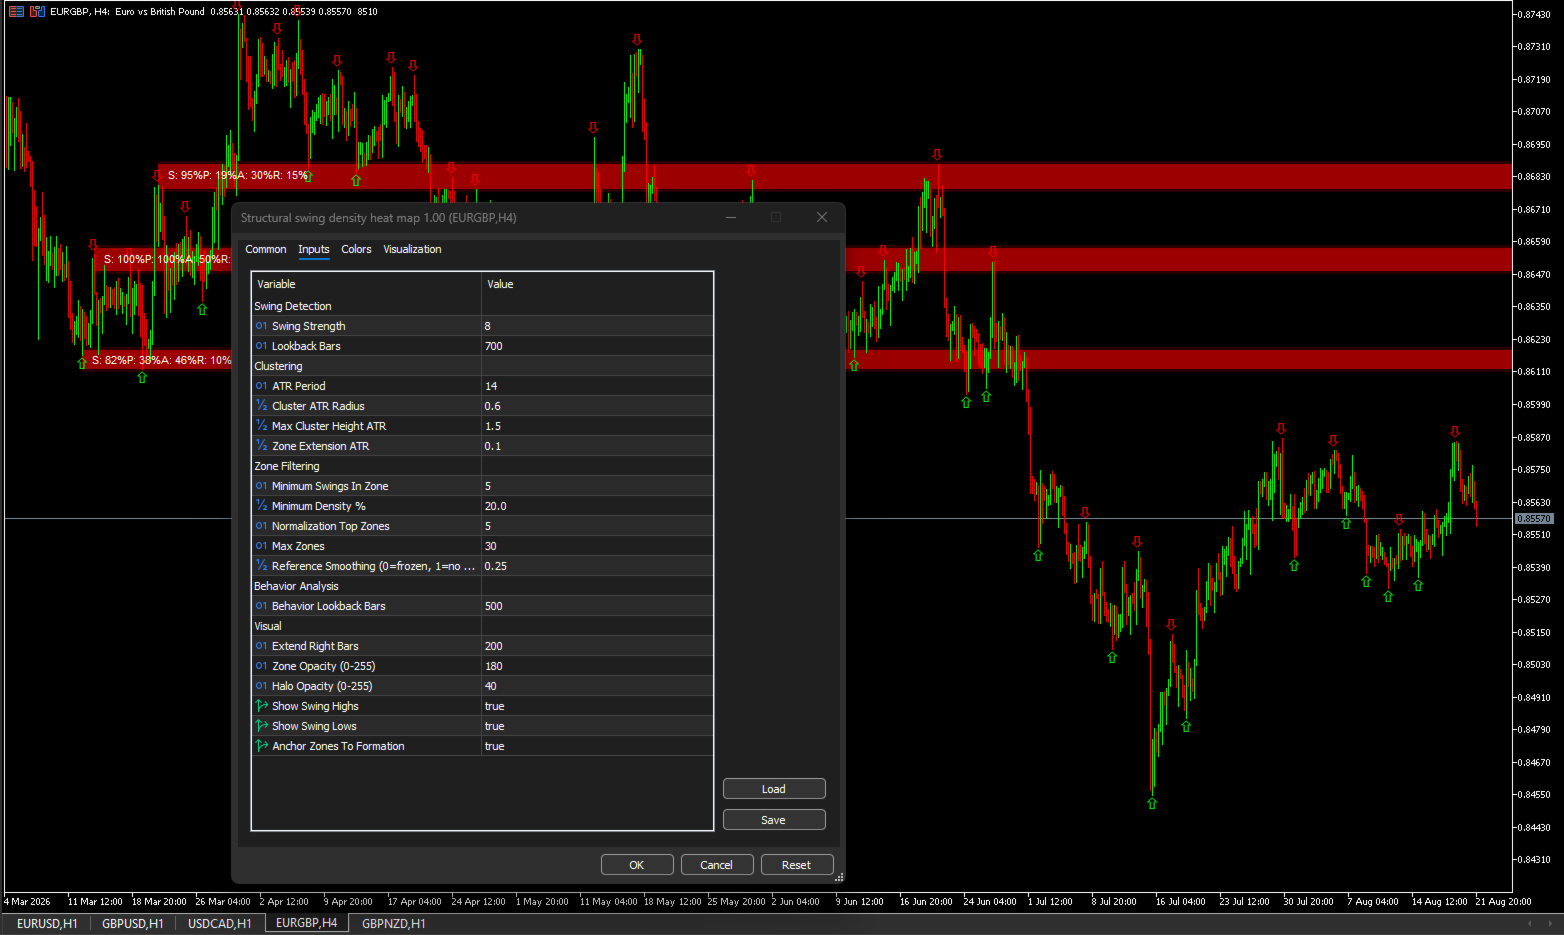
Swing Detection Parameters
Swing Strength
Controls how many bars are checked on each side of a bar to determine if it is a swing high or low. Higher values produce fewer, more significant swings by requiring more bars to confirm a turn. Lower values produce more swings, including smaller structural moves.
Default: 12 — works well on H1 charts. For M5, consider 8 to capture more movement. For H4, consider 16 to filter out minor noise. The key is finding the balance where swings represent meaningful turns rather than noise.
Lookback Bars
Limits how far back the indicator searches for swings.
Default: 1000 bars. This is a performance optimization that prevents the indicator from scanning the entire chart history. On longer timeframes like D1 or W1, you may need to increase this value. On shorter timeframes like M1 or M5, you can decrease it. The indicator will still draw zones from the lookback period; older history is ignored.
Clustering Parameters
ATR Period
Determines the period used for ATR calculation, which affects the adaptive radius for clustering.
Default: 14 — standard for volatility measurement. In volatile markets, consider a shorter period for more responsive clustering. In quiet markets, consider a longer period for more stable clustering.
Cluster ATR Radius
Determines how close swing points must be to cluster together. The value is multiplied by the current ATR. Higher values create wider clusters, capturing more swings at the cost of precision. Lower values create tighter clusters with fewer swings but greater accuracy.
Default: 1.0 × ATR. In volatile markets, consider lowering this to keep clusters tight. In quiet markets, consider raising it to capture enough swings for meaningful clusters.
Max Cluster Height ATR
Rejects clusters that are too wide. A cluster with a wide price range indicates the swings are not actually clustered at a specific level.
Default: 1.5 × ATR. Any cluster wider than this is rejected as too diffuse. This ensures zones represent genuine structural levels rather than broad ranges.
Zone Extension ATR
Controls the halo size around each zone, used for rejection detection. When price touches the halo but fails to close inside the zone, it is counted as a rejection.
Default: 0.0 (no extension). Setting this to 0.5 × ATR captures rejections that occur just outside the zone, which is valuable for identifying resistance levels.
Zone Filtering Parameters
Minimum Swings In Zone
Sets the minimum number of swings required to form a zone.
Default: 4. Zones with fewer swings are rejected as too sparse. This prevents drawing zones on isolated swings that do not represent repeated market interest.
Minimum Density Percent
Filters out weak zones. Only zones with density above this threshold are displayed.
Default: 20 percent. Increasing this value to 40 percent will show only the strongest zones, reducing chart clutter. Decreasing it to 10 percent will show more zones but include weaker ones.
Normalization Top Zones
Determines how density is normalized. The indicator takes the top N zones by swing count and averages their swing counts to create a reference.
Default: 5. This reference is used to calculate density percentages for all zones. A zone with 10 swings when the top 5 zones average 5 swings would have 200 percent density, capped at 100.
Reference Smoothing
Smooths the density reference across bars to prevent color flickering.
Default: 0.25. A value of 0 freezes the reference, preventing color changes entirely. A value of 1 uses the raw reference from each bar, allowing colors to change more freely. The default provides a good balance between stability and responsiveness.
Behavior Analysis Parameters
Behavior Lookback Bars
Controls how many bars are analyzed for participation, acceptance, and rejection.
Default: 500. Longer lookbacks provide more statistically significant behavior analysis but may include outdated price action. Shorter lookbacks focus on recent behavior but may lack sufficient data. For swing trading on H4 and above, consider 500 to 1000. For day trading on H1 and below, consider 200 to 500.
Visual Parameters
Extend Right Bars
Projects zones forward by a specified number of bars.
Default: 200. Useful for anticipating potential support and resistance levels ahead of price. Reducing this value keeps zones closer to current price.
Zone Opacity
Controls the transparency of the zone core. Range is 0 to 255, with higher values being more opaque.
Default: 180. Lower values create more transparent zones that allow price action to be seen underneath.
Halo Opacity
Controls the transparency of the halo extension.
Default: 40 — creates a subtle visual that does not obscure price action. Higher values make the halo more visible.
Show Swing Highs and Lows
Toggles the display of swing point arrows on the chart.
Default: true for both. Disabling these reduces chart clutter while preserving the zone display.
Anchor Zones To Formation
When enabled, zones remain fixed to their structural formation period rather than extending to the current bar.
Default: true — preserves the context of each zone's origin.
Practical Usage Guide
The primary use of this indicator is to identify genuine structural levels for entries, exits, and stop placement. Red zones are your strongest levels. They represent price levels where swings have repeatedly clustered, indicating institutional interest. These zones are the most reliable for support and resistance decisions.
To interpret a zone, examine the four metrics displayed in the label:
-
Density tells you how strong the zone is relative to others.
-
Participation tells you whether price actually visits the zone.
-
Acceptance tells you if price closes inside — meaning the zone acts as support.
-
Rejection tells you if price leaves long wicks — meaning the zone acts as resistance.
A high density zone with high acceptance (above 50%) is a strong support level. Price tends to hold above this zone, making it suitable for buy entries and stop placement below.
A high density zone with high rejection (above 50%) is a strong resistance level. Price tends to reverse at this zone, making it suitable for sell entries and stop placement above.
A zone with high density but low participation (below 20%) may be less reliable. The market has shown interest through swing clustering but has not recently interacted with the level. Consider waiting for a touch and reaction before trading.
A zone with low density but high participation may be a temporary area of interest rather than a structural level.
For the most reliable trades, combine high density with high participation. These are zones where price has historically fought. When price returns to a high density zone, watch for acceptance or rejection to confirm the direction. Entry can be made on rejection candles or close confirmations.
Practical Example
On a EURUSD H1 chart, you observe a red zone (density 85%) between 1.0850 and 1.0875. The label shows S:85, P:65, A:40, R:35. This indicates strong swing clustering, active participation, moderate acceptance, and moderate rejection. The zone has not shown a clear direction yet.
Price approaches the zone from above, touching the halo and leaving a long lower wick. The rejection count increases to 45%. This suggests the zone is acting as resistance. You consider a sell entry with a stop above the zone.
Alternatively, price approaches the zone from below and closes inside. The acceptance count increases to 50%. This suggests the zone is acting as support. You consider a buy entry with a stop below the zone.
Recommended Workflow
-
Attach the indicator to your chart with default settings.
-
Identify the highest density zones, shown in red and orange.
-
Check participation, acceptance, and rejection metrics for each zone.
-
Use acceptance zones as support and rejection zones as resistance.
-
Confirm with price action, such as candlestick patterns, before entering trades.
Practical Use Cases
-
Identify high-density structural zones where the strongest levels are located
-
Distinguish acceptance zones that act as support from rejection zones that act as resistance
-
Avoid low-density, low-participation areas that are unlikely to hold
-
Find structural clusters for entry and exit placement with higher probability
-
Use as confluence with trend indicators or order flow analysis
Technical Notes
-
Overlay indicator that draws directly on the price chart
-
Works on any timeframe from M1 to MN1
-
Works on any symbol including forex, commodities, indices, and crypto
-
Adaptive to volatility via ATR-based radius calculations
-
No repainting — all calculations are historical and do not change on the current bar
-
Optimized for performance with once-per-bar recalculation and configurable lookback limits
-
Compatible with MetaTrader 5
Support
Lifetime updates included. For assistance, click Developer's Profile below.
Adaptive Swing Density Heat Map — MT5 Structural Density Indicator | Swing Density Heat Map | Swing Clustering Indicator | Participation Tracking | Acceptance Rejection Analysis | Support Resistance Heat Map | ATR Adaptive Zones | Structural Levels MT5 | High Density Zones | No Repaint Heat Map | Market Structure Indicator | Swing Point Analysis | Price Cluster Indicator | MT5 Heat Map Indicator | Order Flow Alternative | Institutional Levels Indicator