Volatility Helix Engine Advanced
- Indicators
-
Nguyen Thanh Trieu
 I am a software developer and trader focused on building practical trading tools for MetaTrader 5.
My work is centered on:
- Market structure analysis
- Price action logic
- Risk visualization
- Custom indicators and utilities - Version: 1.0
- Activations: 10
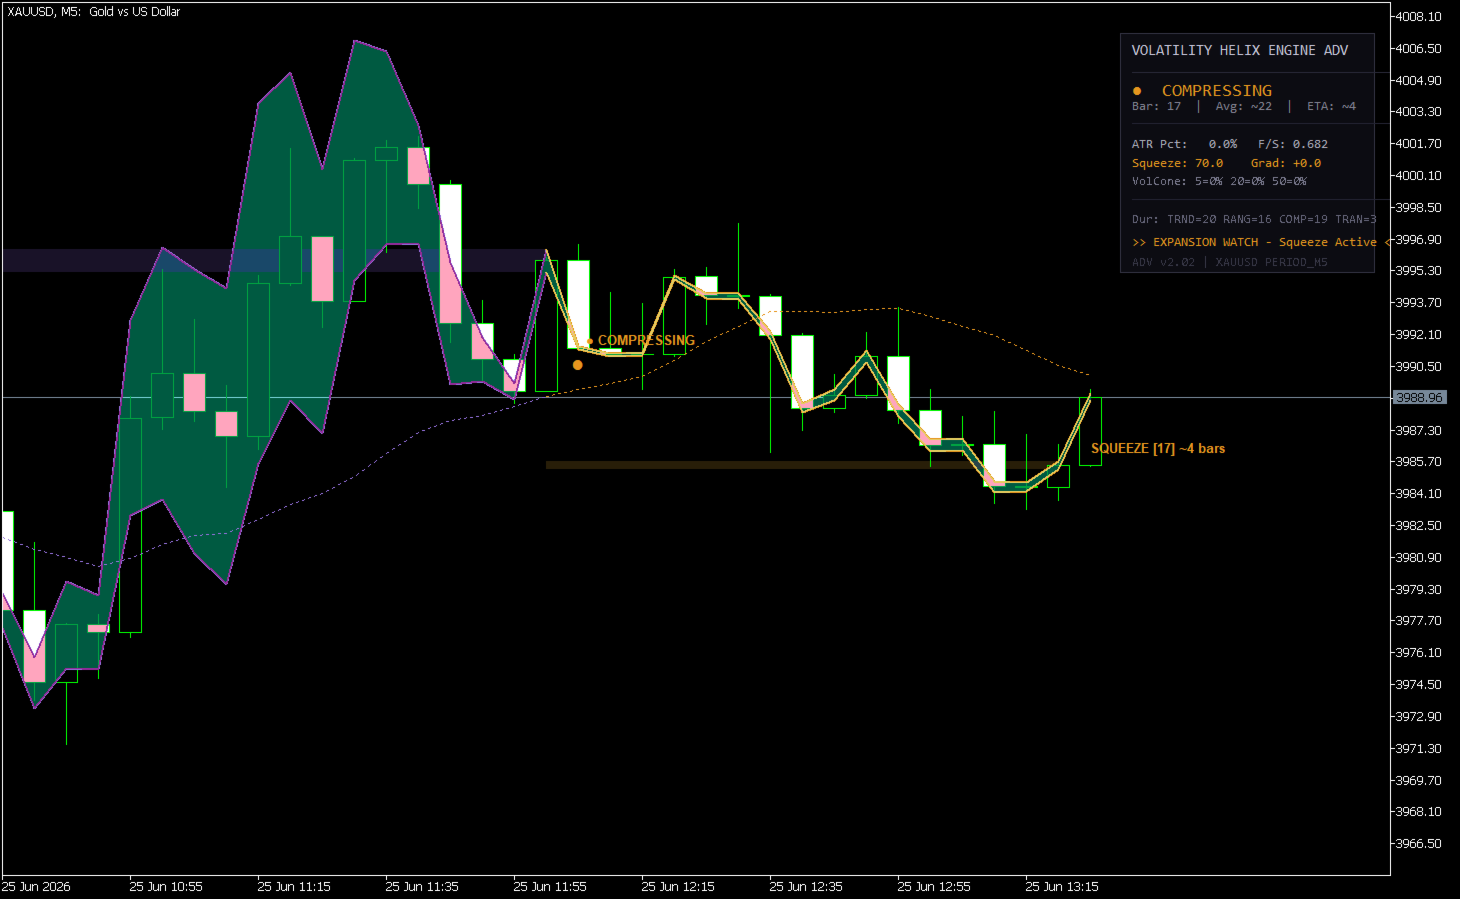
Volatility Helix Engine Advanced is a multi-factor volatility intelligence tool that classifies market states and projects expansion targets directly on the chart.
During erratic market movements, traders often struggle to distinguish between market noise, active trends, and impending breakouts. Standard tools often react too slowly, leading to entries at low-volatility extremes. This indicator addresses this by calculating volatility percentile ranks and directional consistency to map the current market structure.
What it shows:
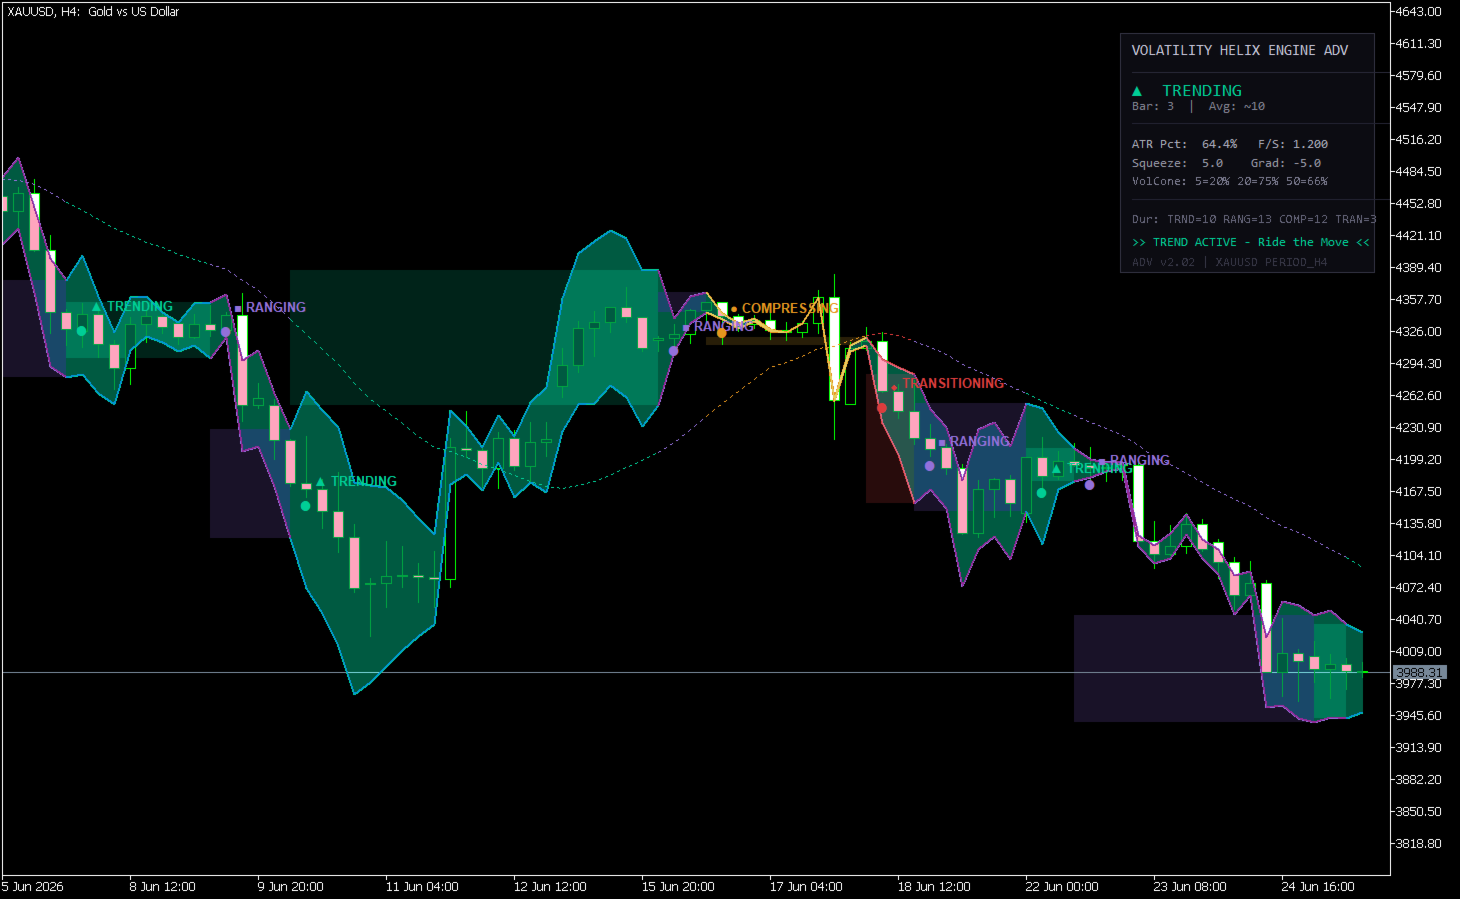
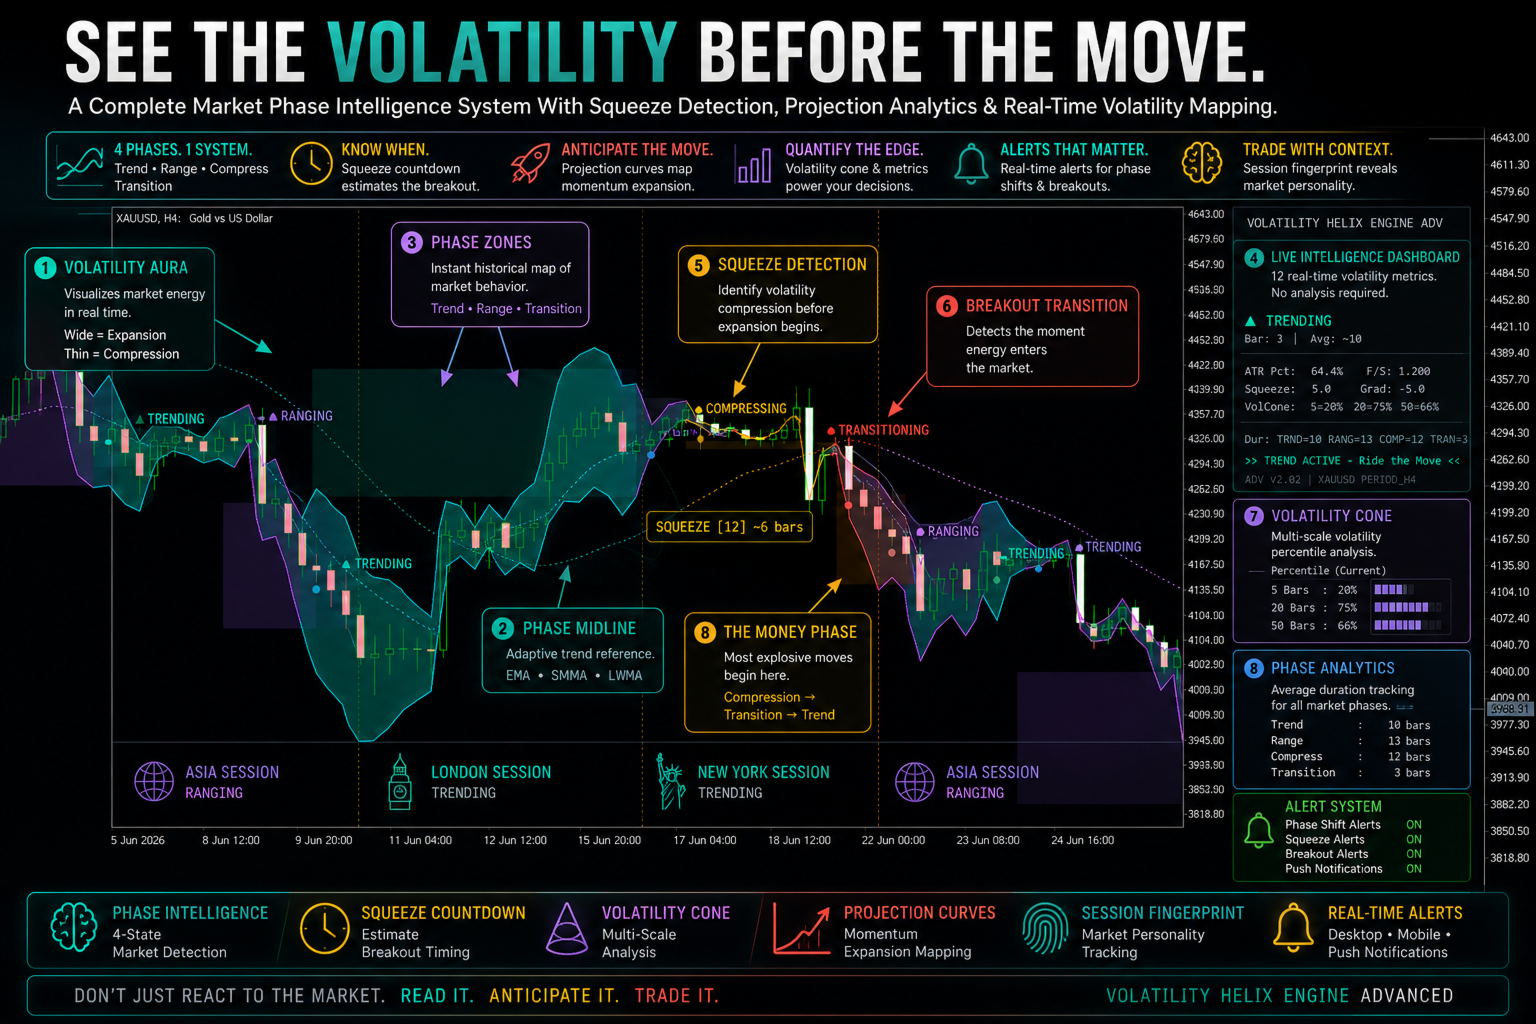
- Phase Helix Bands (Upper & Lower): High-resolution envelopes that adjust dynamically based on the current market phase and volatility density to map out the volatility range.
- Phase Aura: A semi-transparent background fill between the Helix bands that expands and contracts to show the intensity of volatility.
- Phase Midline: A customizable moving average (EMA, SMMA, or LWMA) that shifts color dynamically to reflect the dominant volatility regime.
- Phase Zone Backgrounds: Historical chart partition blocks that display the transition history of volatility regimes.
- Parabolic Projection Curves: Future pathway lines projected on volatile breakouts to outline potential expansion channels.
- Session Fingerprint Separators: Visual session boundaries (London, New York, Asia) displaying the dominant volatility phase for each session.
- Squeeze Countdown Label: Displays the current squeeze length and estimates remaining bars based on historical patterns.
How to read it:
- Teal (Trending): Highlights active, directional price movements. Suitable for trend-following strategies.
- Violet (Ranging): Indicates sideways consolidation or market chop. Useful for mean-reversion trading or avoiding low-liquidity zones.
- Amber (Compressing): Highlights volatility squeeze where price is coiled. Indicates an imminent expansion.
- Coral Red (Transitioning): Marks a breakout release as volatility expands, triggering parabolic projection channels.
Signal stability:
Market phase classification and historical zones are debounced over a user-defined number of bars to filter out noise, finalising on bar close. Current projections adjust dynamically with live volatility changes on the active bar until it closes.
Best fit:
Intraday and swing trading across major Forex pairs, indices, and volatile digital assets. Compatible with M1 to D1 charts.
What it does NOT do:
- It does not generate trade signals or auto-execute orders.
- It does not guarantee market direction or breakout success.
- It serves only as a visual tool to help analyze volatility regimes.
Core settings:
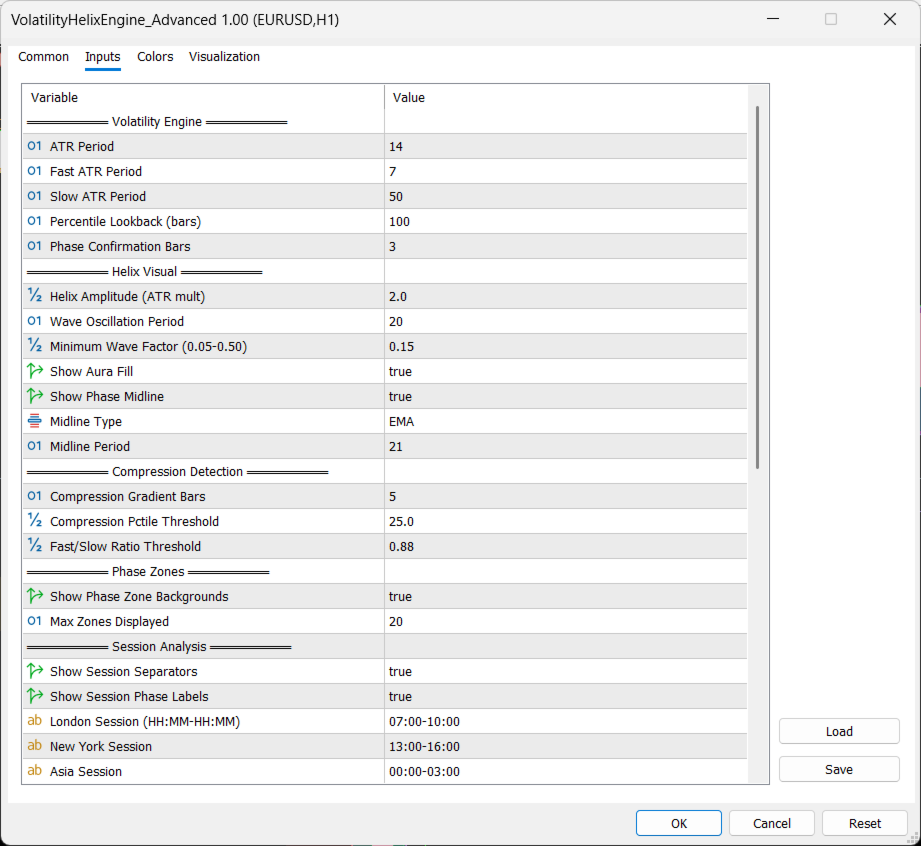
- Volatility Engine: Set ATR and multi-scale period parameters for percentile rank lookbacks.
- Helix Visuals: Customize amplitude multipliers, wave oscillation, and midline types.
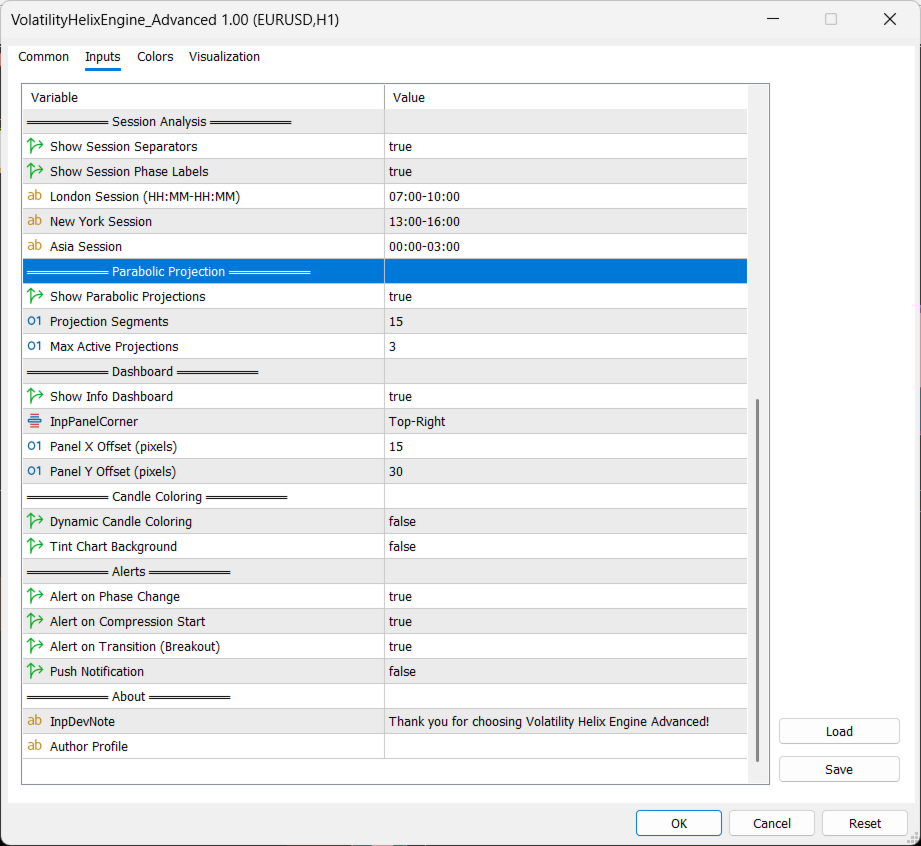
- Compression Detection: Configure percentile thresholds and gradient parameters for squeeze alerts.
- Dashboard: Toggle the on-screen dashboard and adjust its corner position on the chart.
- Alerts: Enable sound, pop-up, or push notifications for phase changes and squeeze streaks.
For support, please visit my MQL5 profile.