VibeFox MACD
- Indicators
- Version: 1.10
- Updated: 2 July 2026
- Activations: 5

VibeFox MACD — momentum, crossings and entry signals on one panel
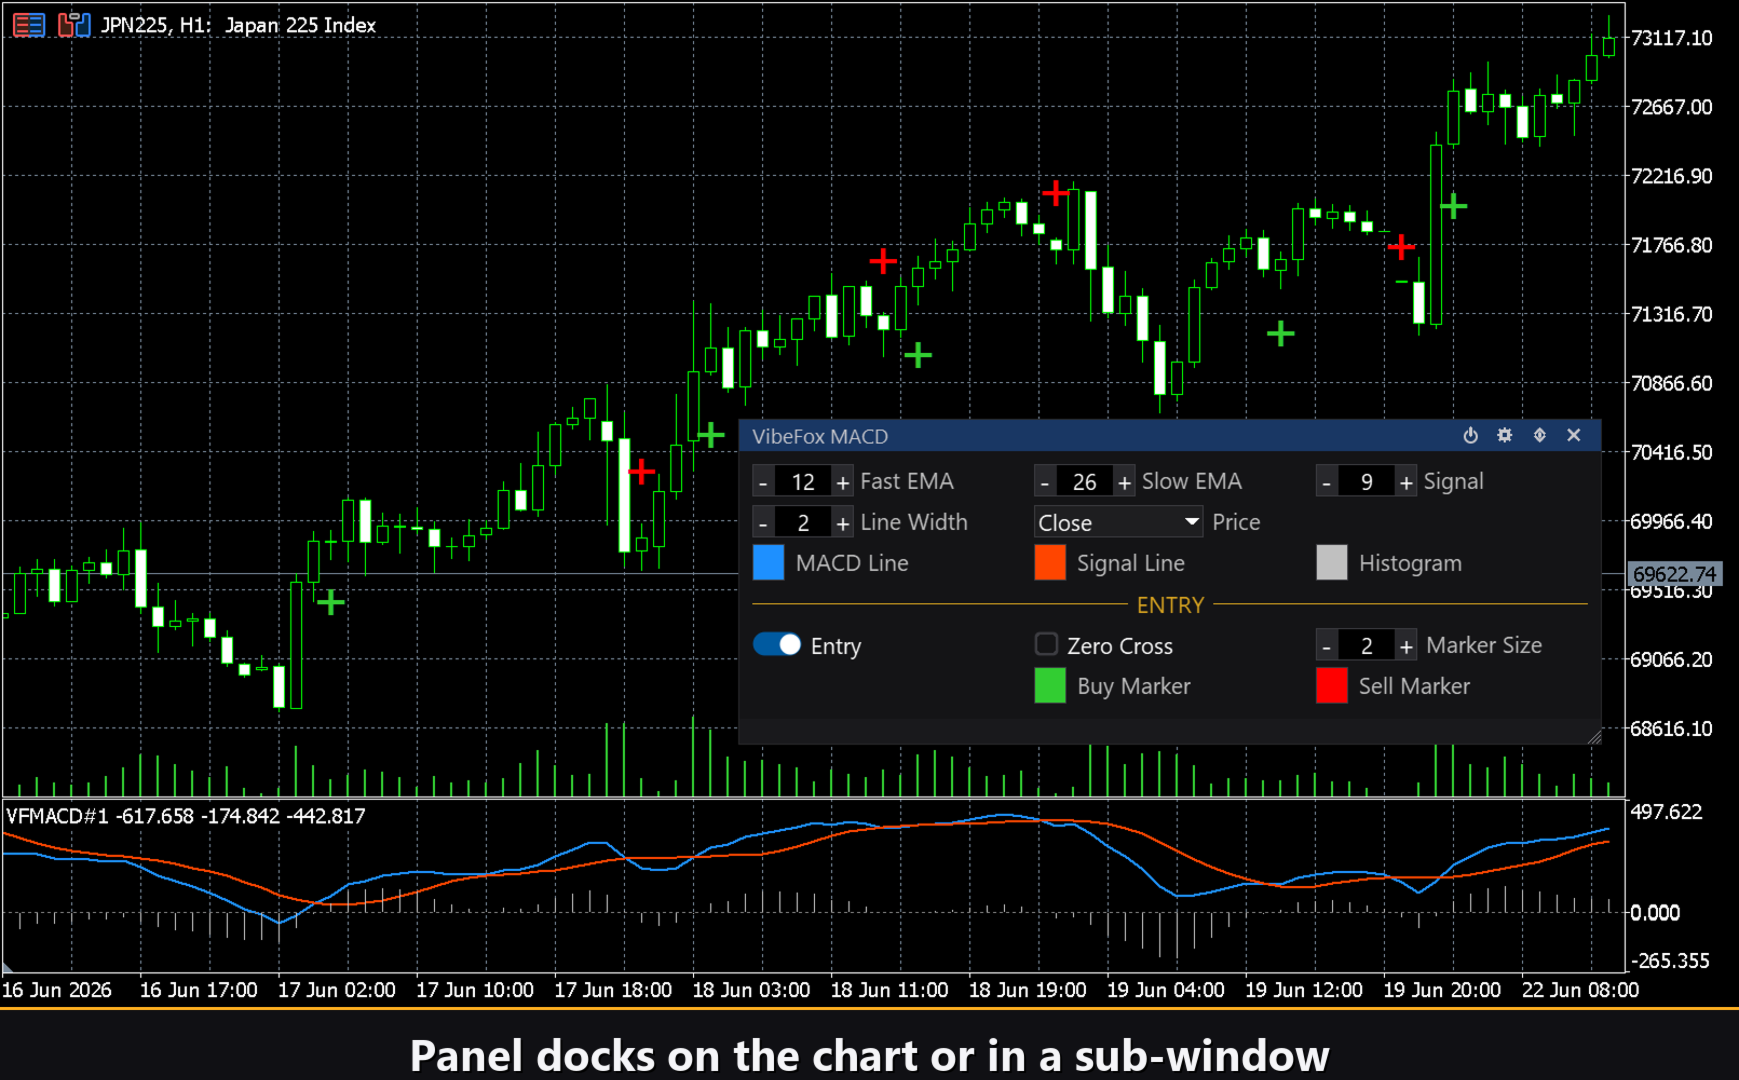
VibeFox MACD is a full-featured Moving Average Convergence/Divergence indicator for MetaTrader 5. It draws the classic trio — MACD line, Signal line and Histogram — in a dedicated subwindow, marks every entry signal with an arrow directly on the price chart, and brings every control into one smooth, canvas-based panel. You get the complete picture of momentum, its direction and its turning points the moment they form — without having to eyeball line relationships or count bars manually.
What MACD measures and how it is built
MACD is the distance between two exponential moving averages calculated on the same price series. The fast EMA (default period 12) reacts quickly to price moves; the slow EMA (default period 26) absorbs short-term noise. Their difference is the MACD line: when it rises above zero, buyers are gaining speed relative to sellers; when it drops below zero, sellers have the edge. A Signal line — an SMA of the MACD itself (default period 9) — smooths the MACD further and creates a reference that crossings can be judged against. The Histogram is the gap between MACD and Signal at every bar, so you can see at a glance whether momentum is accelerating or fading even before a full crossover arrives. A dotted zero line is automatically drawn in the subwindow as a visual anchor.
Entry points
VibeFox MACD detects crossings automatically and places a clearly colored arrow on the price chart at the bar where the signal forms. Two independent entry types can be switched on or off at any time.
Entry — Signal Cross (MACD x Signal)
The primary entry fires when the MACD line crosses the Signal line. A cross from below produces a BUY arrow; a cross from above produces a SELL arrow. This classic crossover captures momentum shifts early, often well before a full zero-line cross confirms the trend.
Zero Cross (MACD x 0)
The second entry fires when the MACD line crosses the zero level. An upward breach signals that the fast EMA has overtaken the slow EMA — buyers are now structurally dominant — and a BUY arrow is placed. A downward breach does the opposite and places a SELL arrow. Zero-line crossings are slower than signal crossings but carry a firmer confirmation of trend direction.
Both types can run simultaneously. Buy and sell arrows have individually configurable colors via Buy Marker Color and Sell Marker Color, and Marker Size scales arrows from 1 to 5 to suit any chart density.
Full visual control
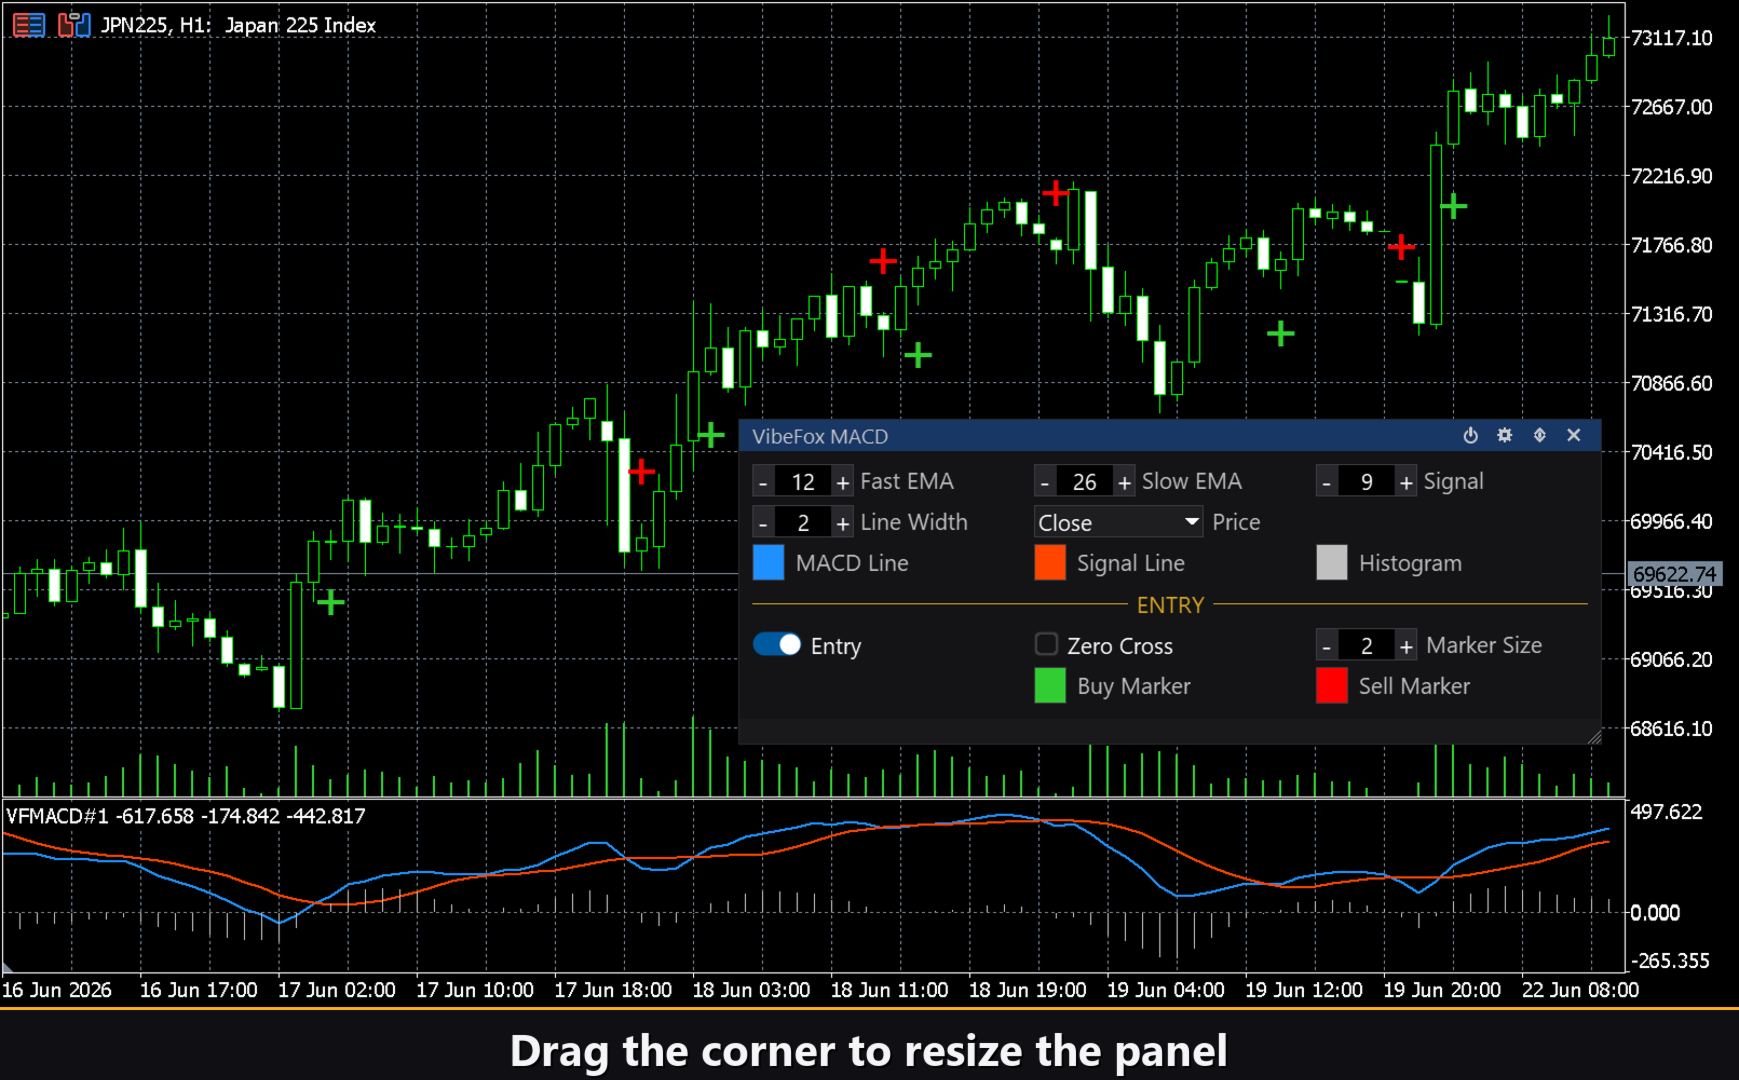
Every element of the subwindow is independently styled. The MACD Line Color and Signal Line Color each carry their own transparency slider, so you can fade one into the background while the other pops. Histogram Color and its transparency work the same way, letting the bars whisper or shout depending on how prominently you want momentum acceleration displayed. A single Line Width control (1 to 5 pixels) scales both MACD and Signal lines together so the chart stays consistent at any zoom level. The Applied Price selector lets you compute MACD on Close, Open, High, Low, Median, Typical or Weighted price — useful when you want MACD to reflect the full candle range rather than just the close.
Interactive on-chart panel
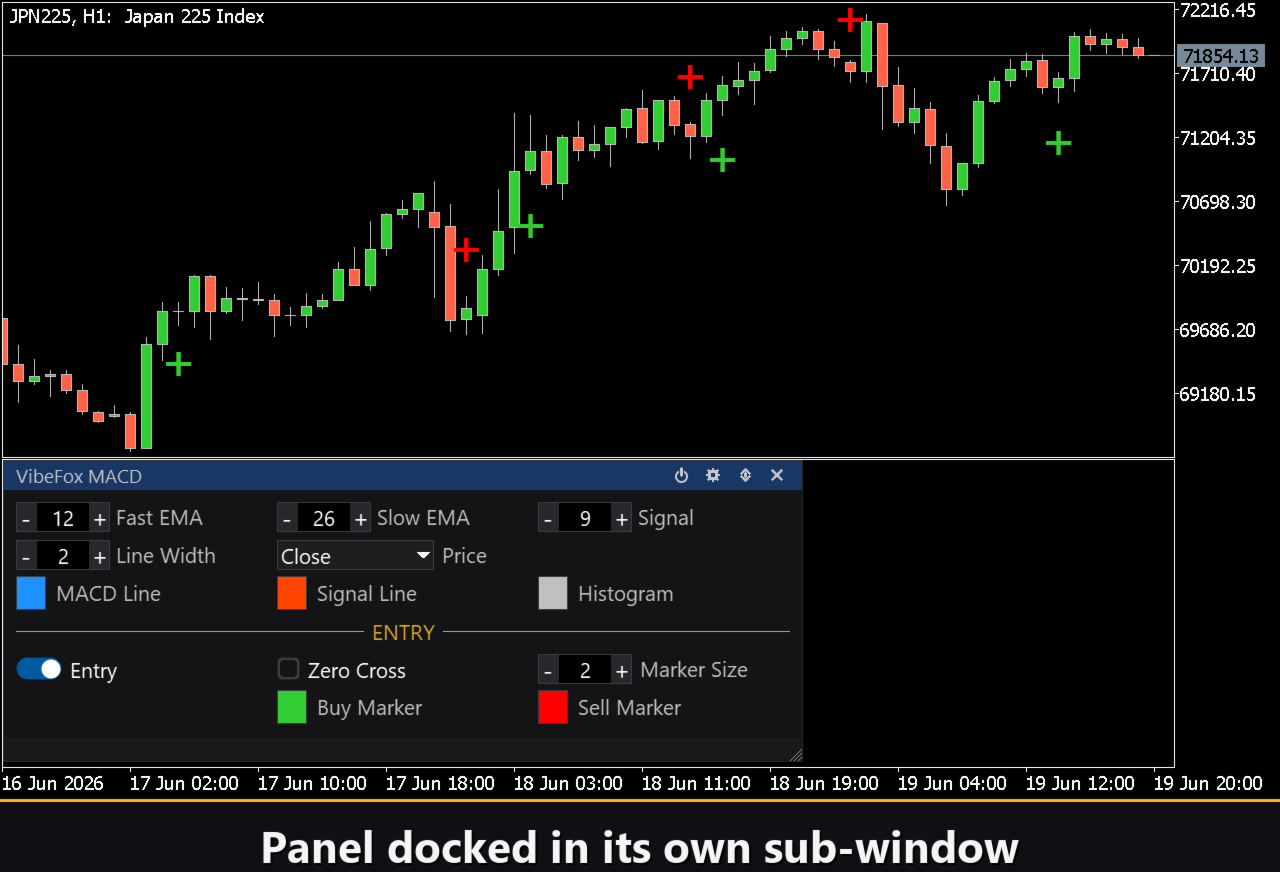
The entire interface lives in a smooth canvas panel designed for quick mouse-driven adjustment. All parameters are grouped into clean rows arranged in three columns, with the entry controls in a dedicated gold-labeled section so signal settings never get mixed up with line appearance. Panel controls are available in the title bar.
Power — enables and disables drawing of lines and entry arrows without removing the indicator from the chart.
Settings (gear icon) — opens and closes the settings panel.
Updown (arrows) — moves the panel between the subwindow and the main chart.
Close (X) — removes the indicator from the chart.
Resizable — drag the bottom-right corner to resize the panel to any width or height.
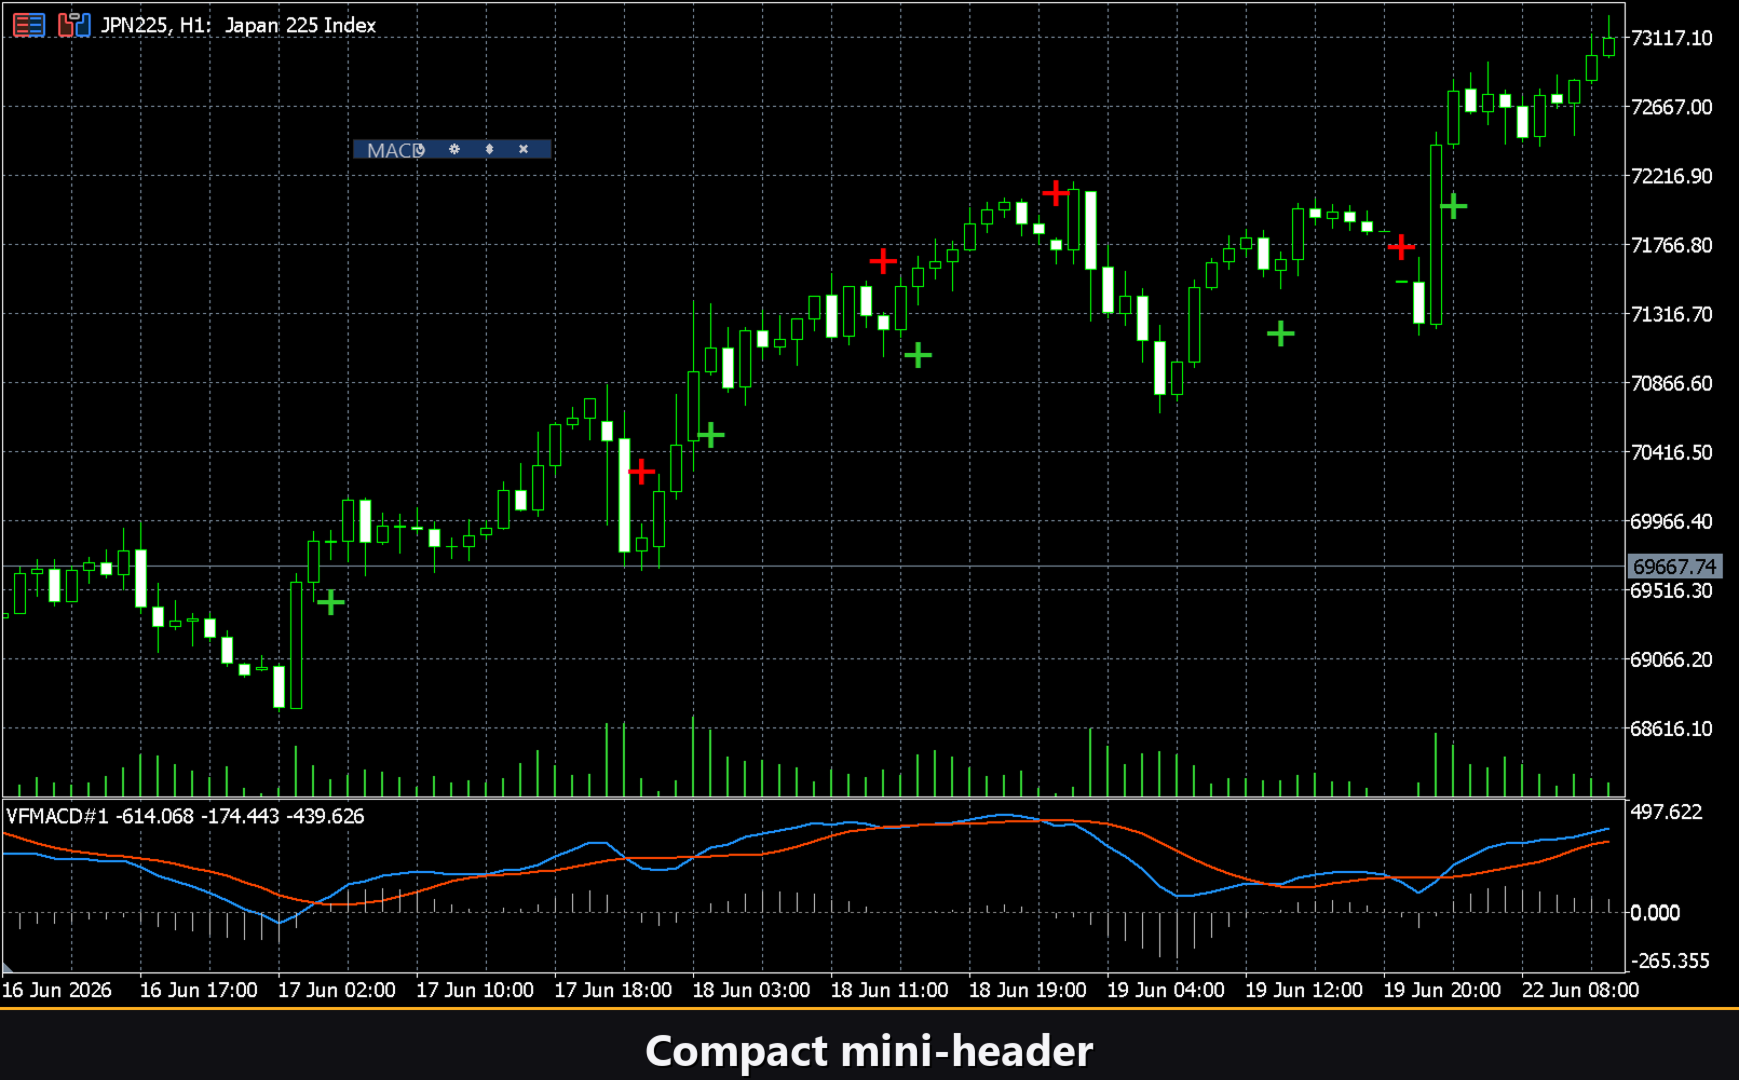
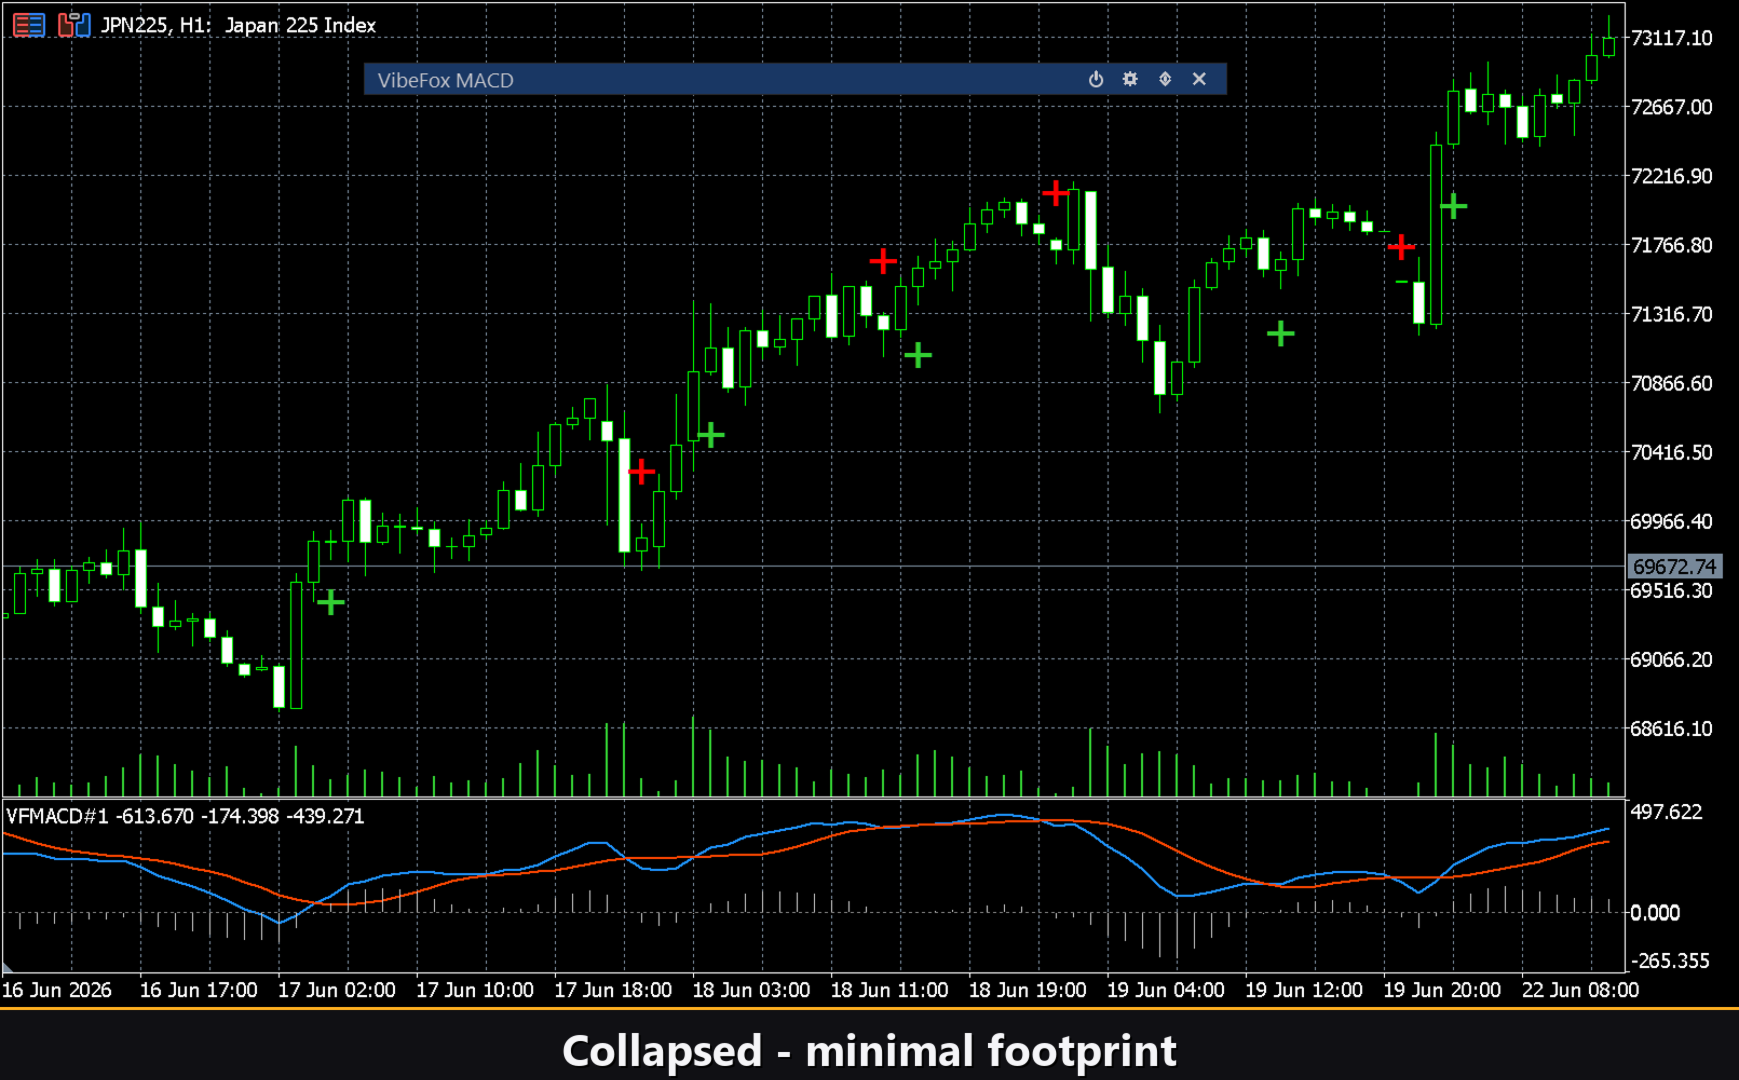
Collapsible — double-click the title bar to collapse the panel into a compact strip.
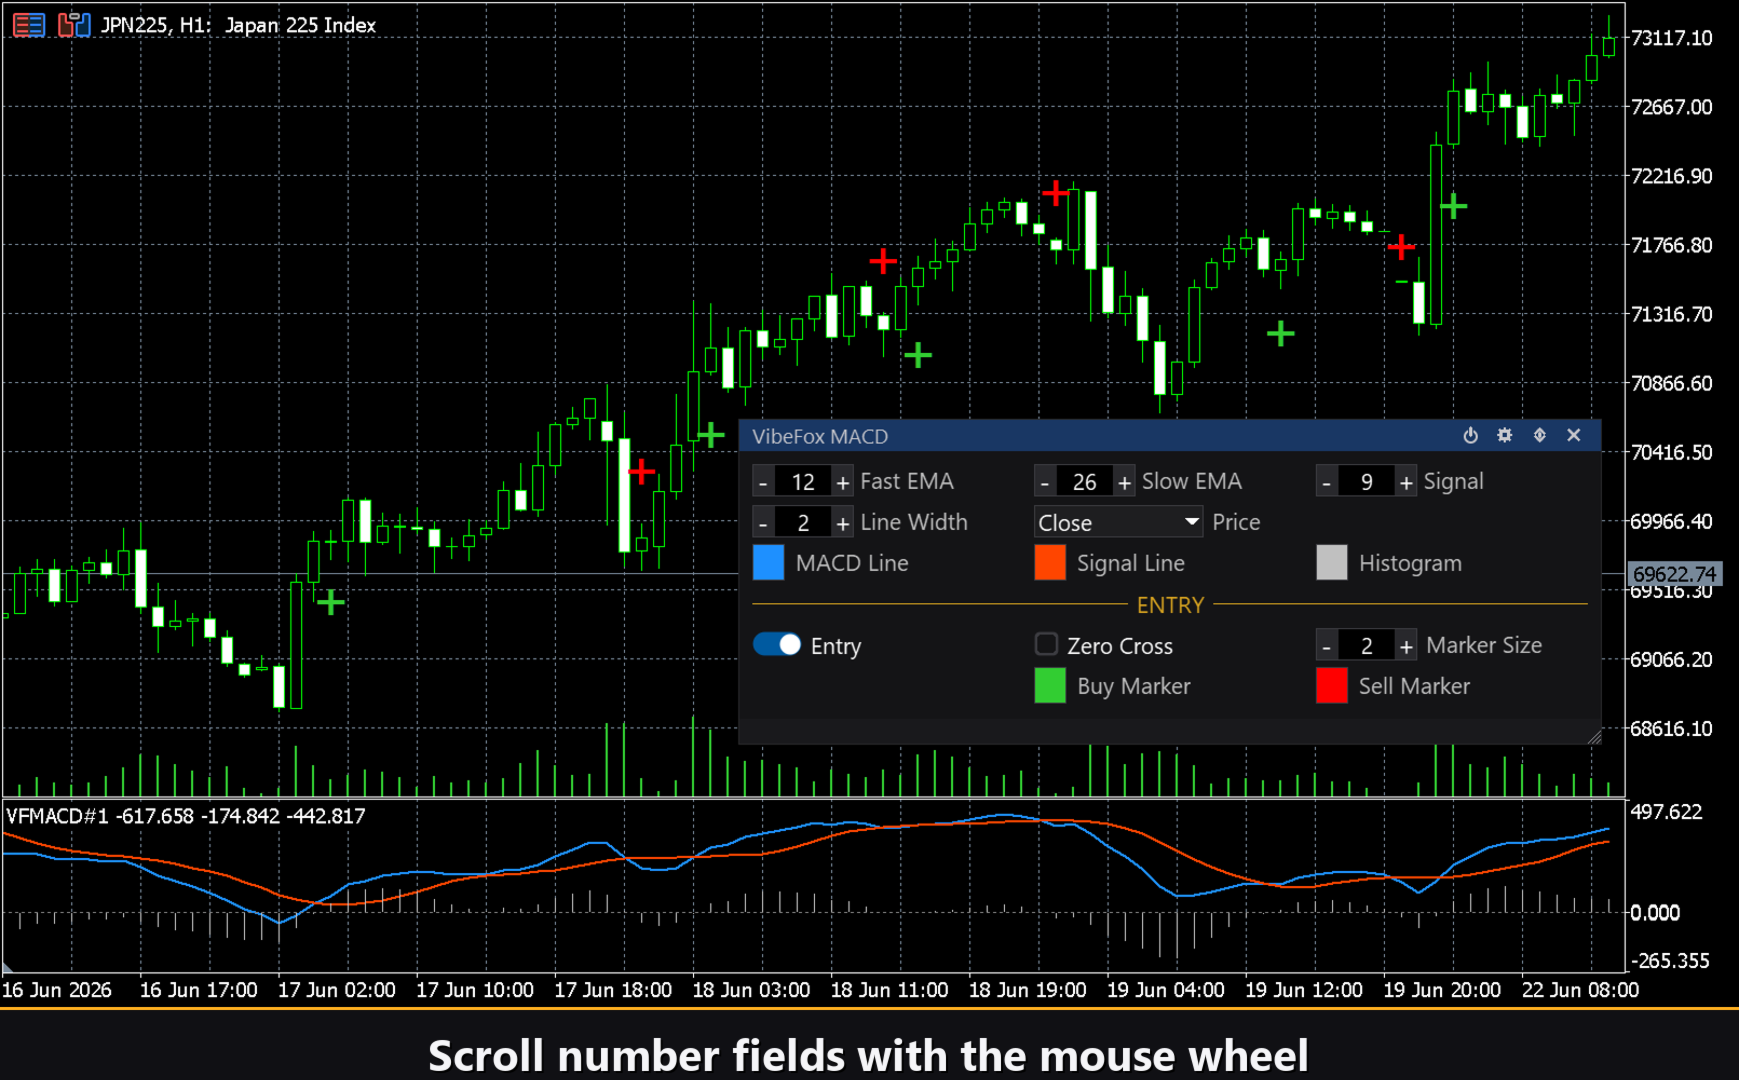
Mouse wheel — hover over any numeric field and scroll the wheel to change its value without touching the keyboard.
Settings and personalization
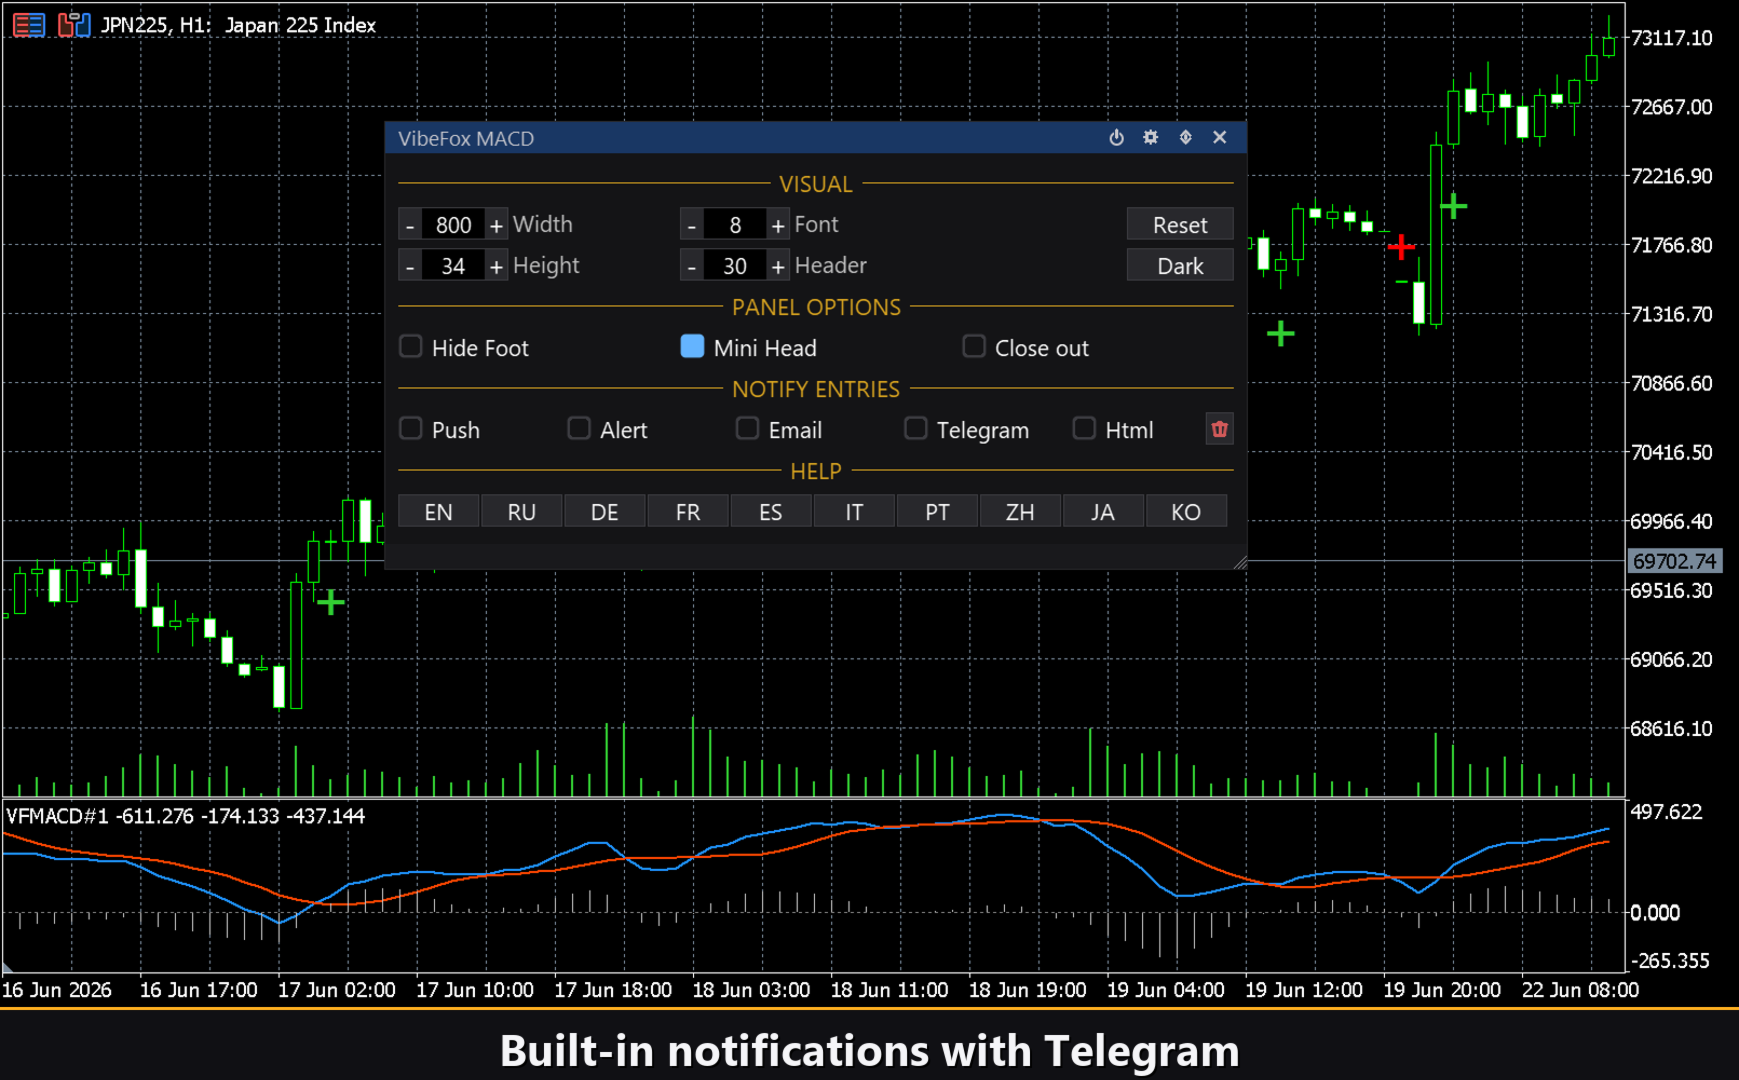
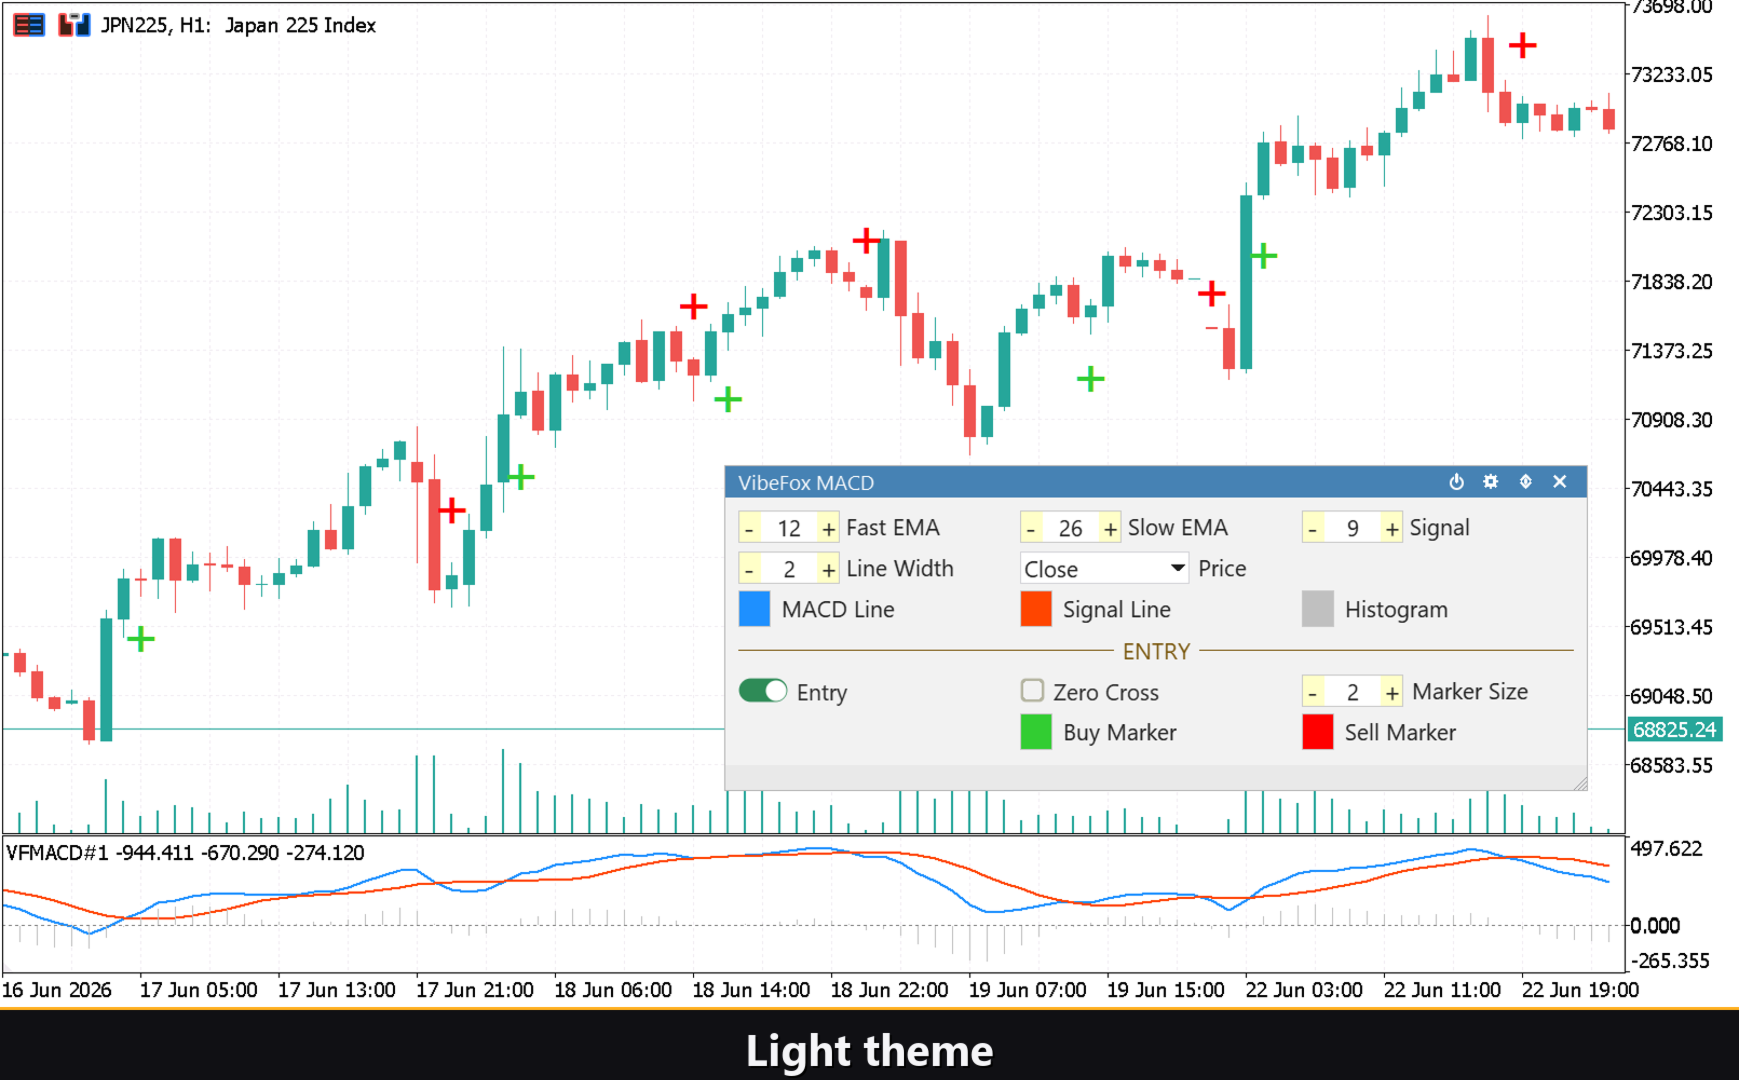
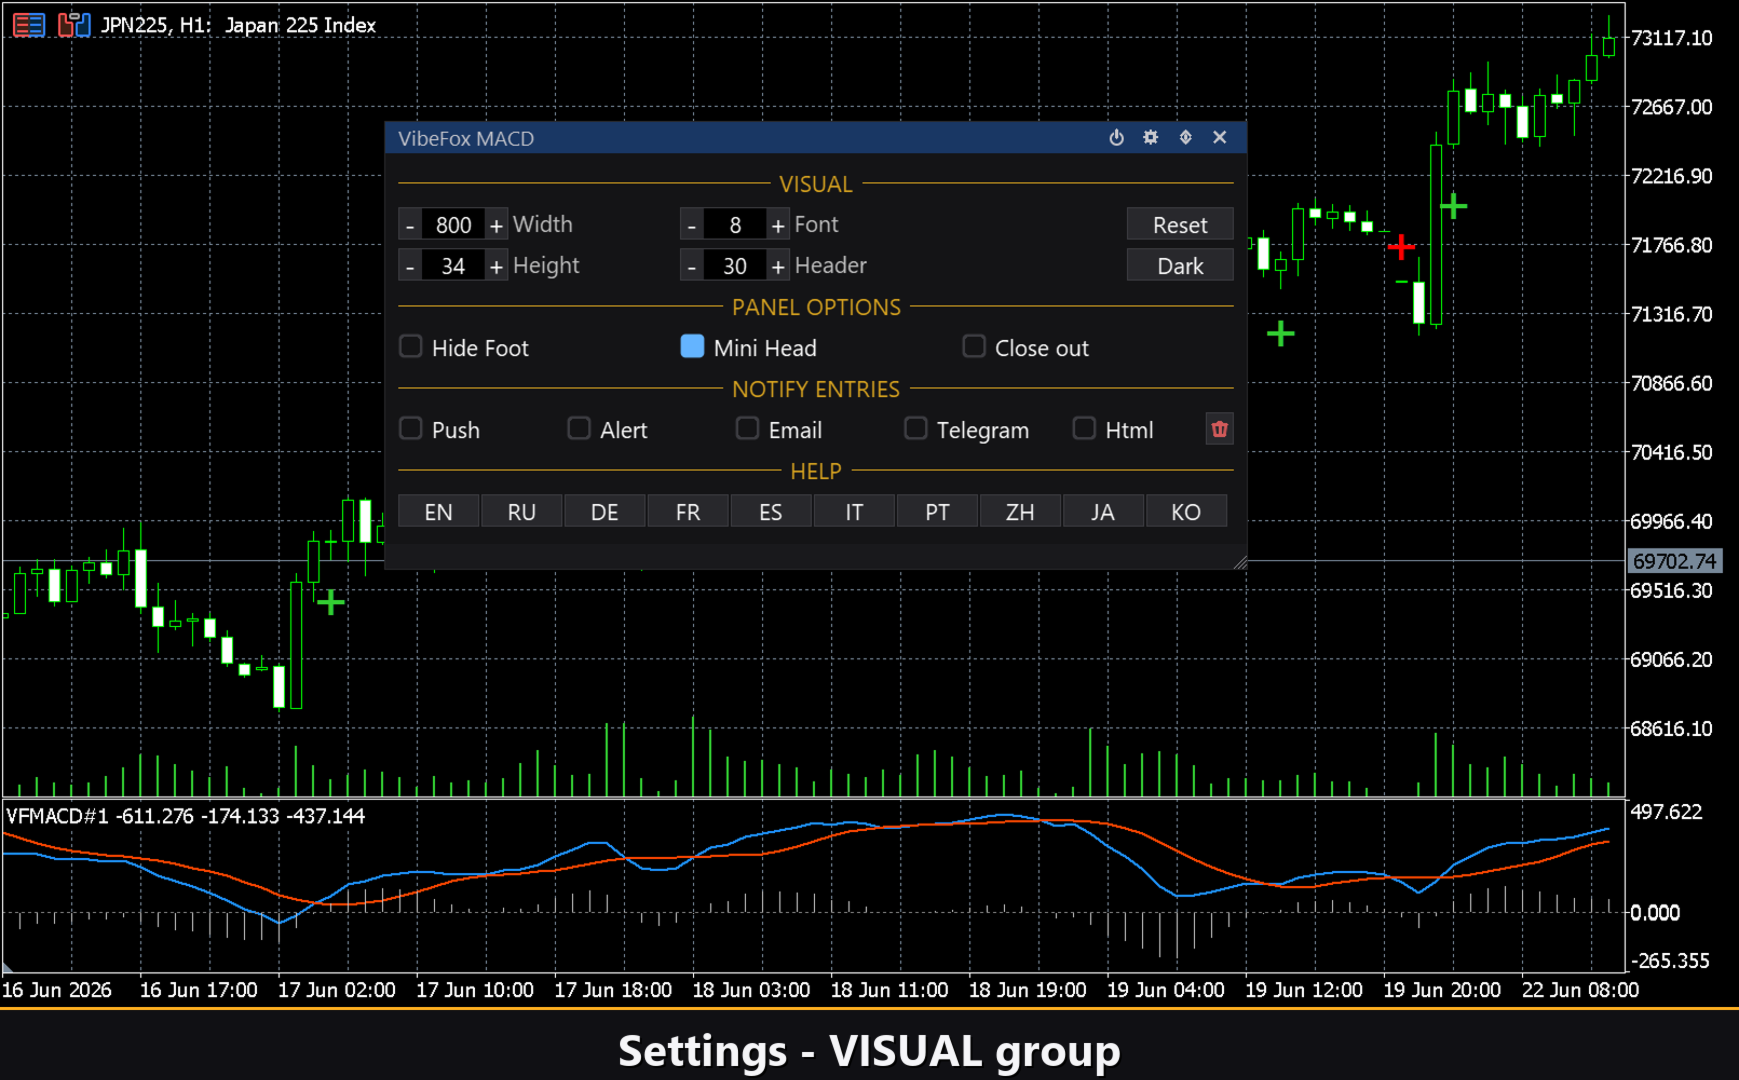
The Settings button opens the customization section where the panel is tuned to your workspace: a light, dark or automatic Theme that detects the chart's background, configurable panel width, header size, row height and font size. Extra touches include Hide Footer to strip the bottom bar, Mini Header to keep a slimmed-down strip when collapsed, and Close on click outside to auto-collapse when focus moves away. Nearly every parameter can be changed live directly on the panel — the Inputs tab values are only starting values applied at launch. You can also run multiple independent copies on the same chart by giving each a unique Instance number, making it straightforward to compare different period combinations side by side. Panel Start Window controls whether the panel opens in the subwindow or on the main chart from the first moment.
Entry notifications
You do not need to watch the chart waiting for a signal. Each entry can be broadcast across multiple notification channels, enabled independently inside the panel.
Alert — a pop-up message inside the terminal at the moment the signal appears.
Push — a mobile notification sent to the MetaTrader app on your phone.
Email — a message sent through the terminal's email settings.
Telegram — the alert text together with a chart screenshot, sent straight to your Telegram chat.
Enable only the channels you need, and you will be notified the instant a new entry forms on the symbol and timeframe you are monitoring.
Visual history (Html report)
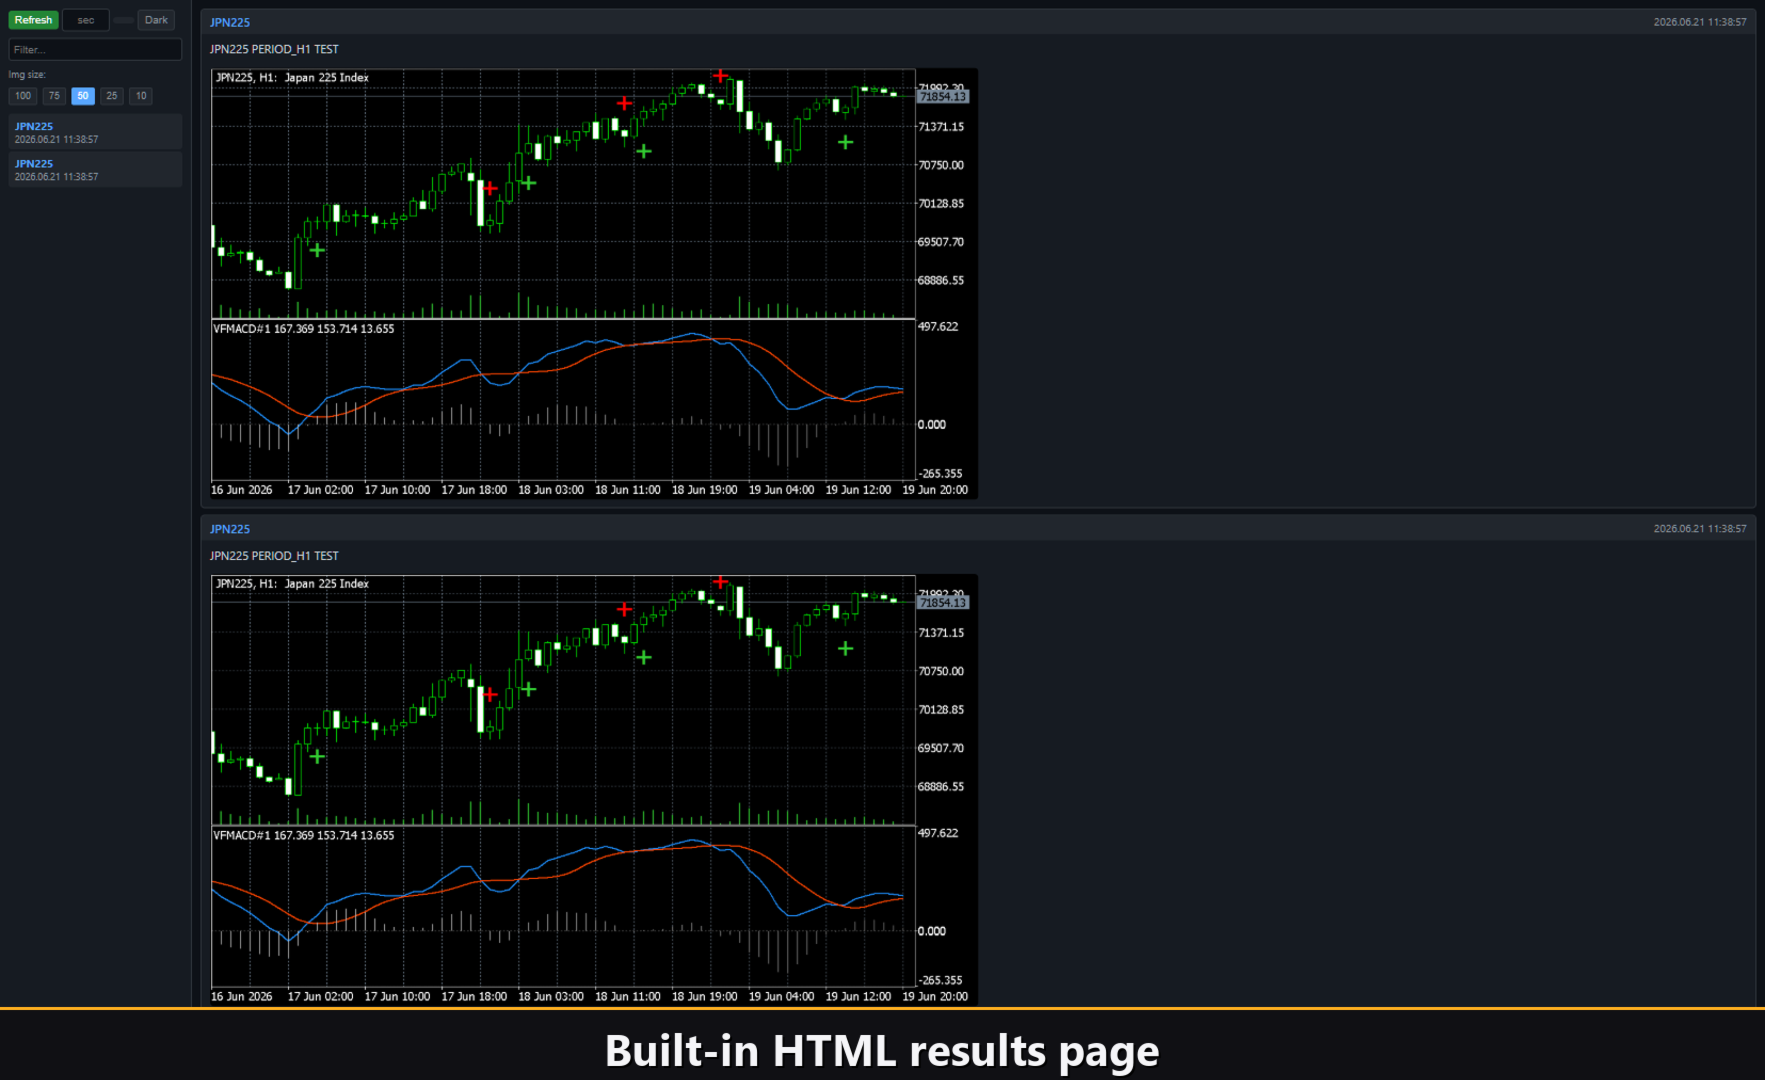
Enable the Html channel and every entry signal is saved to an HTML report together with a screenshot of the chart at the moment it fired. The report is stored in the terminal's Files folder under VibeFox_MACD and opens in any browser — a visual journal of every signal the indicator found. The trash-bin button in the panel clears the report and its screenshots in one click whenever you want a clean slate.
Telegram Alerts
Signals can also be delivered straight to your Telegram chat — the alert text together with a screenshot of the chart at the moment of detection. Turn on the Telegram channel and enter your bot token and chat id in the inputs.
Delivery rides on the HTML report: each new signal is written into the report, and the report — opened in a browser — forwards it to your Telegram chat on its own. For this reason, enabling Telegram automatically keeps the Html report on, and the two channels work together.
Built-in multilingual help
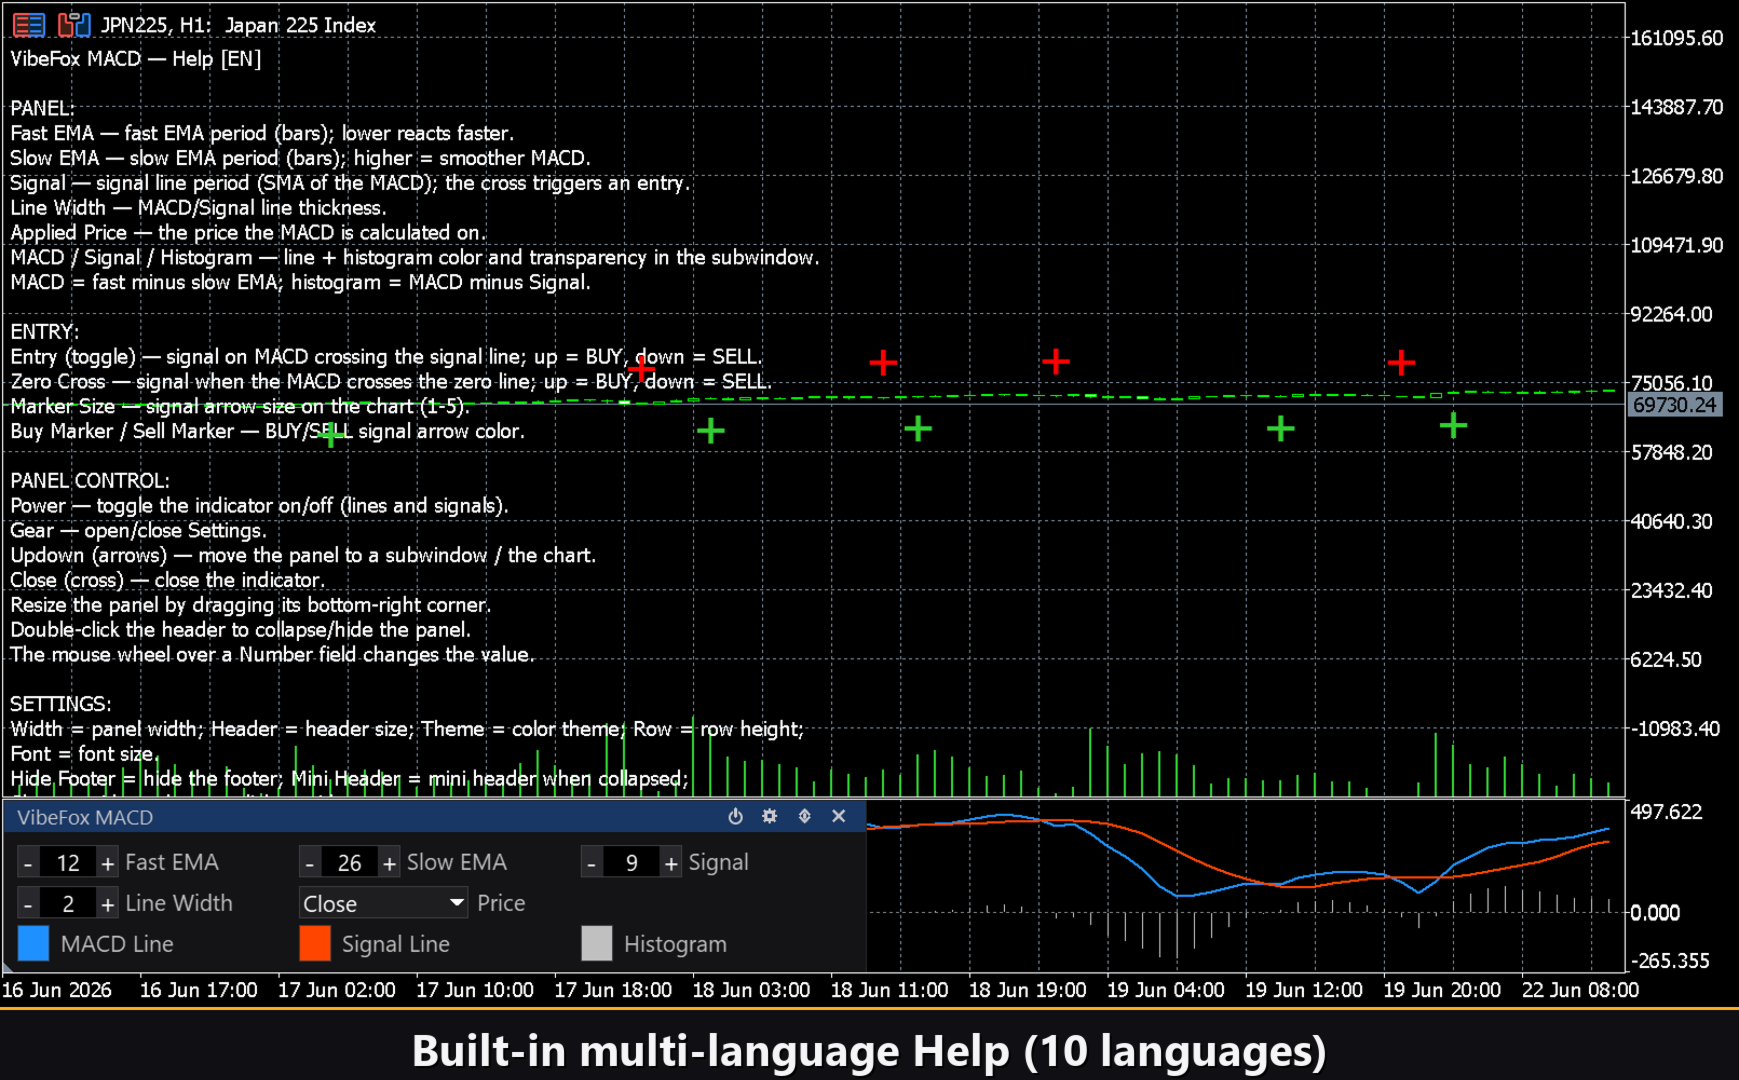
A complete help page is built into the panel, available in 10 languages, so every control is explained right where you use it.
Inputs (Inputs tab)
Most settings can also be changed live directly on the panel (Settings button) — the input parameters set only the initial values at launch.
MACD
Fast EMA Period — period of the fast exponential moving average in bars. Default: 12.
Slow EMA Period — period of the slow exponential moving average in bars. Default: 26.
Signal Period — period of the Signal line (SMA of the MACD line). Default: 9.
Applied Price — price type used for MACD calculation: Close, Open, High, Low, Median, Typical or Weighted. Default: Close.
MACD Line Color — color of the MACD line in the subwindow. Default: DodgerBlue.
MACD Line Transparency (0-100) — transparency of the MACD line; 0 = opaque, 100 = invisible. Default: 0.
Signal Line Color — color of the Signal line. Default: OrangeRed.
Signal Line Transparency (0-100) — transparency of the Signal line; 0 = opaque. Default: 0.
Histogram Color — color of the Histogram bars. Default: Silver.
Histogram Transparency (0-100) — transparency of the Histogram; 0 = opaque. Default: 0.
Line Width (1-5) — thickness of the MACD and Signal lines in pixels. Default: 2.
Entry Points
Entry = Signal Cross (MACD x Signal) — entry signal on MACD crossing the Signal line; cross upward = BUY, cross downward = SELL. Default: on.
Zero Cross (MACD x 0) — entry signal when MACD crosses the zero line; upward = BUY, downward = SELL. Default: off.
Marker Size (1-5) — size of the entry arrow on the price chart. Default: 2.
Buy Marker Color — color of the BUY entry arrow. Default: LimeGreen.
Buy Marker Transparency (0-100) — transparency of the buy arrow; 0 = opaque. Default: 0.
Sell Marker Color — color of the SELL entry arrow. Default: Red.
Sell Marker Transparency (0-100) — transparency of the sell arrow; 0 = opaque. Default: 0.
Notifications
Push Notification — push notification to the mobile MetaTrader app. Default: off.
Alert Popup — pop-up Alert dialog inside the terminal. Default: off.
Email — email sent via the terminal's email settings. Default: off.
Html Report — saves each entry signal with a chart screenshot to an HTML report (Files folder, VibeFox_MACD subfolder), viewable in any browser. Default: off.
Telegram — send each signal to your Telegram chat (alert text plus a chart screenshot) through the HTML report. Default: off.
Telegram bot token — the token of your Telegram bot, used to send the messages.
Telegram chat id — the id of the Telegram chat that receives the signals.
Panel / Settings
Panel width, px — width of the panel in pixels, range 300..800. Default: 800.
Header size — height of the panel header, range 1..6. Default: 1.
Theme — color theme: Auto (follows chart background), Dark or Light. Default: Auto.
Row height (px) — height of each panel row in pixels. Default: 34.
Font size — font size used in the panel. Default: 8.
Hide Footer — hide the bottom bar of the panel. Default: off.
Mini Header on collapse — show a compact header when the panel is collapsed. Default: off.
Close on click outside — auto-collapse the panel when clicking outside it. Default: off.
Instance — instance number; set a unique value for each copy of the indicator on the same chart. Default: 1.
Panel Start Window — where the panel opens at launch: Subwindow or Chart. Default: Subwindow.