VibeFox Indicators
- Indicators
- Version: 1.20
- Updated: 2 July 2026
- Activations: 5

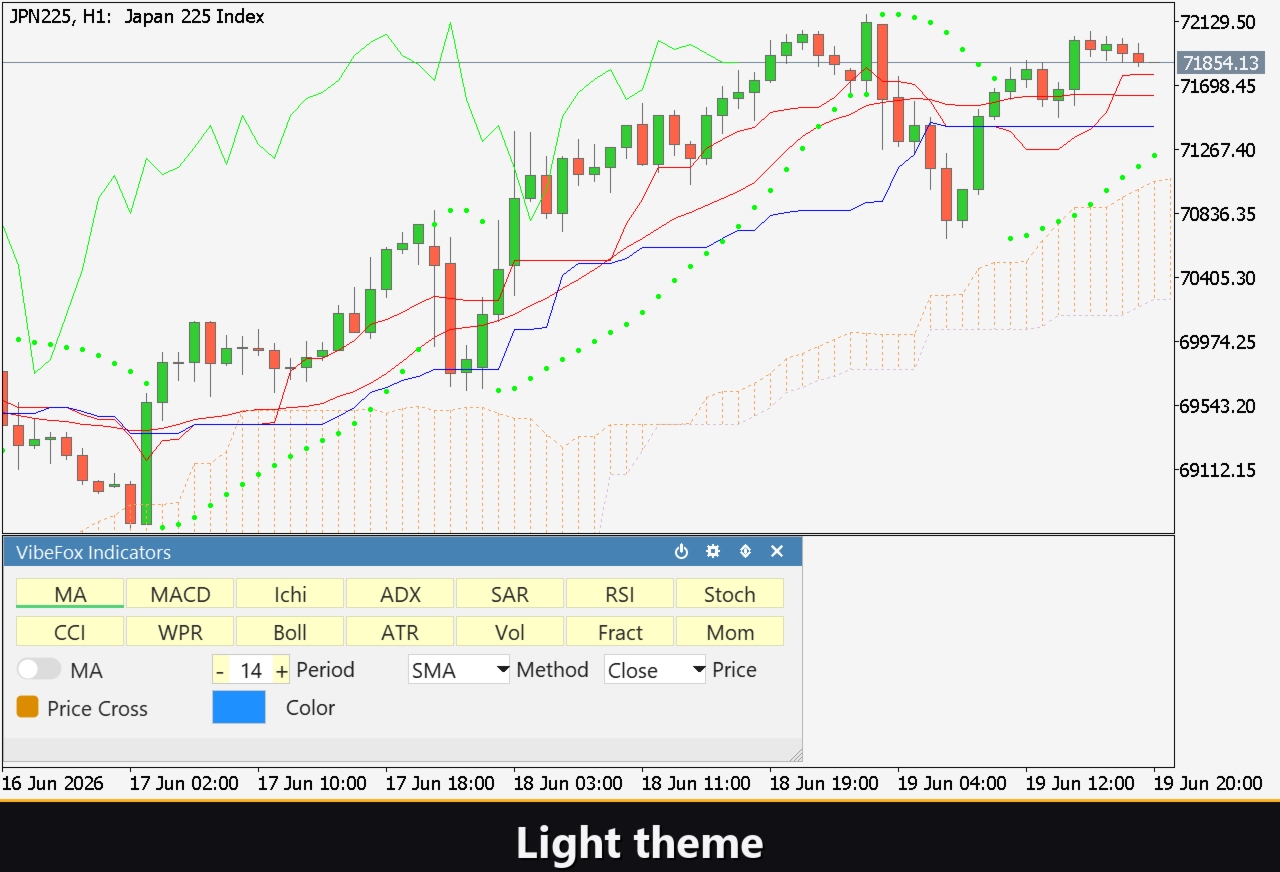
VibeFox Indicators — Multi-Indicator Signal Scanner
VibeFox Indicators turns the classic MetaTrader 5 toolbox into a single, mouse-driven control center. Instead of attaching, configuring and watching a dozen separate studies, you manage 14 well-known indicators from one compact, canvas-based panel and let the scanner mark trade signals directly on your chart in real time. It is built for traders who want clean price action plus the confirmation of trusted indicators, without cluttering the workspace.
14 Indicators in One Panel
A two-row selector gives you instant access to every indicator the scanner supports. Each one keeps its own independent settings and its own enabled state.
Trend and overlay: Moving Average, Ichimoku, Parabolic SAR, Bollinger Bands, Fractals.
Momentum and oscillators: MACD, RSI, Stochastic, CCI, Williams %R, Momentum.
Strength and volatility: ADX, ATR, Volume.
When an indicator that normally lives in its own pane is switched on — such as MACD, RSI, Stochastic, CCI, Williams %R, ADX, ATR, Volume or Momentum — its standard MetaTrader 5 visual is added automatically in a separate subwindow. Overlay indicators like Moving Average, Bollinger Bands, Parabolic SAR, Ichimoku and Fractals are drawn straight on the price chart. You always see the same study the signal is based on.
Built-in Signal Strategies
VibeFox Indicators does more than plot lines: it watches each indicator for meaningful events and converts them into Buy and Sell signals on every newly closed bar. The strategies are grouped per indicator and can be enabled one by one.
Moving Average — Price Cross.
MACD — Signal Cross, Zero Cross, Divergence.
Ichimoku — TK Cross, Kumo Break.
ADX — DI Cross, Divergence.
Parabolic SAR — SAR Flip.
RSI — Level Cross, Divergence.
Stochastic — KD Cross, Divergence.
CCI — Level Cross, Divergence.
Williams %R — Level Cross, Divergence.
Bollinger Bands — Band Bounce, Squeeze.
ATR — Vol Expand.
Volume — Vol Spike, Divergence.
Fractals — Fractal.
Momentum — Level Cross, Divergence.
Because each strategy is a separate switch, you can run a single confirmation method or stack several at once, building the exact signal logic you trust on a given symbol.
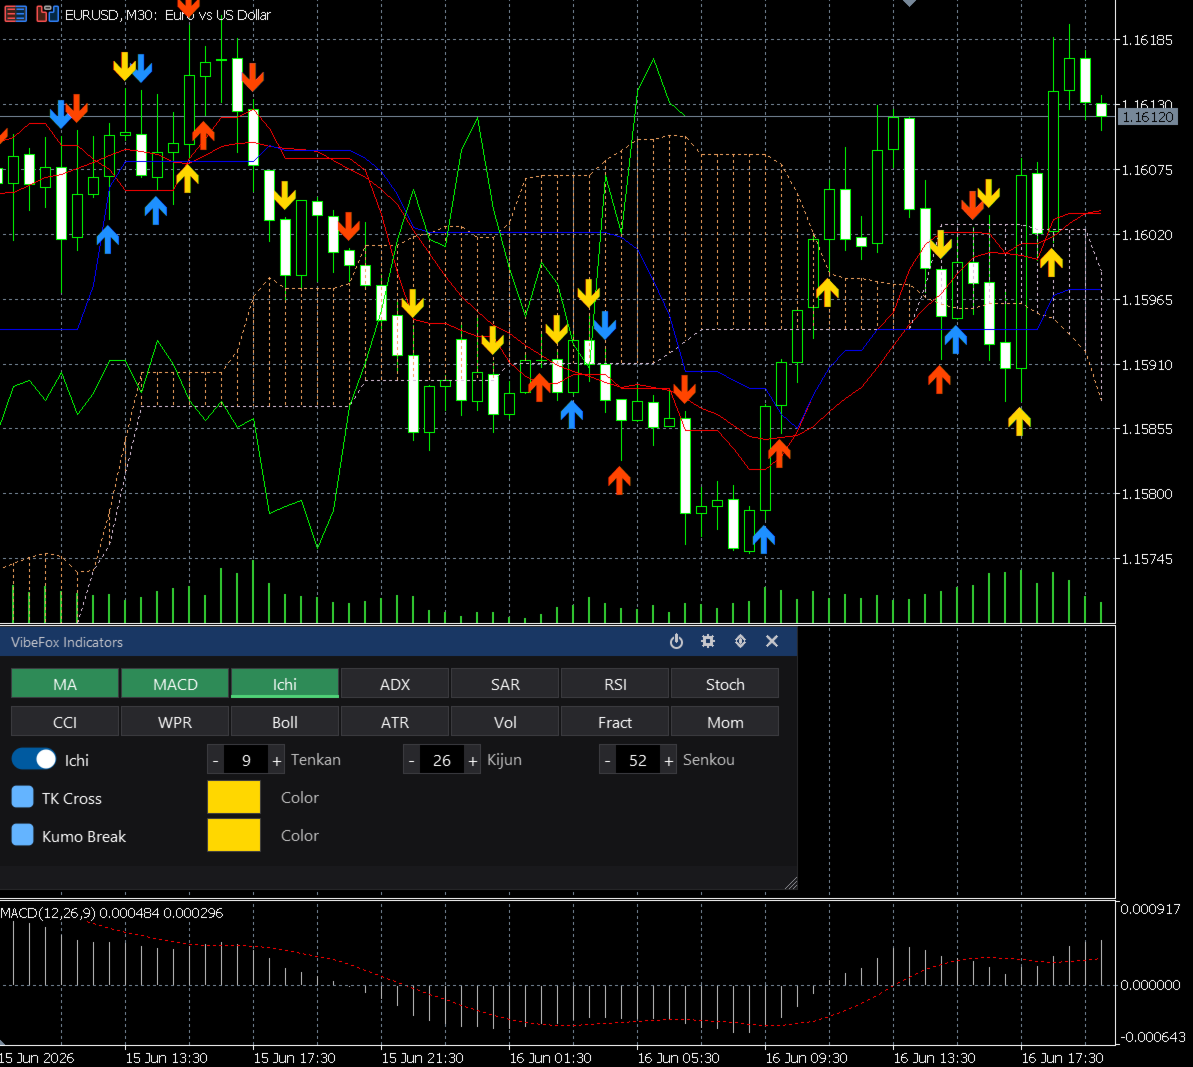
Signals Marked on the Chart
Every detected signal is drawn as a colored arrow placed at the bar where it occurred, so direction and timing are clear at a glance. You assign a personal arrow color to each strategy, which makes it easy to tell at a single look which method fired. To keep the chart readable, the scanner automatically retires the oldest arrows once a limit is reached, always keeping the most recent signals in view.
Fully Configurable per Indicator
Select any indicator and its parameters open right below the selector, with only the fields that apply to it.
On toggle enables or disables the chosen indicator independently of the others.
Period, Method and Price let you tune calculation length, the moving-average method and the applied price, just as you would in the native MetaTrader 5 settings.
Extra parameters appear where an indicator needs them, such as the step and maximum for Parabolic SAR or the deviation for Bollinger Bands.
Strategy rows carry a checkbox to arm the strategy, a color picker for its signal arrow, and Lvl Up / Lvl Dn thresholds for the oscillators that use level crossings, so you decide exactly where a Level Cross counts.
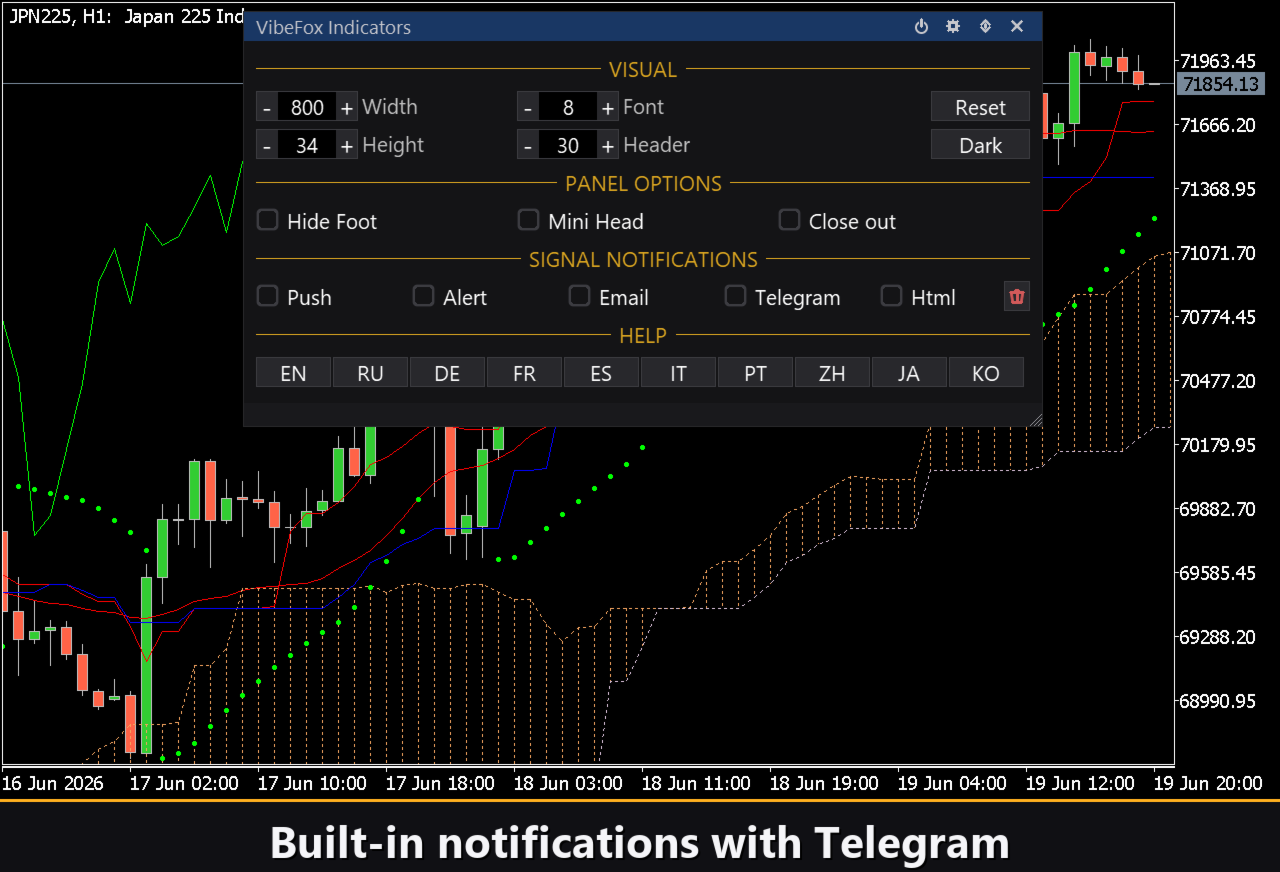
Multi-Channel Notifications
Signals are not only shown — they can reach you wherever you are. Notifications are delivered through several independent channels at the same time.
Push — mobile notification to the MetaTrader app on your phone.
Alert — pop-up message inside the terminal.
Email — message sent through the terminal mail settings.
Telegram — the alert text together with a chart screenshot, sent straight to your Telegram chat.
Html — every signal is logged into a visual report.
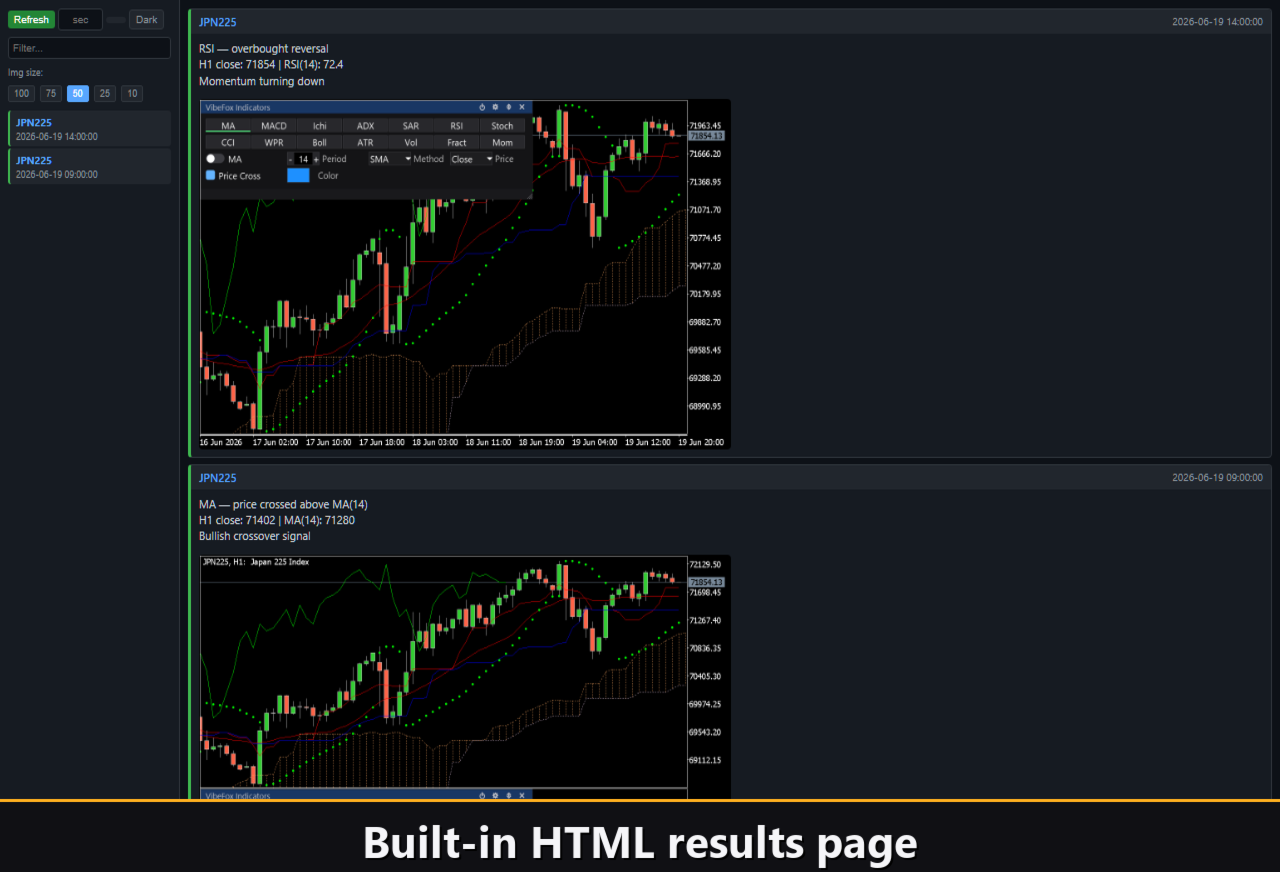
Visual History (HTML Report)
Enable the Html channel and each signal is saved into an HTML report together with a screenshot of the chart at the moment of detection. The report is stored in the terminal Files folder and opens in any browser, giving you a visual log you can review later to study how each strategy behaved. A one-click trash button clears the report and its screenshots whenever you want a fresh start.
Telegram Alerts
Signals can also be delivered straight to your Telegram chat — the alert text together with a screenshot of the chart at the moment of detection. Turn on the Telegram channel and enter your bot token and chat id in the inputs.
Delivery rides on the HTML report: each new signal is written into the report, and the report — opened in a browser — forwards it to your Telegram chat on its own. For this reason, enabling Telegram automatically keeps the Html report on, and the two channels work together.
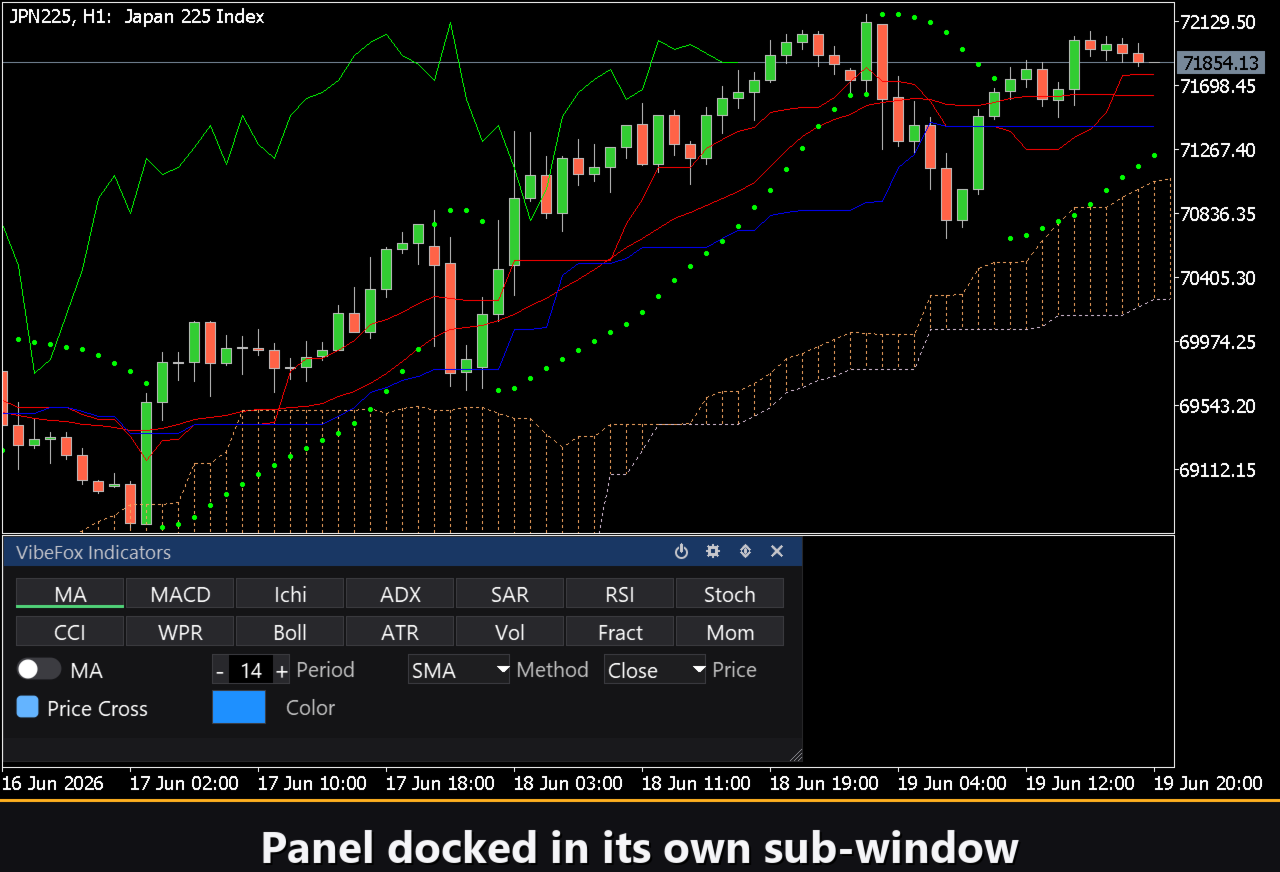
Interactive On-Chart Panel
The whole interface is a smooth, canvas-based panel built for fast, mouse-driven control.
Power — one switch turns all indicators on or off at once.
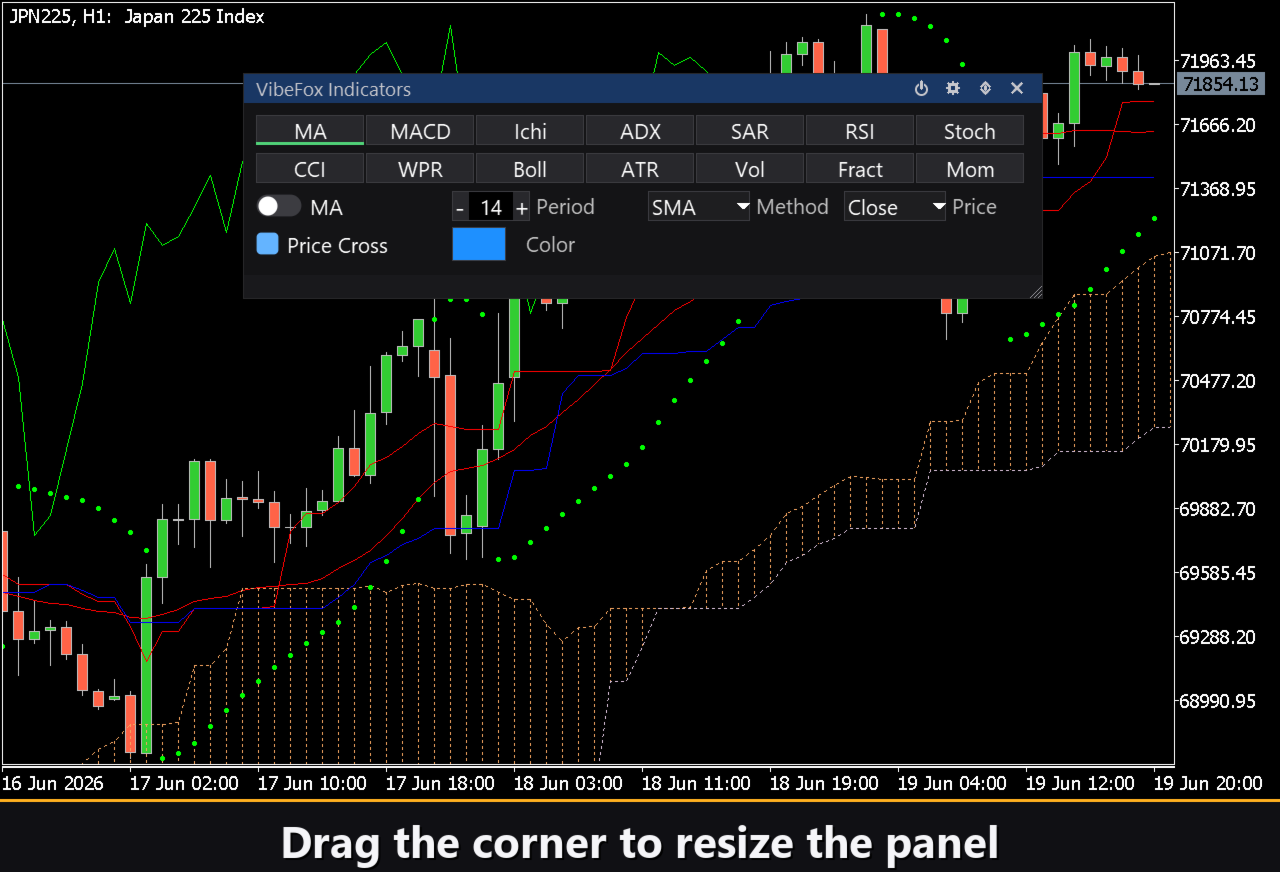
Resizable — drag the lower-right corner to scale the panel.
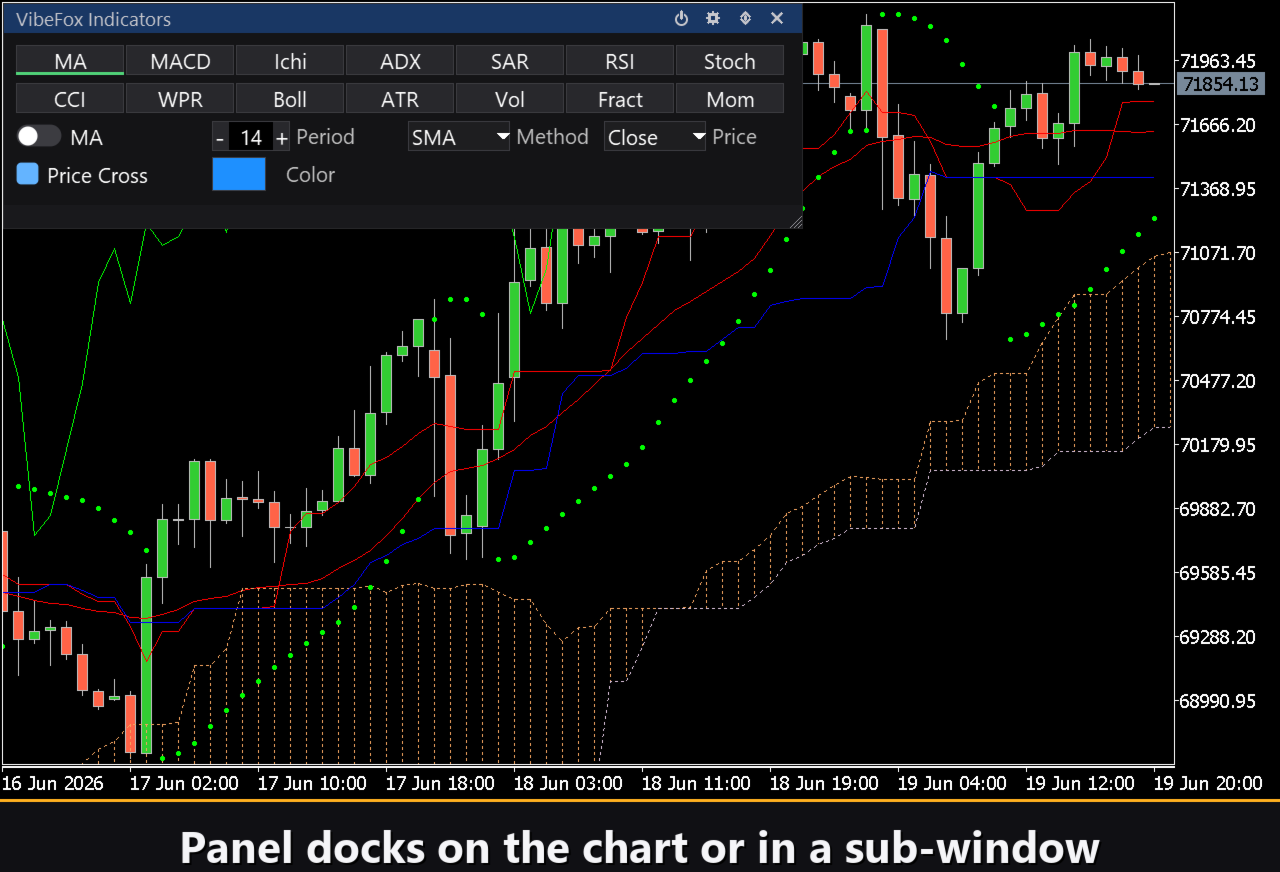
Movable — switch the panel between a separate subwindow and the main chart.
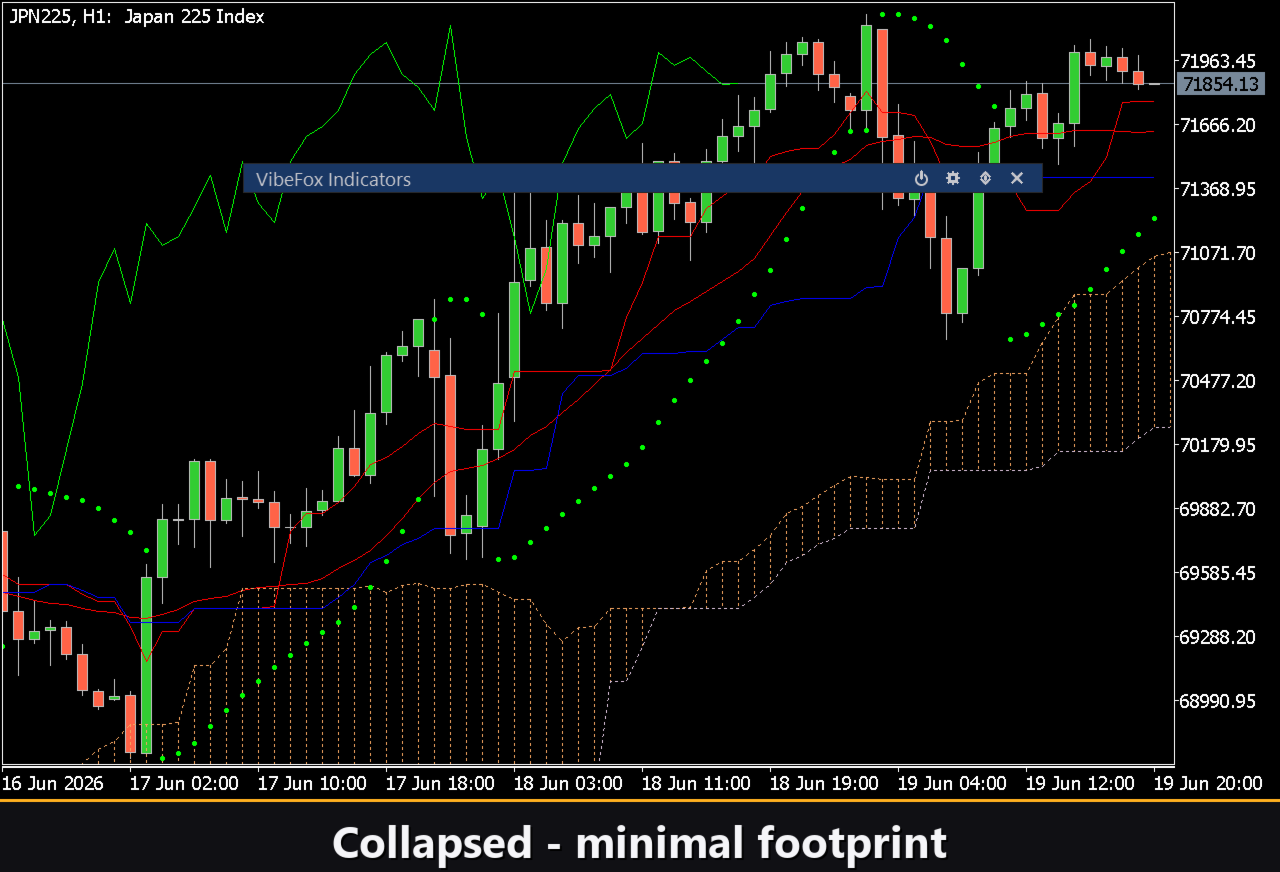
Collapsible — double-click the header to fold the panel into a compact bar.
Quick toggles — left-click an indicator to select it, right-click to enable or disable it instantly.
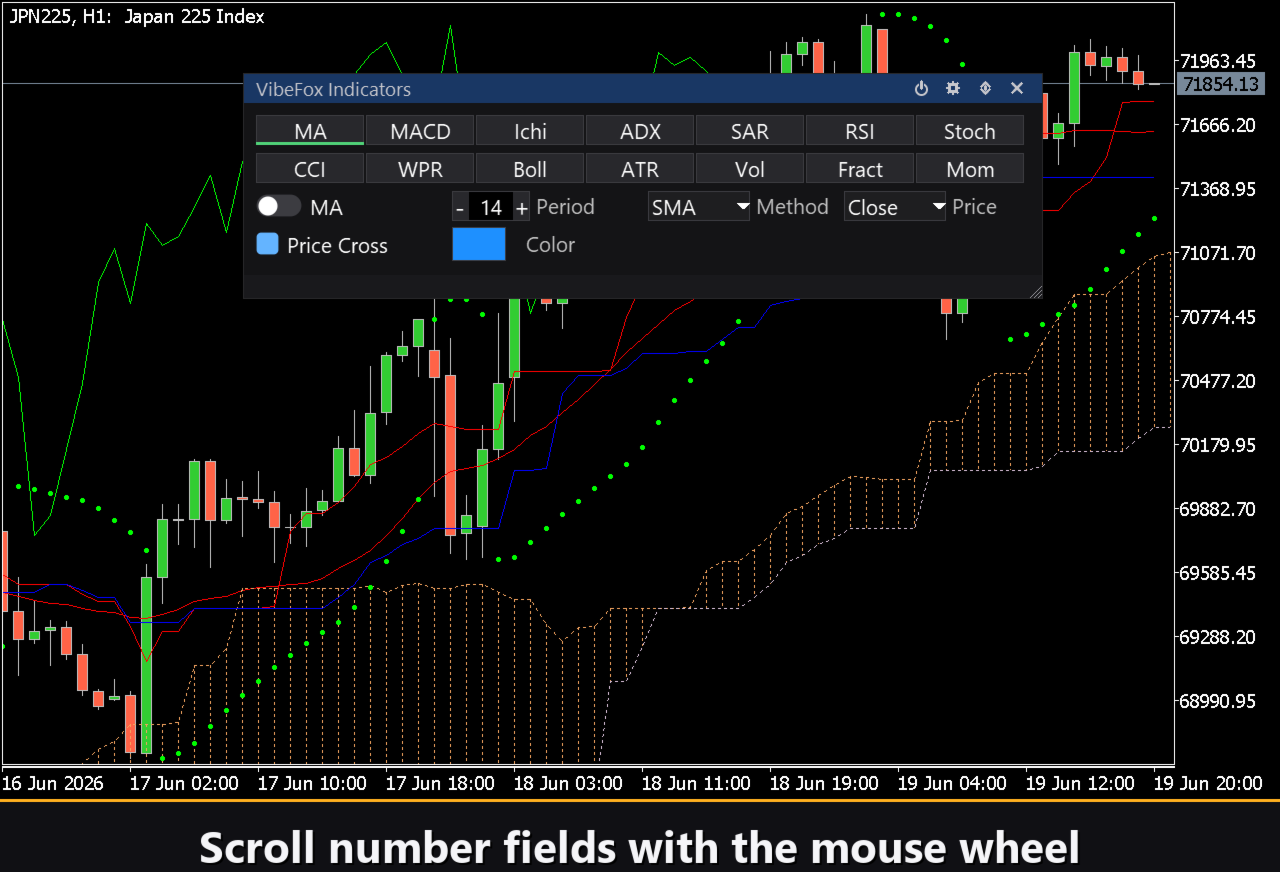
Mouse wheel — hover any Number field and scroll to change its value.
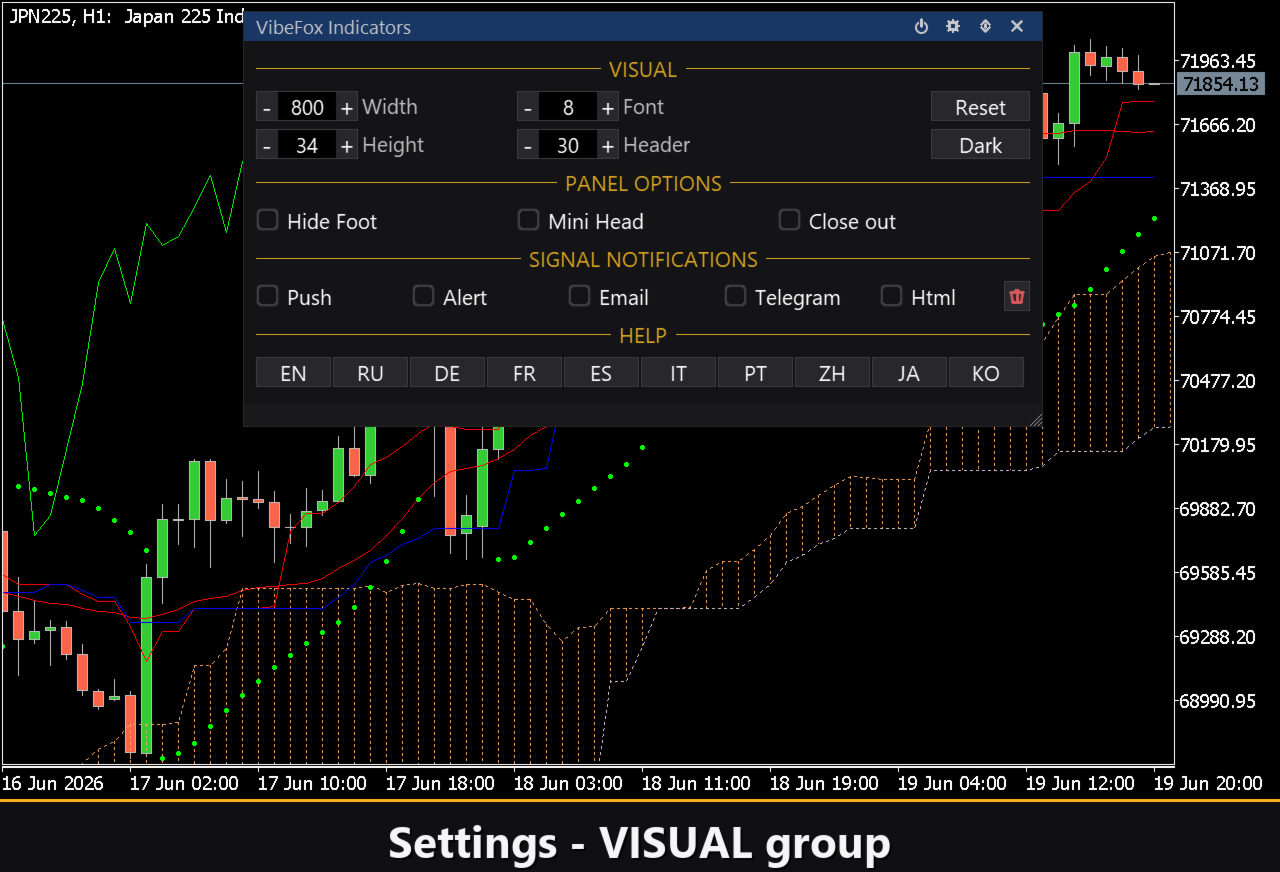
Presets and Personalization
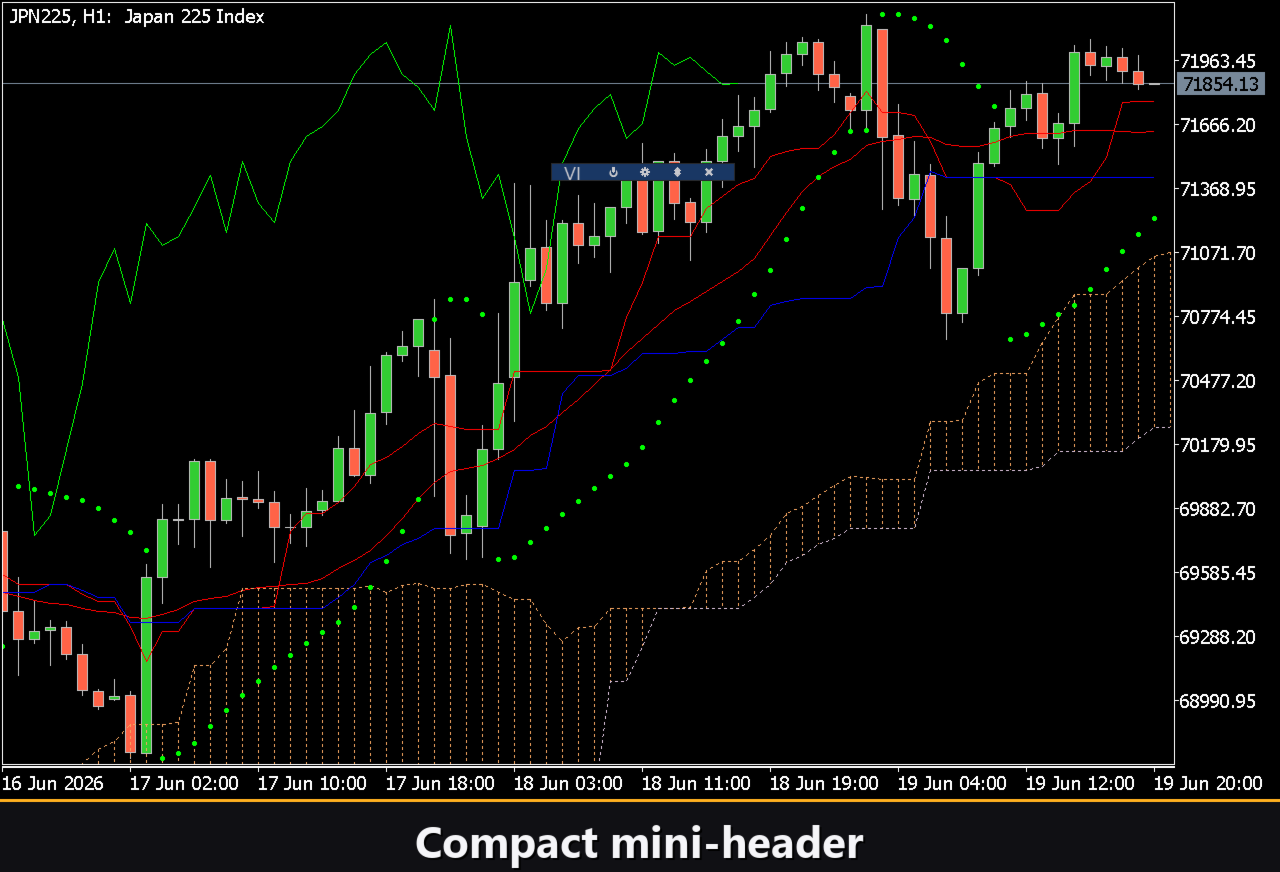
You adapt the look and behavior to your workspace: light, dark or automatic theme, adjustable panel width, header size, row height and font size, with a Reset to restore default sizes. Optional touches include hiding the footer, a mini header when collapsed, and folding the panel on an outside click.
Complete setups can be stored as named presets with Load, Save, Add, Delete and Rename, so you can switch between configurations for different symbols or trading styles in a moment. You can also run several independent copies on the same chart by giving each a unique instance number.
Built-in Multilingual Help
A complete help page is built into the panel, so every control is explained right where you use it. It is available in multiple languages, with localized text selectable from the Settings section.
Parameters (Inputs tab)
Most settings can also be changed live right on the panel (the Settings button and presets) — the input parameters only set the initial values at startup.
Notifications
Push Notification — push notification to the MetaTrader mobile terminal. Default: off.
Alert Popup — pop-up Alert window inside the terminal. Default: off.
Email — email through the terminal mail settings. Default: off.
Html — saves every signal with a screenshot into an HTML report (Files folder), opens in any browser. Default: off.
Telegram — send each signal to your Telegram chat (alert text plus a chart screenshot) through the HTML report. Default: off.
Telegram bot token — the token of your Telegram bot, used to send the messages.
Telegram chat id — the id of the Telegram chat that receives the signals.
Debug
Debug — debug mode: verbose logging to the Experts journal. Not needed for normal use. Default: off.
Panel and Settings
Panel width, px — panel width in pixels, range 300..800. Default: 800.
Header size — header bar size, 1..6. Default: 1.
Theme — color theme: Auto (follows the chart), Dark or Light. Default: Auto.
Row height (px) — panel row height in pixels. Default: 34.
Font size — panel font size. Default: 8.
Hide Footer — hide the panel footer bar. Default: off.
Mini Header on collapse — show a mini header when the panel is collapsed. Default: off.
Close on click outside — collapse the panel when you click outside it. Default: off.
Instance — copy number of the indicator; lets you keep several independent copies on the same chart. Default: 1.
Panel Start Window — where the panel opens at startup: Subwindow or Chart. Default: Subwindow.