VibeFox Levels
- Indicators
- Version: 1.1
- Updated: 20 June 2026
- Activations: 5

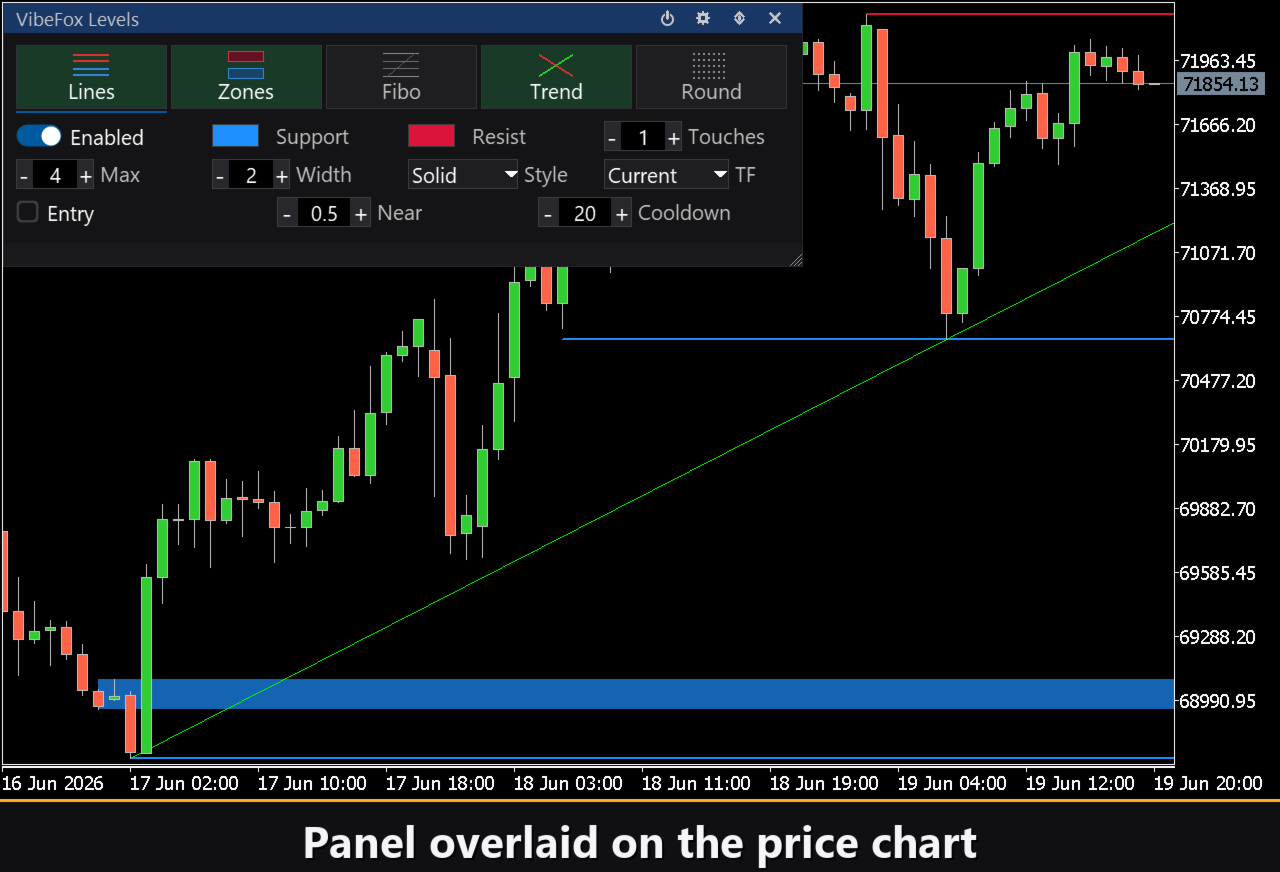
VibeFox Levels — Support, Resistance and Key Price Levels
VibeFox Levels is an all-in-one price-level toolkit for MetaTrader 5. It automatically detects and draws the structure that matters most to price-action traders — horizontal Support and Resistance, Supply and Demand zones, Fibonacci retracements, Trend Lines and Round Numbers — and presents everything through a single modern, interactive panel. Instead of marking levels by hand on every symbol and timeframe, you let the indicator find them and you stay focused on the decision.
Five Level Tools in One Indicator
Each tool works independently and can be turned on or off in a click, so you can run only what fits your strategy or combine all five into a complete map of the chart.
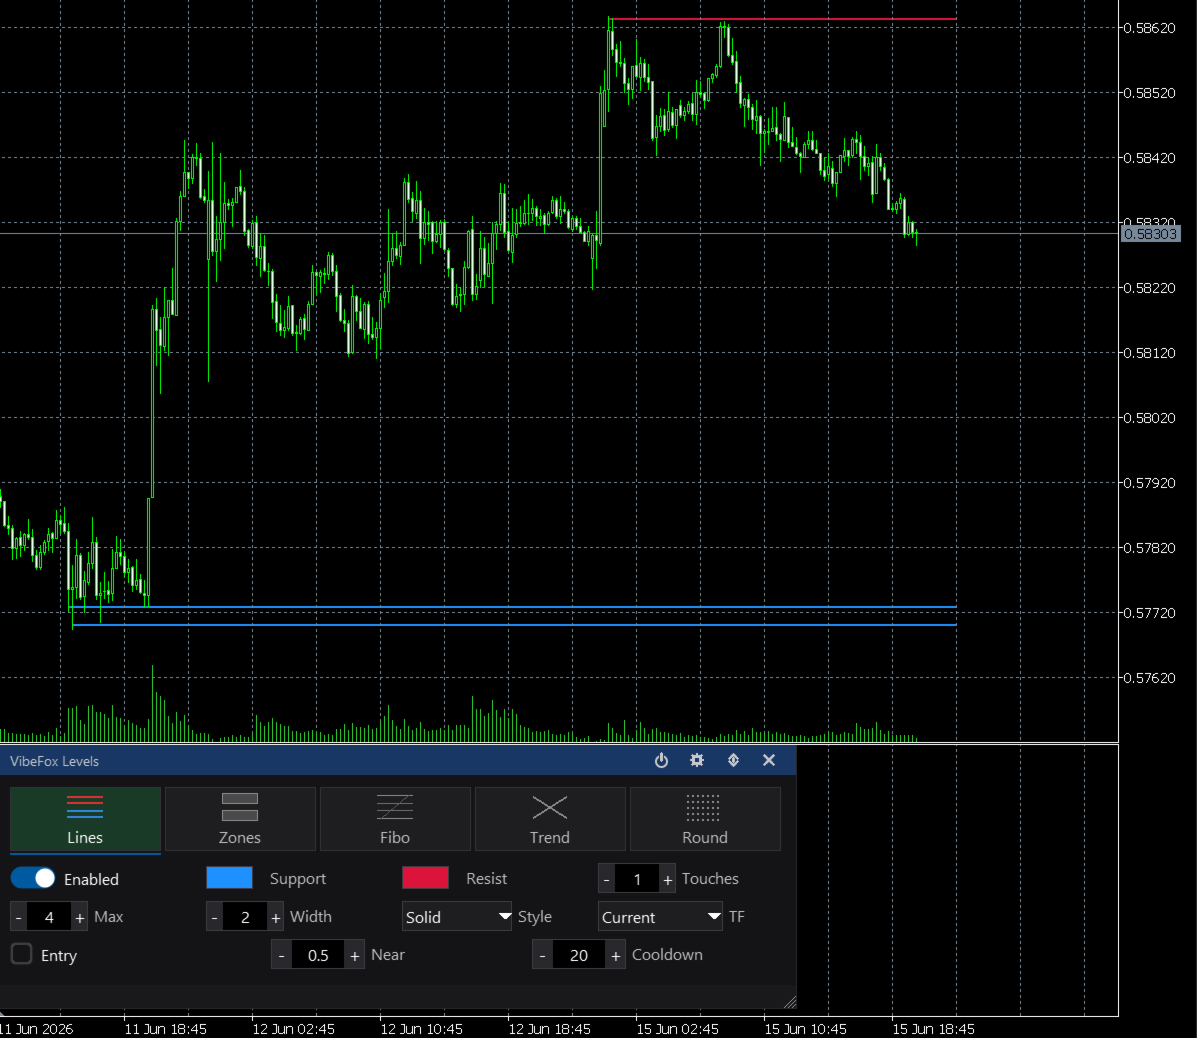
Lines (Support / Resistance) — horizontal levels built from confirmed price reactions. You set the minimum number of Touches required to keep a level, and the maximum number of levels shown on each side of price, so the chart stays clean and only the strongest zones survive.
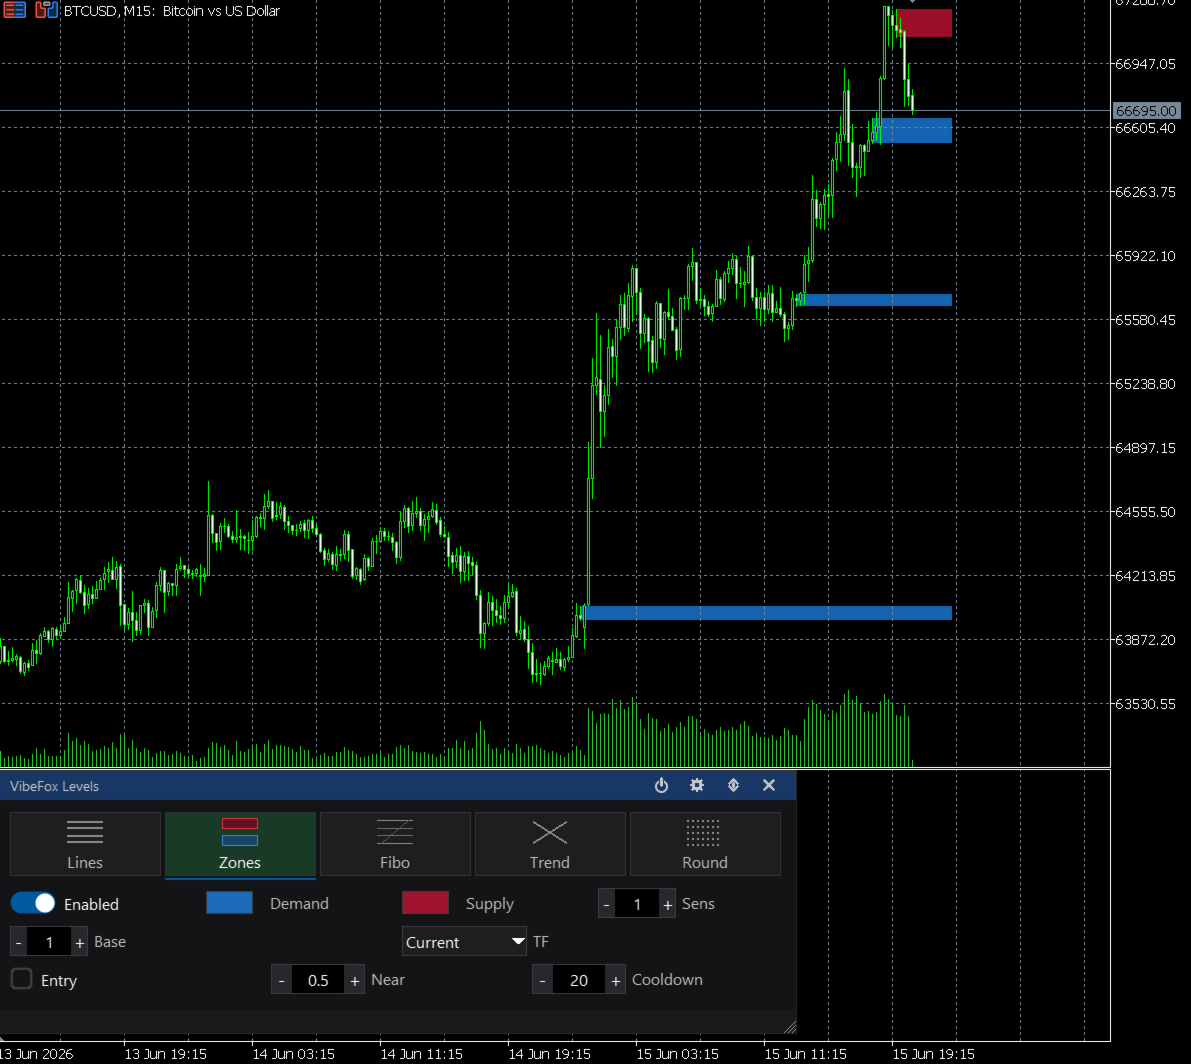
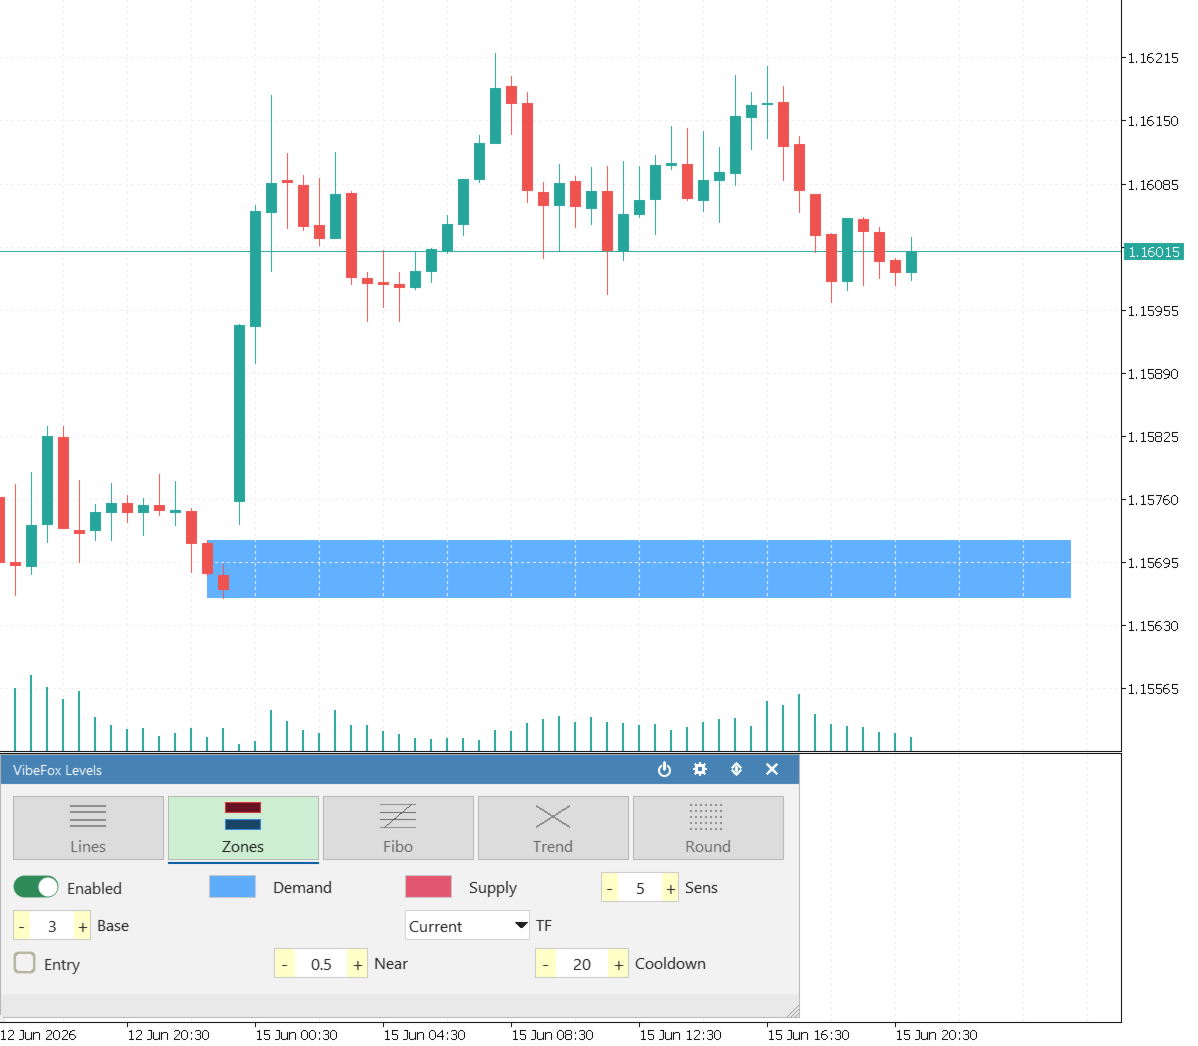
Zones (Supply / Demand) — rectangular zones drawn at the base of strong departures. A Sens (departure strength) control filters weak moves, and a Base setting limits how many bars form the base before the impulse, so you capture genuine imbalance areas rather than noise.
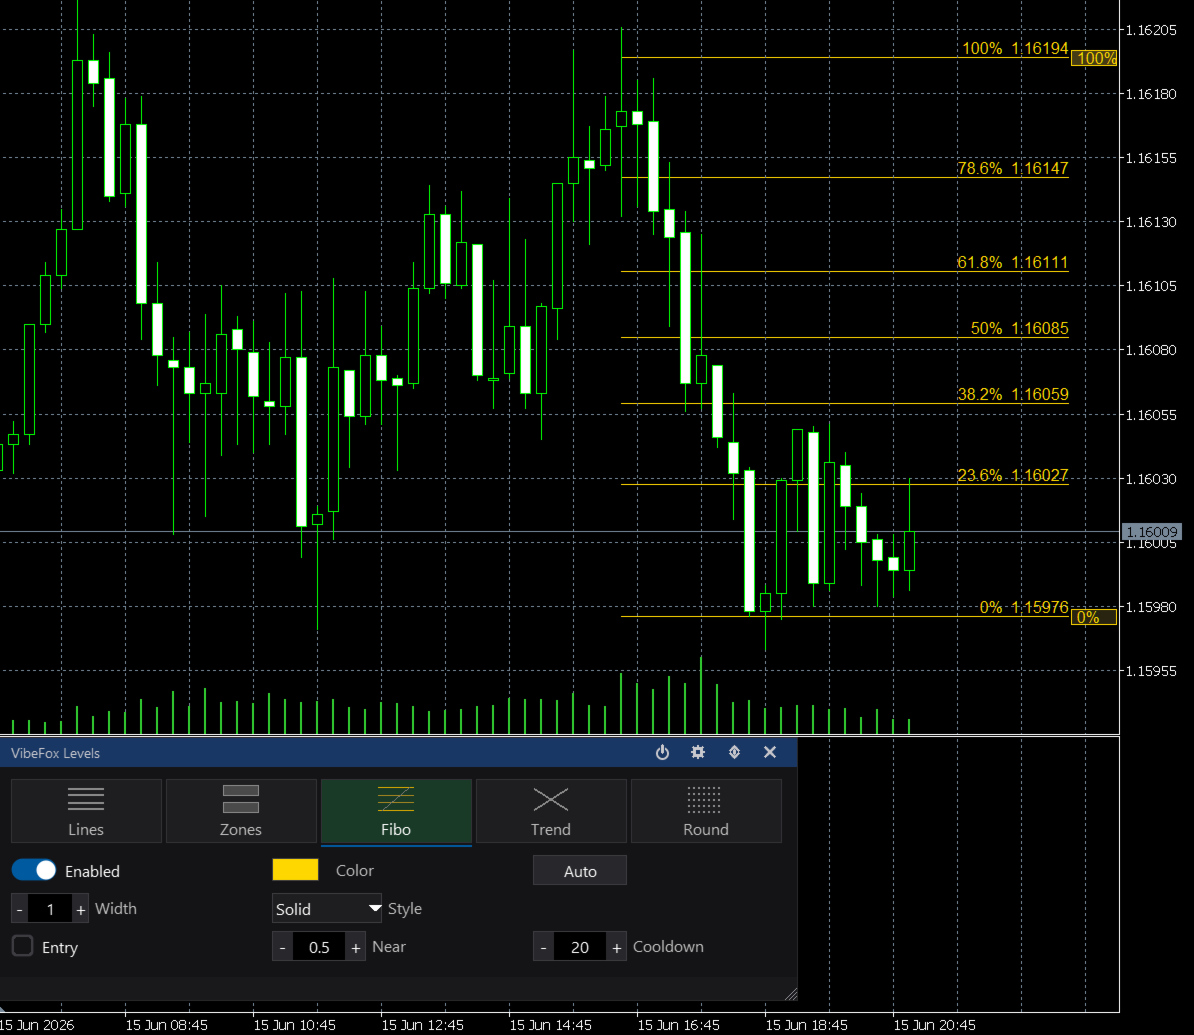
Fibonacci — retracement levels mapped automatically onto the most recent impulse. An Auto button re-detects the latest swing on demand, and you can fine-tune the anchors by dragging the 0% and 100% sliders directly on the panel. Optional level labels make each ratio easy to read.
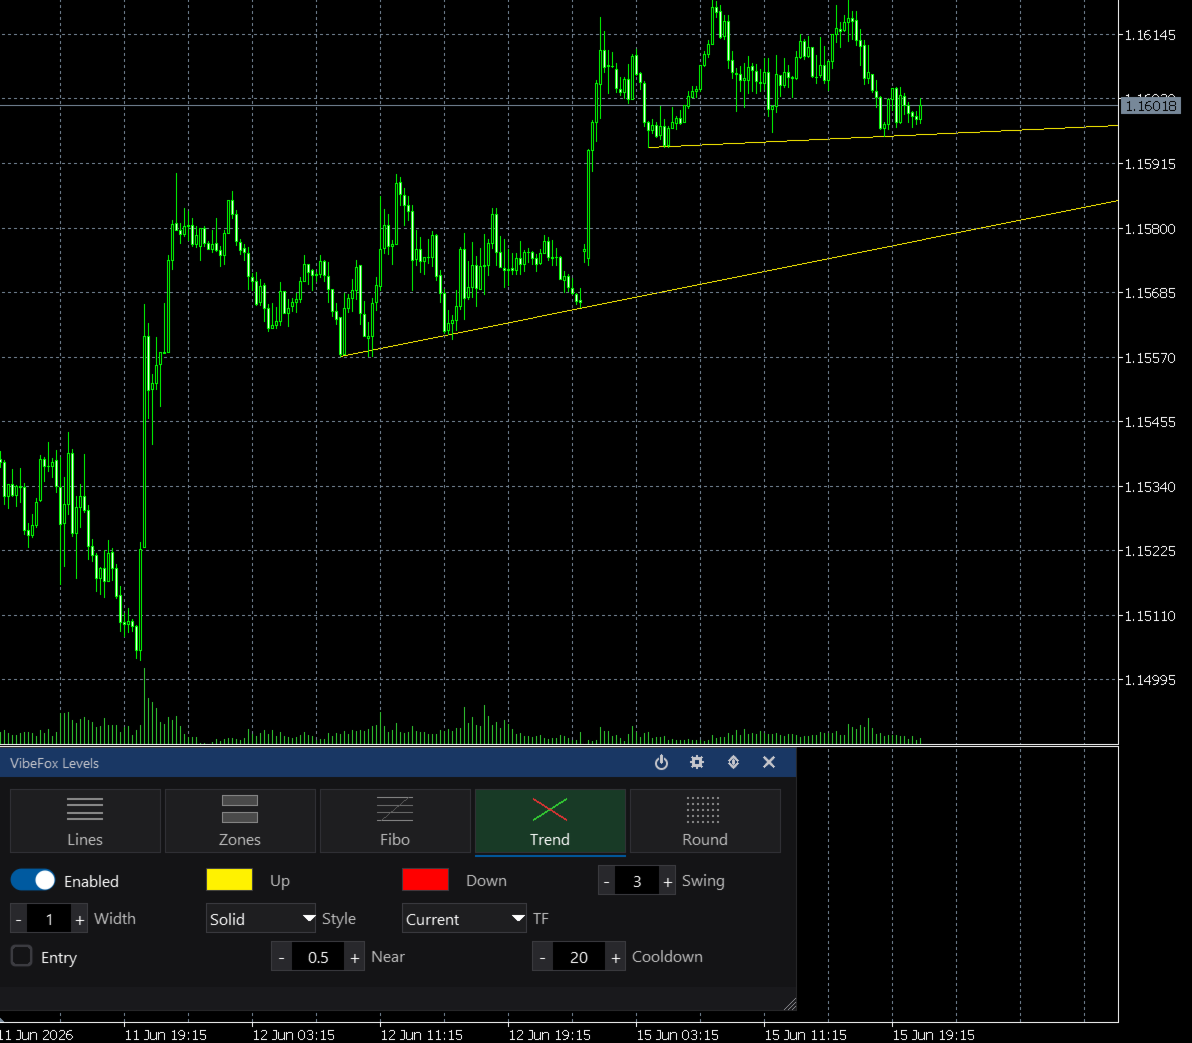
Trend Lines — diagonal up-trend and down-trend lines anchored to swing points. A Swing strength control sets how significant a pivot must be to act as an anchor, and lines can be extended to the right to project structure forward.
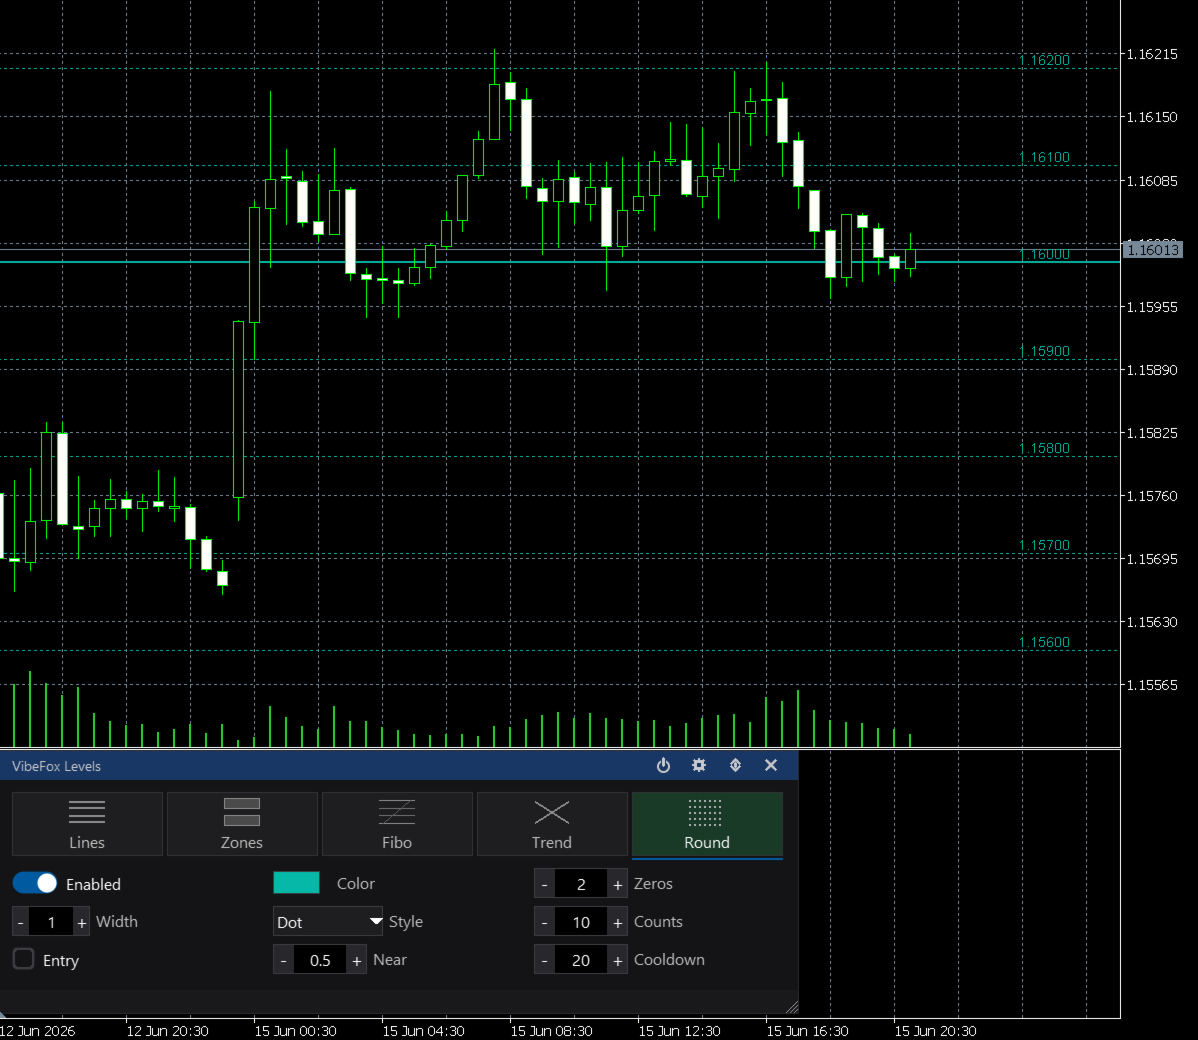
Round Numbers — psychologically important whole-number price levels. You choose how many trailing Zeros define a round price (setting the step) and how many levels to display around the current price.
Detection on Any Timeframe
Lines, Zones and Trend Lines each carry their own TF selector, so a level tool can analyze a higher timeframe while you trade on a lower one. Set Support/Resistance from the daily chart, watch zones from the four-hour, and keep your execution chart fast — all without switching windows.
Full Visual Control per Tool
Every level type keeps its own independent appearance, opened with a single click on its tab.
Colors and transparency are set separately for each side — Support versus Resistance, Demand versus Supply, up-trend versus down-trend — so the chart reads at a glance.
Line width and style (Solid, Dash, Dot and more) let you match each tool to your visual hierarchy, from bold key levels to subtle reference lines.
A Lookback Bars depth per tool controls how far back the detection scans, balancing detail against speed for any market.
Smart Entry Notifications
Each level tool has its own Entry switch that watches for price interacting with the levels it draws. This is independent from the chart display, so you can keep a tool visible without alerts, or arm alerts on a tool you prefer to keep hidden.
Near sets how close price must come to a level to trigger, measured in ATR units, so proximity adapts automatically to the symbol's volatility — set it to zero to require an exact touch.
Cooldown defines how many bars must pass before the same level can alert again, preventing repeated messages while price hovers around a zone.
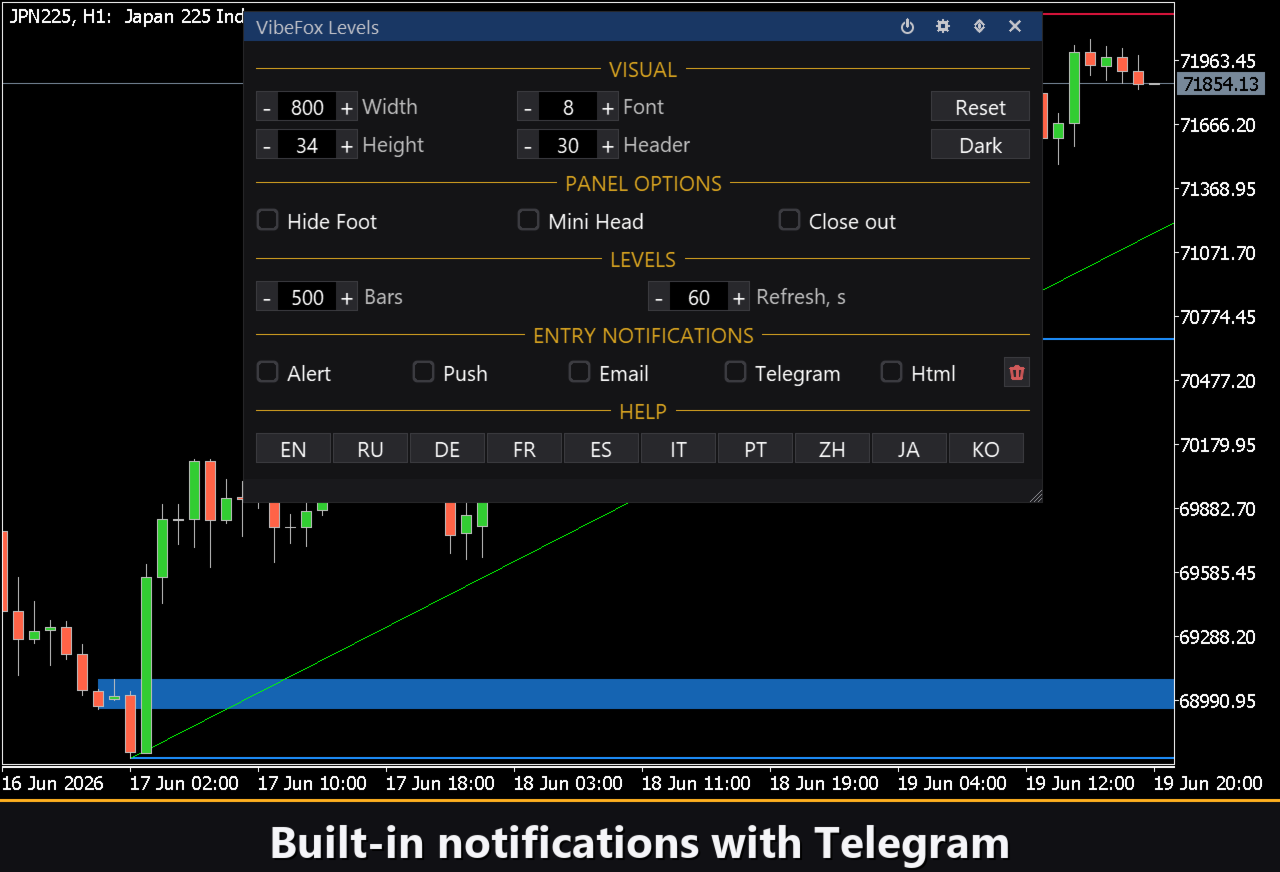
Notifications Across Channels
Signals are delivered through several channels at the same time, chosen in Settings.
Alert — pop-up message inside the terminal.
Push — mobile notification to the MetaTrader 5 app on your phone.
Email — message sent through the terminal mail settings.
Telegram — the alert text together with a chart screenshot, sent straight to your Telegram chat.
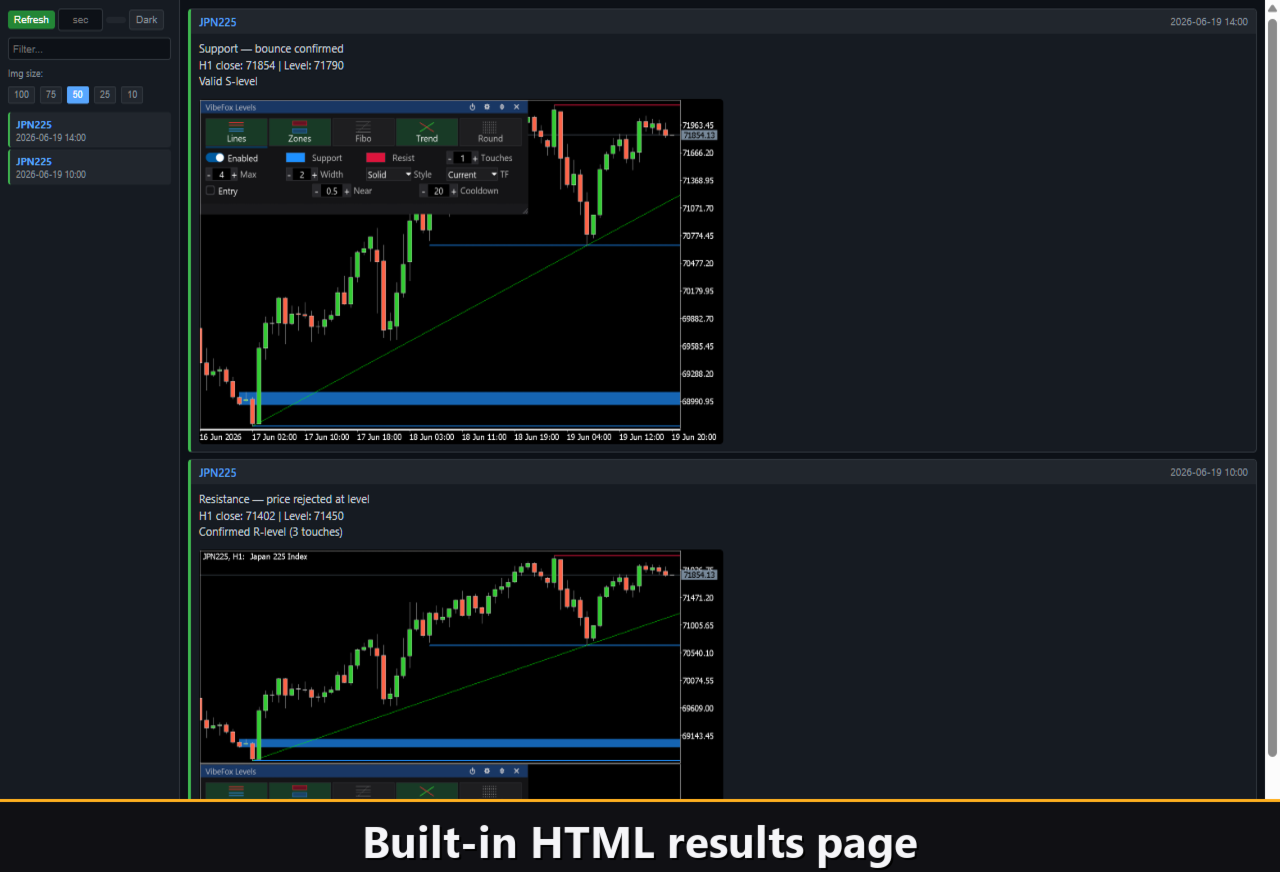
Html — saves the event into a visual report described below.
Visual History (HTML Report)
Enable the Html channel and every entry signal is saved into an HTML report together with a screenshot of the chart at the moment of detection. The report is stored in the terminal Files folder and opens in any browser, giving you a visual log of how price reacted at each level. A one-click trash icon clears the report whenever you want a fresh start.
Telegram Alerts
Signals can also be delivered straight to your Telegram chat — the alert text together with a screenshot of the chart at the moment of detection. Turn on the Telegram channel and enter your bot token and chat id in the inputs.
Delivery rides on the HTML report: each new signal is written into the report, and the report — opened in a browser — forwards it to your Telegram chat on its own. For this reason, enabling Telegram automatically keeps the Html report on, and the two channels work together.
Interactive On-Chart Panel
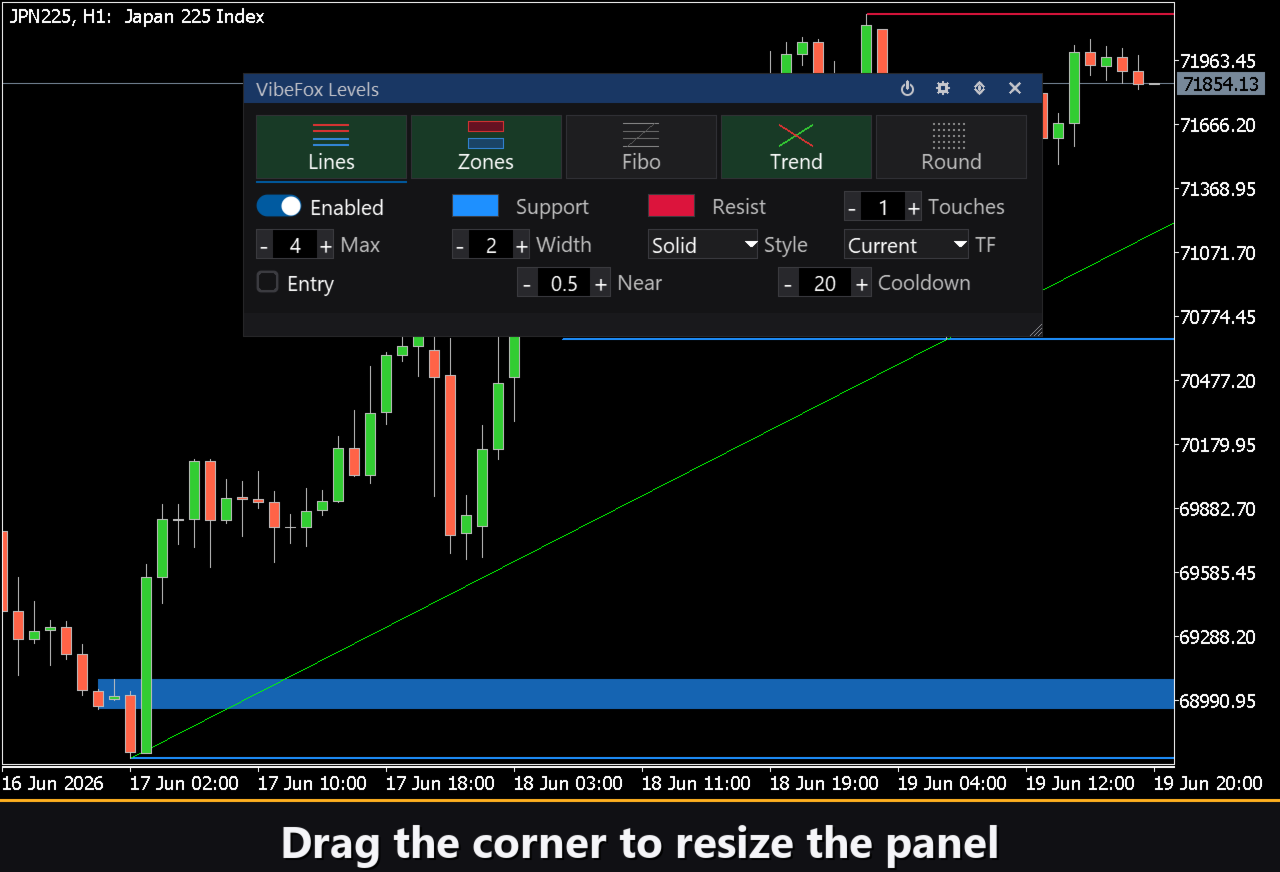
The entire interface is a smooth, canvas-based panel built for fast, mouse-driven control.
Resizable — drag the lower-right corner to scale the panel.
Movable — switch the panel between a separate subwindow and the main chart.
Collapsible — fold the panel into a compact header bar when you need room.
Quick toggles — left-click a tool tab to open its settings, right-click to show or hide that tool instantly.
Mouse wheel — hover any number field and scroll to change its value.
Auto-refresh — an adjustable refresh interval keeps levels recalculated as the market develops.
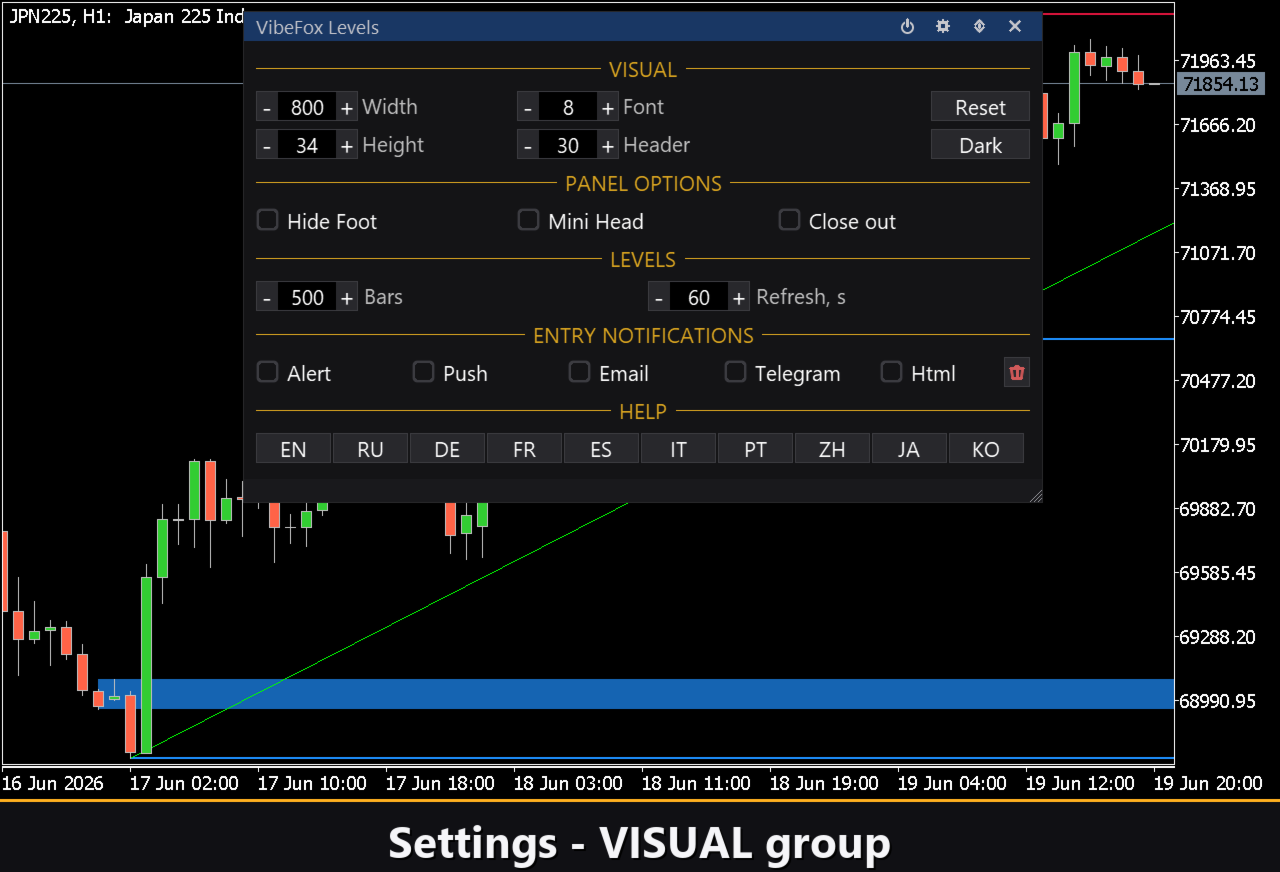
Personalization
You adapt the look and behavior to your workspace: light, dark or automatic theme, adjustable panel width, header size, row height and font size. You can choose whether the panel starts in a subwindow or on the main chart, and run several independent copies on the same chart using a unique instance number — for example one instance for intraday levels and another for higher-timeframe structure.
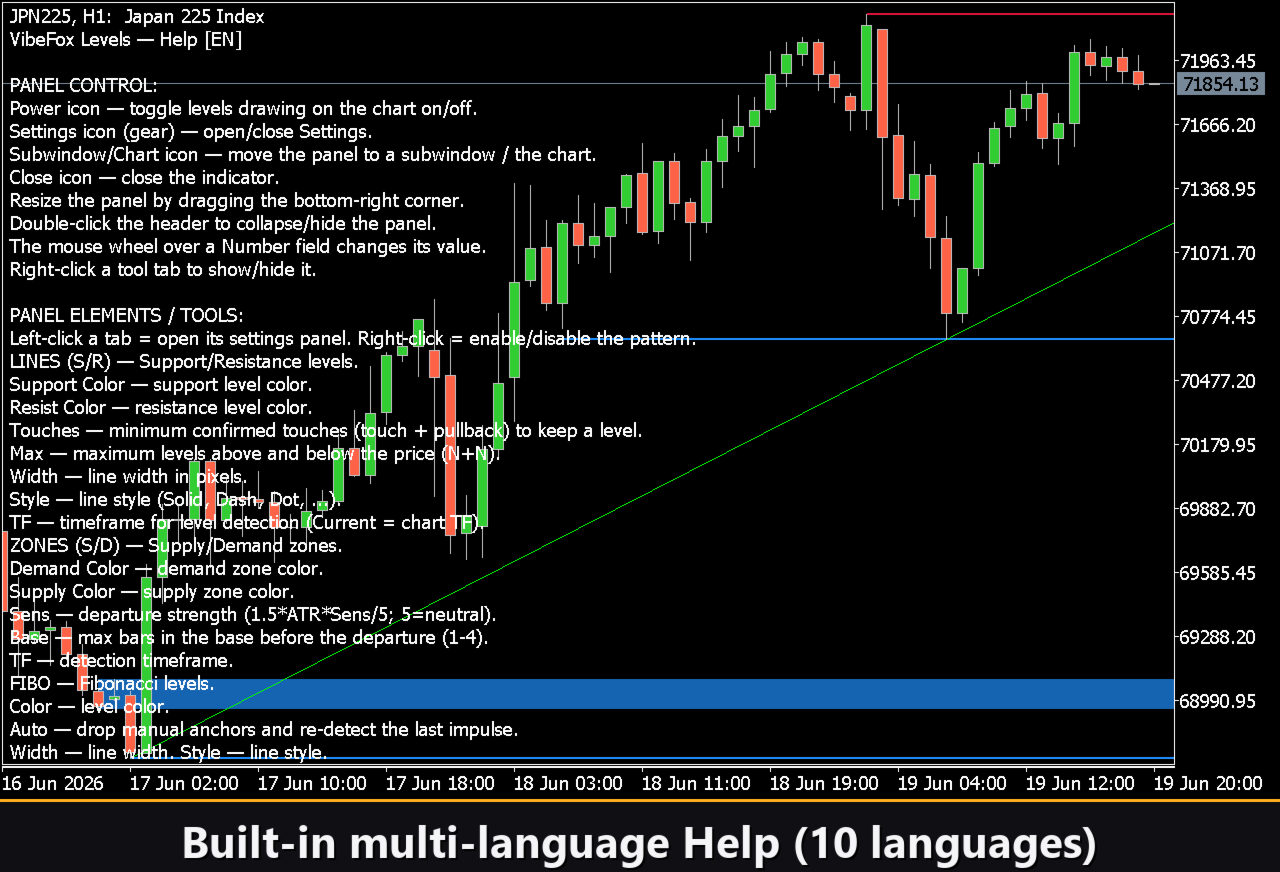
Built-in Multilingual Help
A complete help page is built into the panel and available in 10 languages, so every control is explained right where you use it.
Parameters (Inputs tab)
Most settings can also be changed live right on the panel (the Settings button and presets) — the input parameters only set the initial values at startup.
Lines (Support / Resistance)
Enabled — turn the Support/Resistance tool on. Default: on.
Lookback Bars — how many bars back the detection scans. Default: 500.
Min Touches — minimum number of price reactions required to keep a level. Default: 3.
Max Levels per Side — maximum number of levels shown above and below price. Default: 4.
Support Color — color of support lines. Default: DodgerBlue.
Support Transparency % — transparency of support lines, 0..100. Default: 0.
Resistance Color — color of resistance lines. Default: Crimson.
Resistance Transparency % — transparency of resistance lines, 0..100. Default: 0.
Zones (Supply / Demand)
Enabled — turn the Supply/Demand zones tool on. Default: off.
Lookback Bars — how many bars back the detection scans. Default: 200.
Departure Sens — sensitivity of the departure strength filter, 5 = neutral. Default: 5.
Max Base Bars — maximum number of base bars before the impulse, 1..4. Default: 3.
Demand Color — color of demand zones. Default: DodgerBlue.
Demand Transparency % — transparency of demand zones, 0..100. Default: 30.
Supply Color — color of supply zones. Default: Crimson.
Supply Transparency % — transparency of supply zones, 0..100. Default: 30.
Fibo
Enabled — turn the Fibonacci tool on. Default: off.
Level Color — color of the Fibonacci levels. Default: Gold.
Level Transparency % — transparency of the levels, 0..100. Default: 0.
Show Labels — show the ratio label on each level. Default: on.
Trend
Enabled — turn the Trend Lines tool on. Default: off.
Lookback Bars — how many bars back the detection scans. Default: 200.
Swing Strength — how significant a pivot must be to anchor a trend line. Default: 5.
Uptrend Color — color of up-trend lines. Default: Lime.
Uptrend Transparency % — transparency of up-trend lines, 0..100. Default: 0.
Downtrend Color — color of down-trend lines. Default: Red.
Downtrend Transparency % — transparency of down-trend lines, 0..100. Default: 0.
Extend Right — extend the trend lines to the right edge of the chart. Default: on.
Round
Enabled — turn the Round Numbers tool on. Default: off.
Round Zeros — number of trailing zeros that define a round price, 1..6 (sets the step). Default: 2.
Level Color — color of the round-number lines. Default: Silver.
Transparency % — transparency of the lines, 0..100. Default: 30.
Notifications
Push Notification — push notification to the MetaTrader mobile terminal. Default: off.
Alert Popup — pop-up Alert window inside the terminal. Default: off.
Email — email through the terminal mail settings. Default: off.
Html — saves every signal with a screenshot into an HTML report (Files folder), opens in any browser. Default: off.
Telegram — send each signal to your Telegram chat (alert text plus a chart screenshot) through the HTML report. Default: off.
Telegram bot token — the token of your Telegram bot, used to send the messages.
Telegram chat id — the id of the Telegram chat that receives the signals.
Debug
Debug — debug mode: verbose logging to the Experts journal. Not needed for normal use. Default: off.
Panel / Settings
Panel width, px — panel width in pixels, range 300..800. Default: 800.
Header size — header bar size, 1..6. Default: 1.
Theme — color theme: Auto (follows the chart), Dark or Light. Default: Auto.
Row height (px) — panel row height in pixels. Default: 34.
Font size — panel font size. Default: 8.
Hide Footer — hide the panel footer bar. Default: off.
Mini Header on collapse — show a mini header when the panel is collapsed. Default: off.
Close on click outside — collapse the panel when you click outside it. Default: off.
Instance — copy number of the indicator; lets you keep several independent copies on the same chart. Default: 1.
Panel Start Window — where the panel opens at startup: Subwindow or Chart. Default: Subwindow.
Who It Is For
VibeFox Levels is made for discretionary and systematic traders who build their decisions around market structure and key price levels. It runs on any symbol and any timeframe and fits both fast intraday work and higher-timeframe analysis, giving you a single, consistent picture of where price is likely to react.