VibeFox Pivot Points
- Indicators
- Version: 1.10
- Updated: 2 July 2026
- Activations: 5

VibeFox Pivot Points — multi-method pivot levels, support and resistance zones, and entry signals
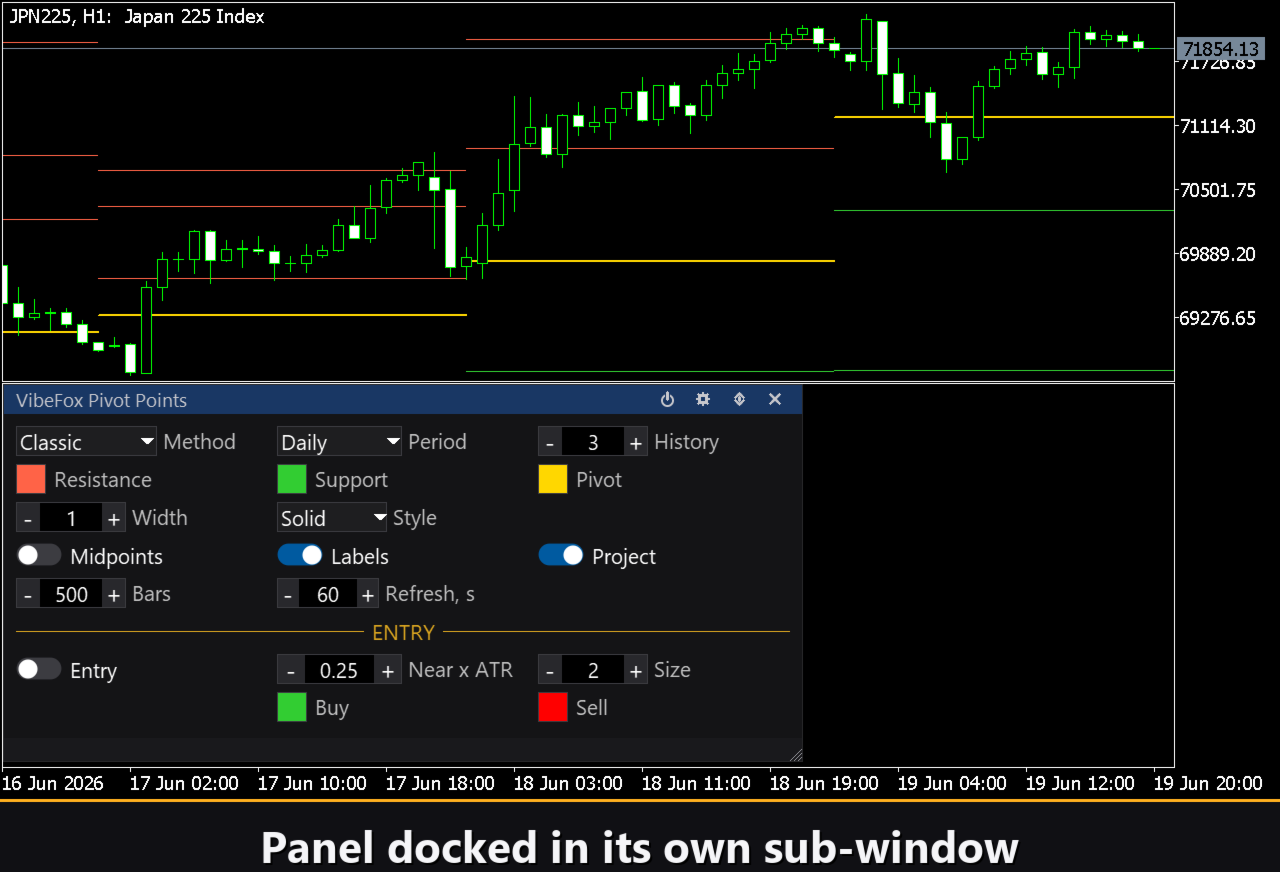
VibeFox Pivot Points is a real-time pivot level overlay for MetaTrader 5. It calculates the central pivot PP and the surrounding resistance levels R1, R2, R3 and support levels S1, S2, S3 using your chosen calculation method and draws them directly on the price chart. Optional midpoint lines and level labels keep the chart readable at any zoom. When price approaches a level within a configurable tolerance, a touch signal fires and an arrow marker appears on the chart. Everything is controlled through one smooth interactive canvas panel without opening the terminal's input dialog.
What Pivot Points measure
Pivot points are derived from the prior period's High, Low and Close values. The central PP acts as the primary equilibrium for the current session; price above PP favours buyers, price below favours sellers. The resistance levels R1, R2 and R3 sit above PP and mark potential turning zones on the way up; the support levels S1, S2 and S3 sit below and mark potential turning zones on the way down. Each calculation method spaces and weights these levels differently, producing a different picture of where the market is likely to pause or reverse.
Levels are drawn as horizontal lines that span the current period and, when Project current period right is on, extend to the right edge of the chart so you can see them ahead of price. Past periods remain on the chart for the number of history periods you configure, giving you a visual record of where pivots have been.
Calculation methods
Five methods are available from the Method parameter.
Classic — the standard floor trader formula: PP = (H + L + C) / 3. Resistance and support levels are derived symmetrically from PP. The most widely used baseline method.
Camarilla — levels are calculated from the prior close with a fixed multiplier, placing R1–R3 and S1–S3 much closer to the prior close than Classic. R4/S4 serve as breakout targets rather than reversal zones.
Woodie — PP puts extra weight on the close: PP = (H + L + 2 × C) / 4. Particularly popular for intraday trading because the formula emphasises where price settled at the end of the period.
Fibonacci — levels are derived by applying Fibonacci ratios (23.6 %, 38.2 %, 61.8 %, 100 %) to the prior range and projecting them from PP. Useful on any timeframe where Fibonacci confluence plays a role.
DeMark — PP is calculated differently depending on whether Close was above, below or equal to the Open, making the formula adaptive to the prior candle's structure. Only R1 and S1 are defined.
Period
The Period parameter determines which prior period supplies the High, Low and Close: Daily (prior day), Weekly (prior week) or Monthly (prior month). Daily pivots are the most common reference for intraday charts; weekly and monthly pivots suit swing and positional trading.
Entry points
Level Touch — approaching a pivot line
When Level Touch signal is enabled, the indicator monitors every closed bar to see whether price has come within Touch tolerance (×ATR) of any pivot level. The tolerance is expressed as a multiple of the ATR, adapting automatically to each symbol's volatility. When price touches R1, R2, R3, S1, S2, S3 or PP within that band, a marker is placed on the price chart. Detection runs only on closed bars, so the signal is never redrawn. The marker colour and appearance follow the standard entry marker settings for the signal direction.
Visual control
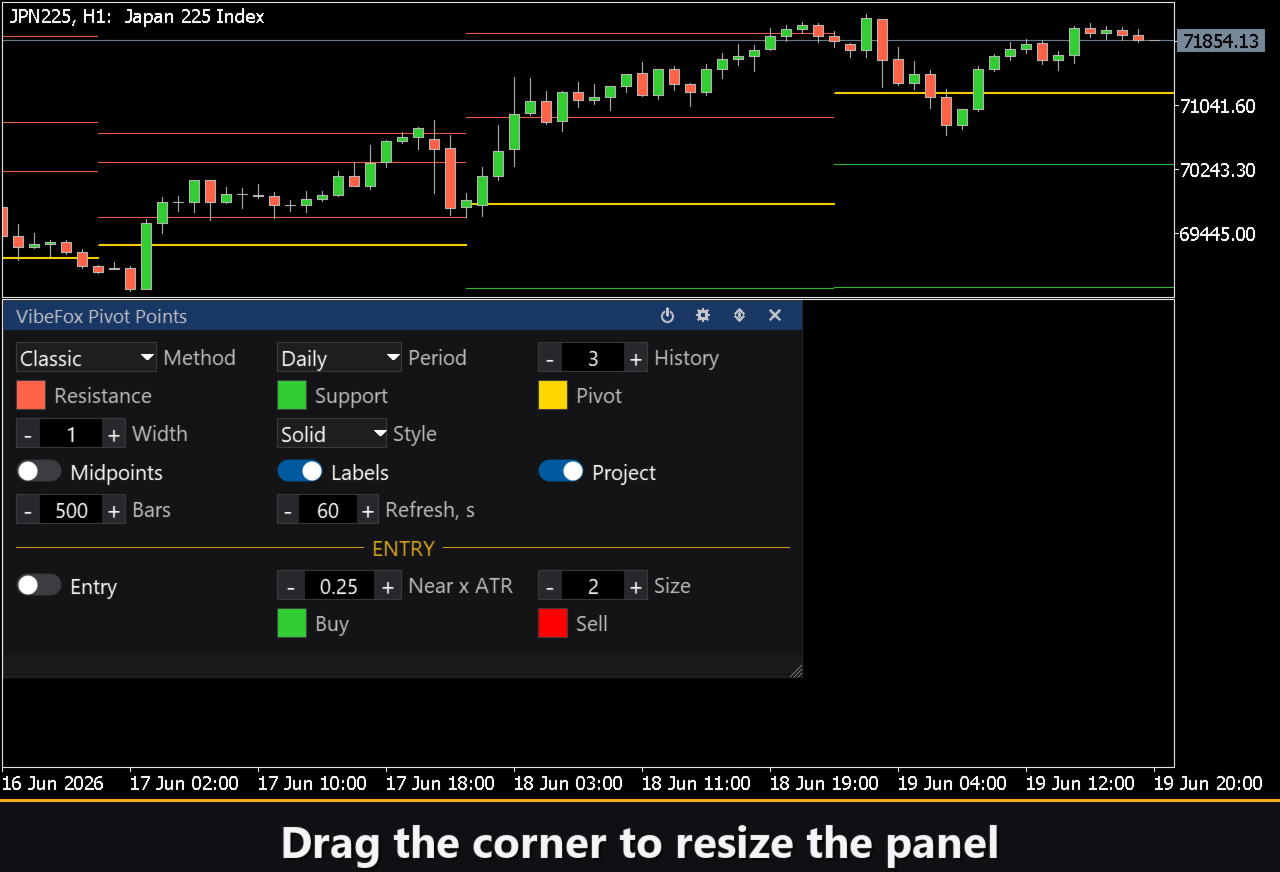
Resistance levels R1–R3 are drawn in Resistance Color, support levels S1–S3 in Support Color and the central PP in Pivot (PP) Color. Line thickness is set with Line Width (1–10) and the dash pattern with Line Style. Enable Show Midpoints to draw the halfway lines between adjacent levels (MR1, MR2, MR3, MS1, MS2, MS3). Toggle Show Labels to display the level name at the right end of each line. All these parameters can be adjusted live on the panel without restarting the indicator.
History
The History periods to show (1–30) parameter controls how many past period pivots are drawn in addition to the current one. Setting it to 3, for example, keeps the three most recent prior-period pivot sets on the chart alongside the current one, so you can see how price interacted with previous pivot clusters.
Interactive panel on the chart
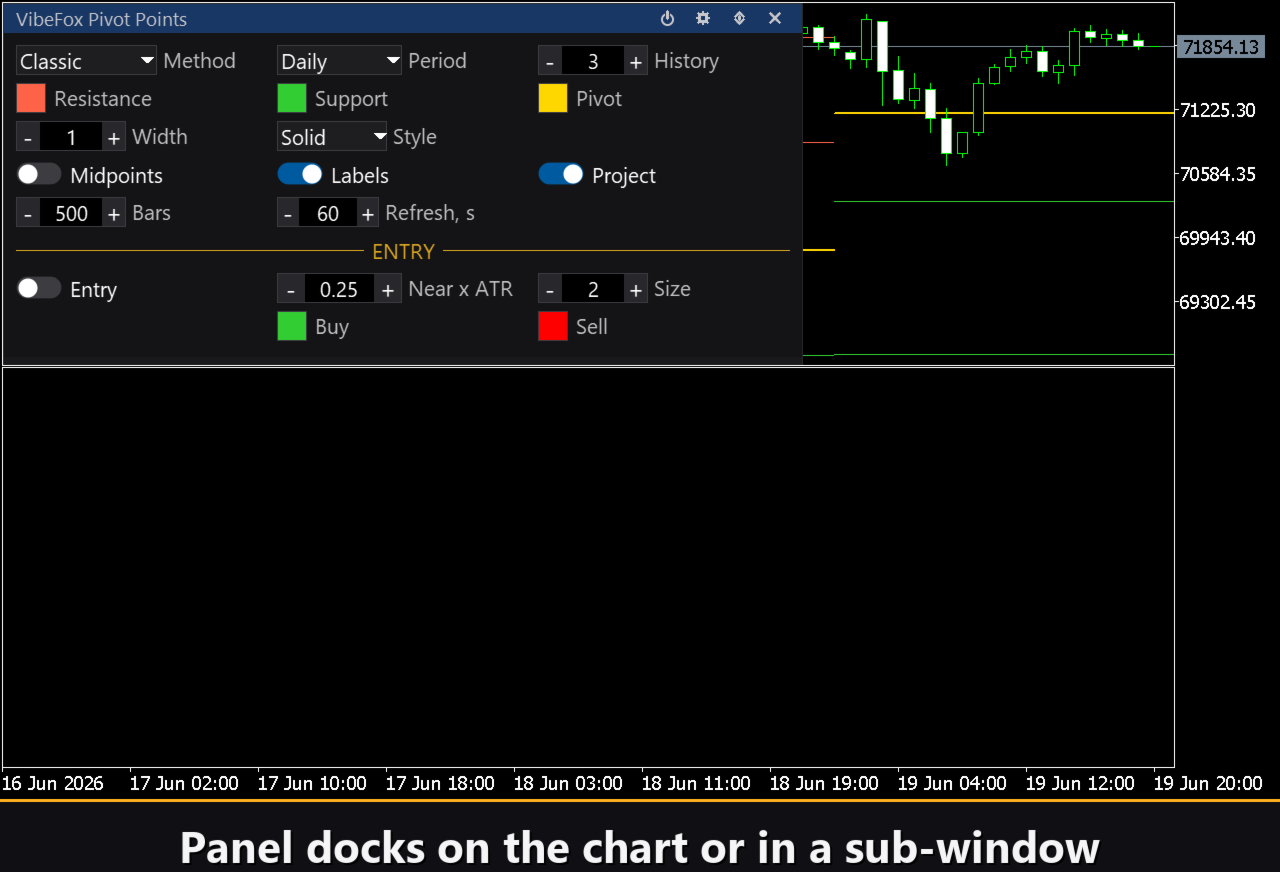
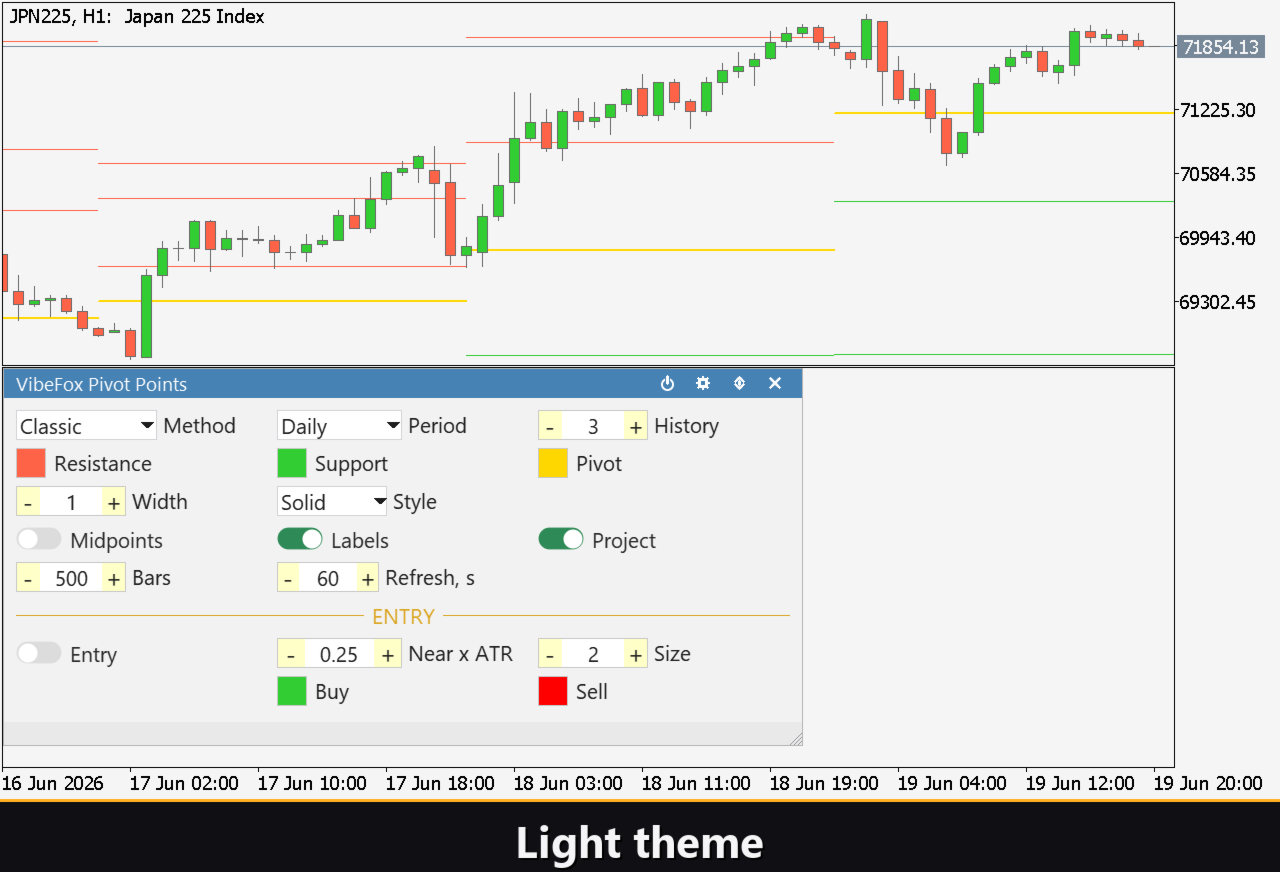
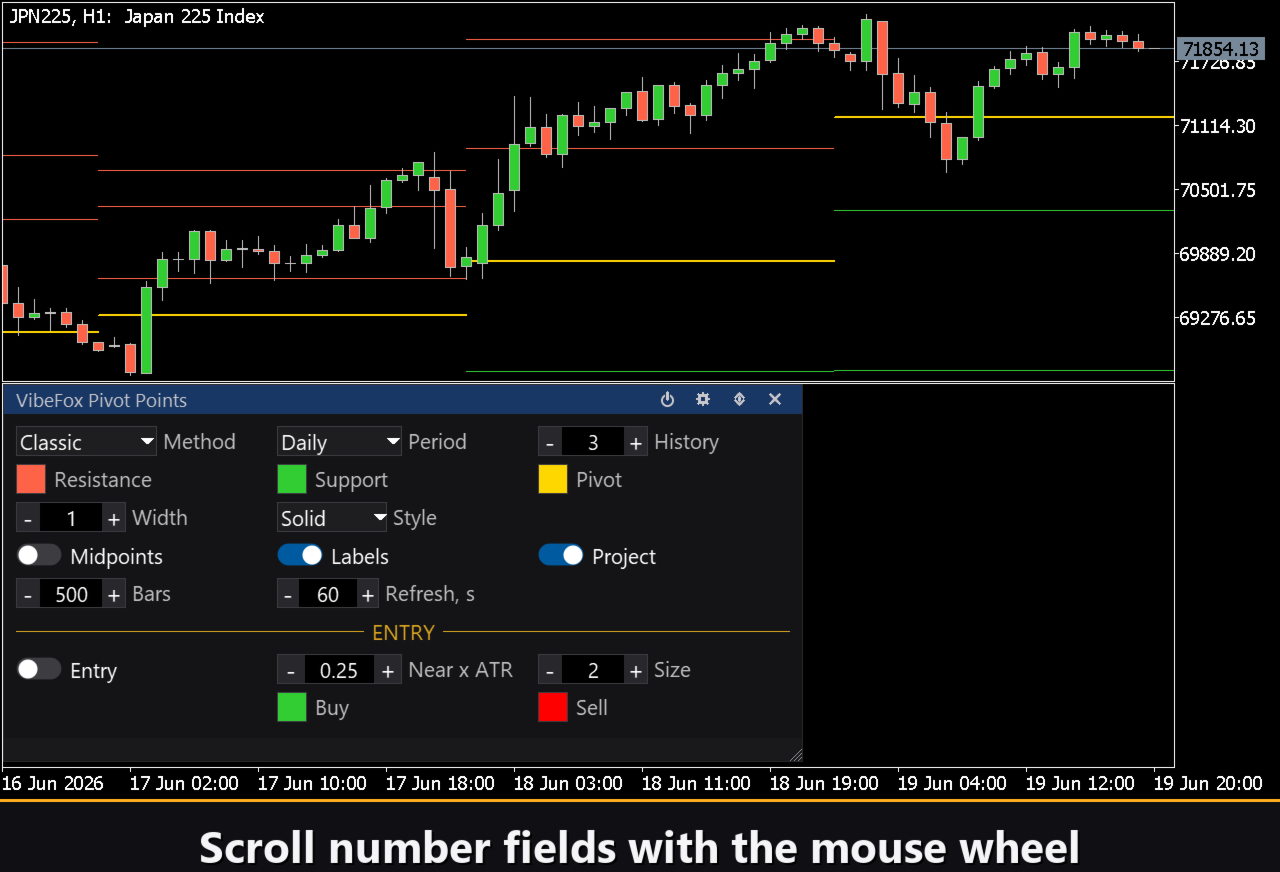
The entire interface is a smooth canvas panel designed for fast mouse interaction. All parameters are arranged in neat rows and the entry settings are highlighted with their own section header so signal controls are never confused with appearance controls. The panel header contains the management icons.
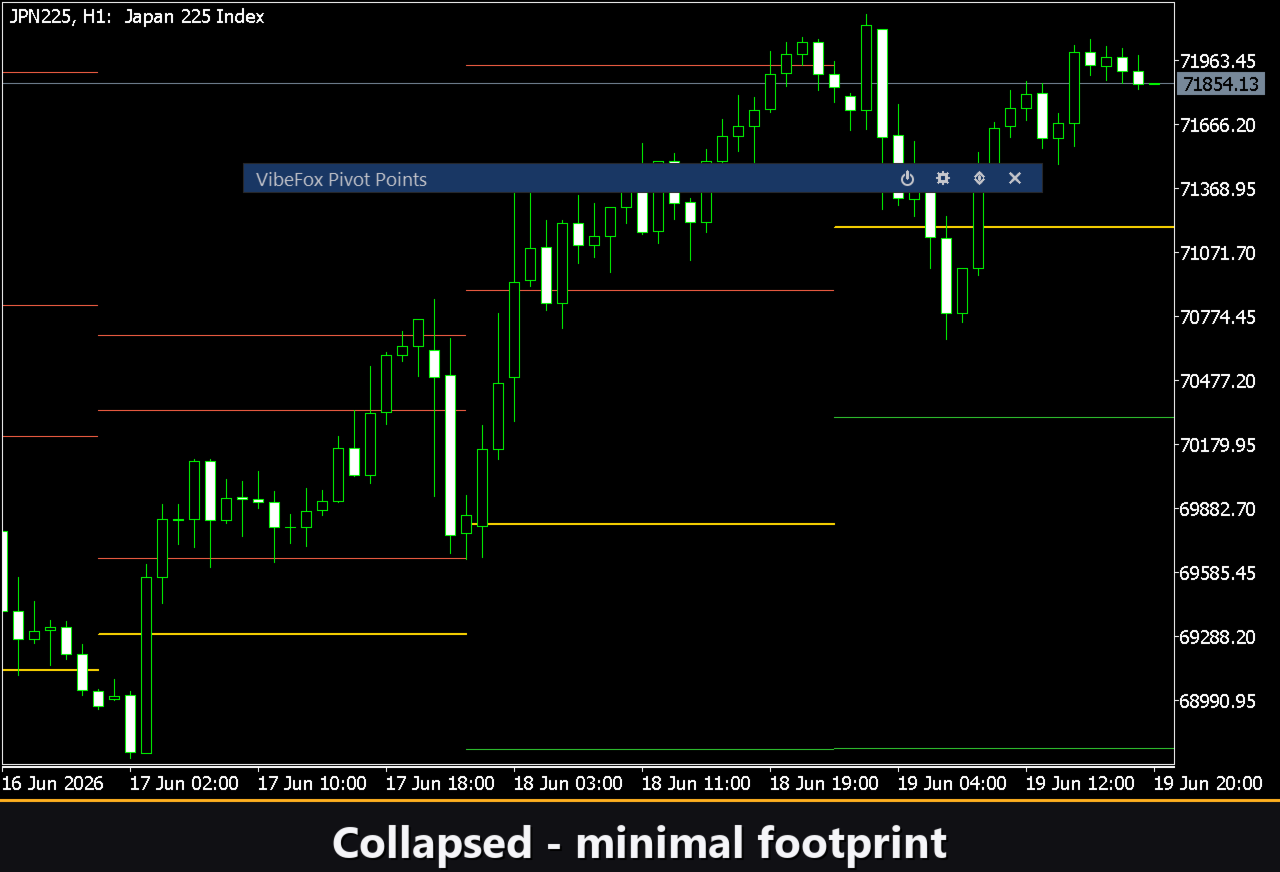
Power — switches drawing of all pivot lines and signals on and off without removing the indicator from the chart.
Settings (gear icon) — opens and closes the settings panel.
Updown (arrows) — moves the panel between the sub-window and the main chart.
Close (cross) — removes the indicator from the chart.
Resizable — drag the bottom-right corner to scale the panel to any size.
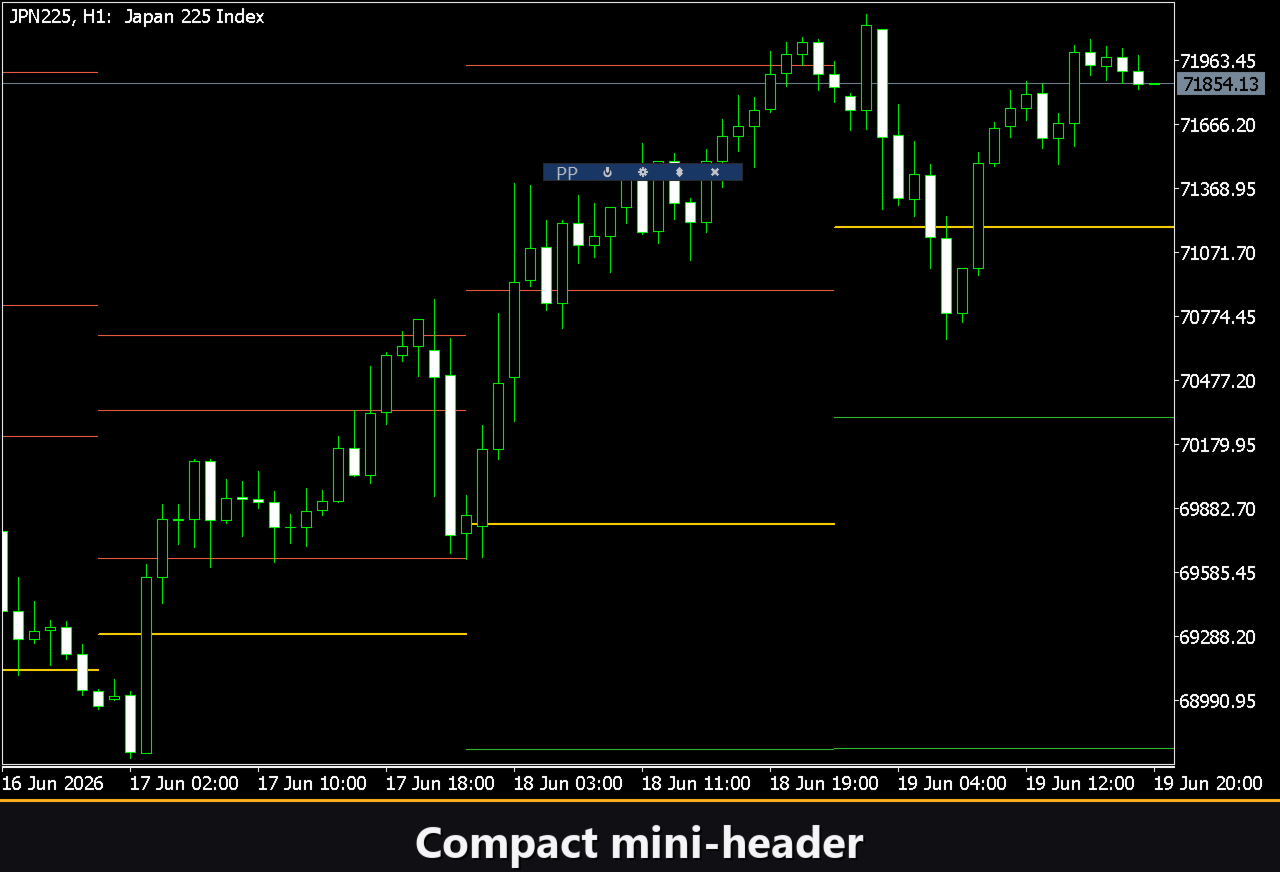
Collapsible — double-click the header to collapse the panel to a compact strip.
Mouse wheel — hover over any numeric field and scroll to change the value without opening the keyboard.
Settings and personalisation
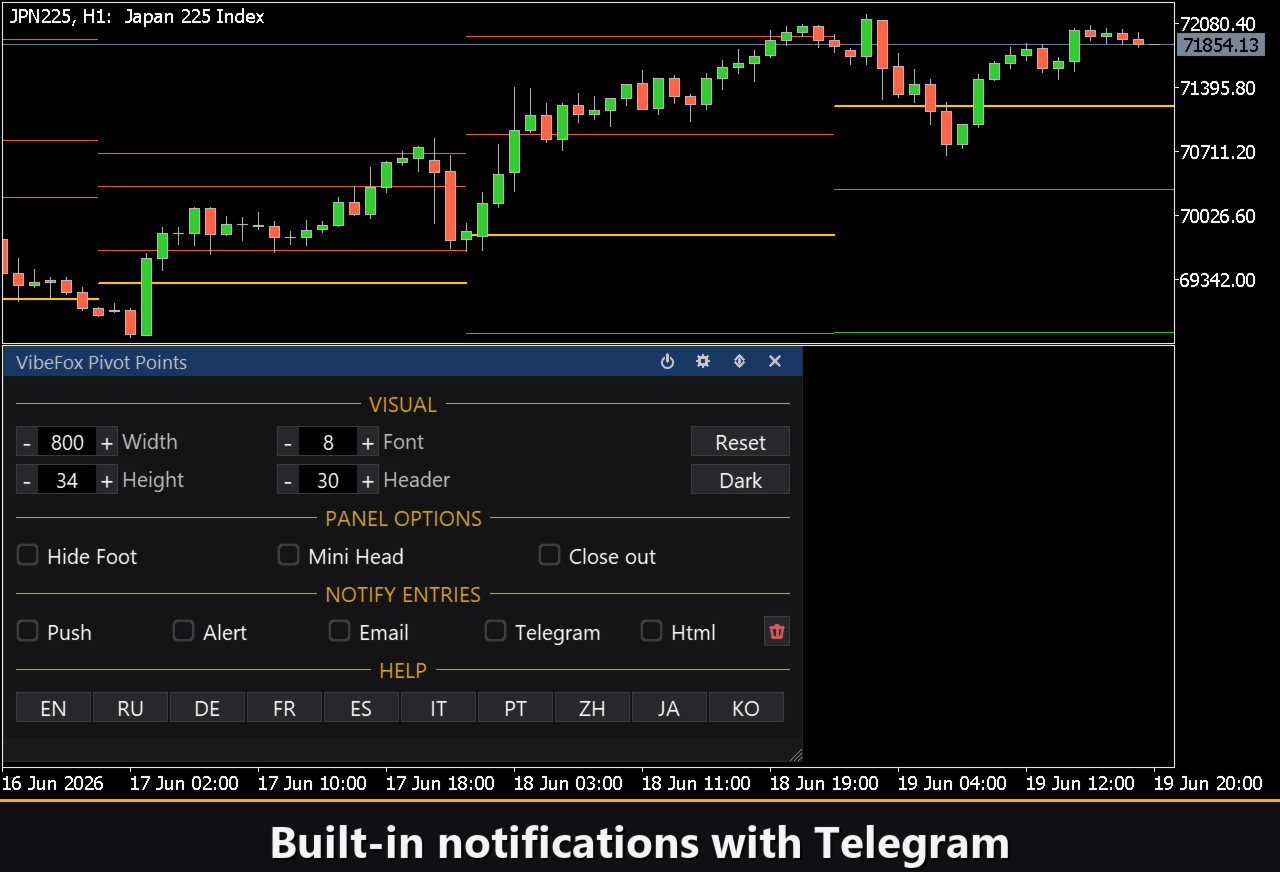
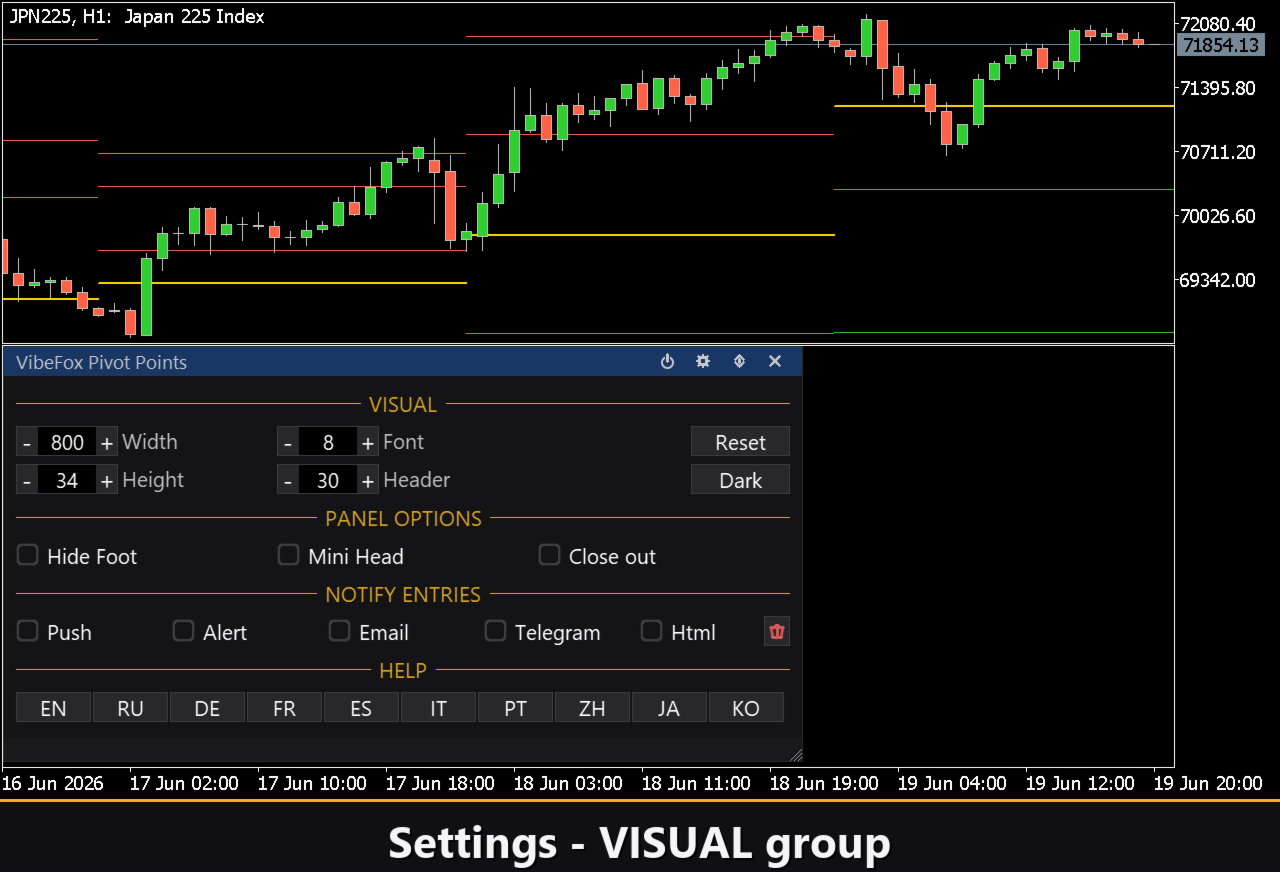
The Settings button opens a section where the panel is fitted to your workspace: light, dark or automatic Theme, configurable panel width, header size, row height and font size. Extra touches let you hide the footer strip via Hide Footer, show a compact header when collapsed with Mini Header, and auto-collapse the panel on a click outside it. Almost all parameters change live on the panel — the Inputs tab only sets starting values. You can also run several independent copies on the same chart by giving each a unique Instance number, letting you monitor different methods or periods side by side.
Entry notifications
You do not need to watch the chart waiting for a signal. Each entry can be delivered through several notification channels that are toggled independently on the panel.
Alert — a pop-up message inside the terminal.
Push — a mobile notification to the MetaTrader app on your phone.
Email — a message sent through the terminal's mail settings.
Telegram — the alert text together with a chart screenshot, sent straight to your Telegram chat.
Enable only the channels you need and you will be notified the moment a new entry appears on the symbol and timeframe you are monitoring.
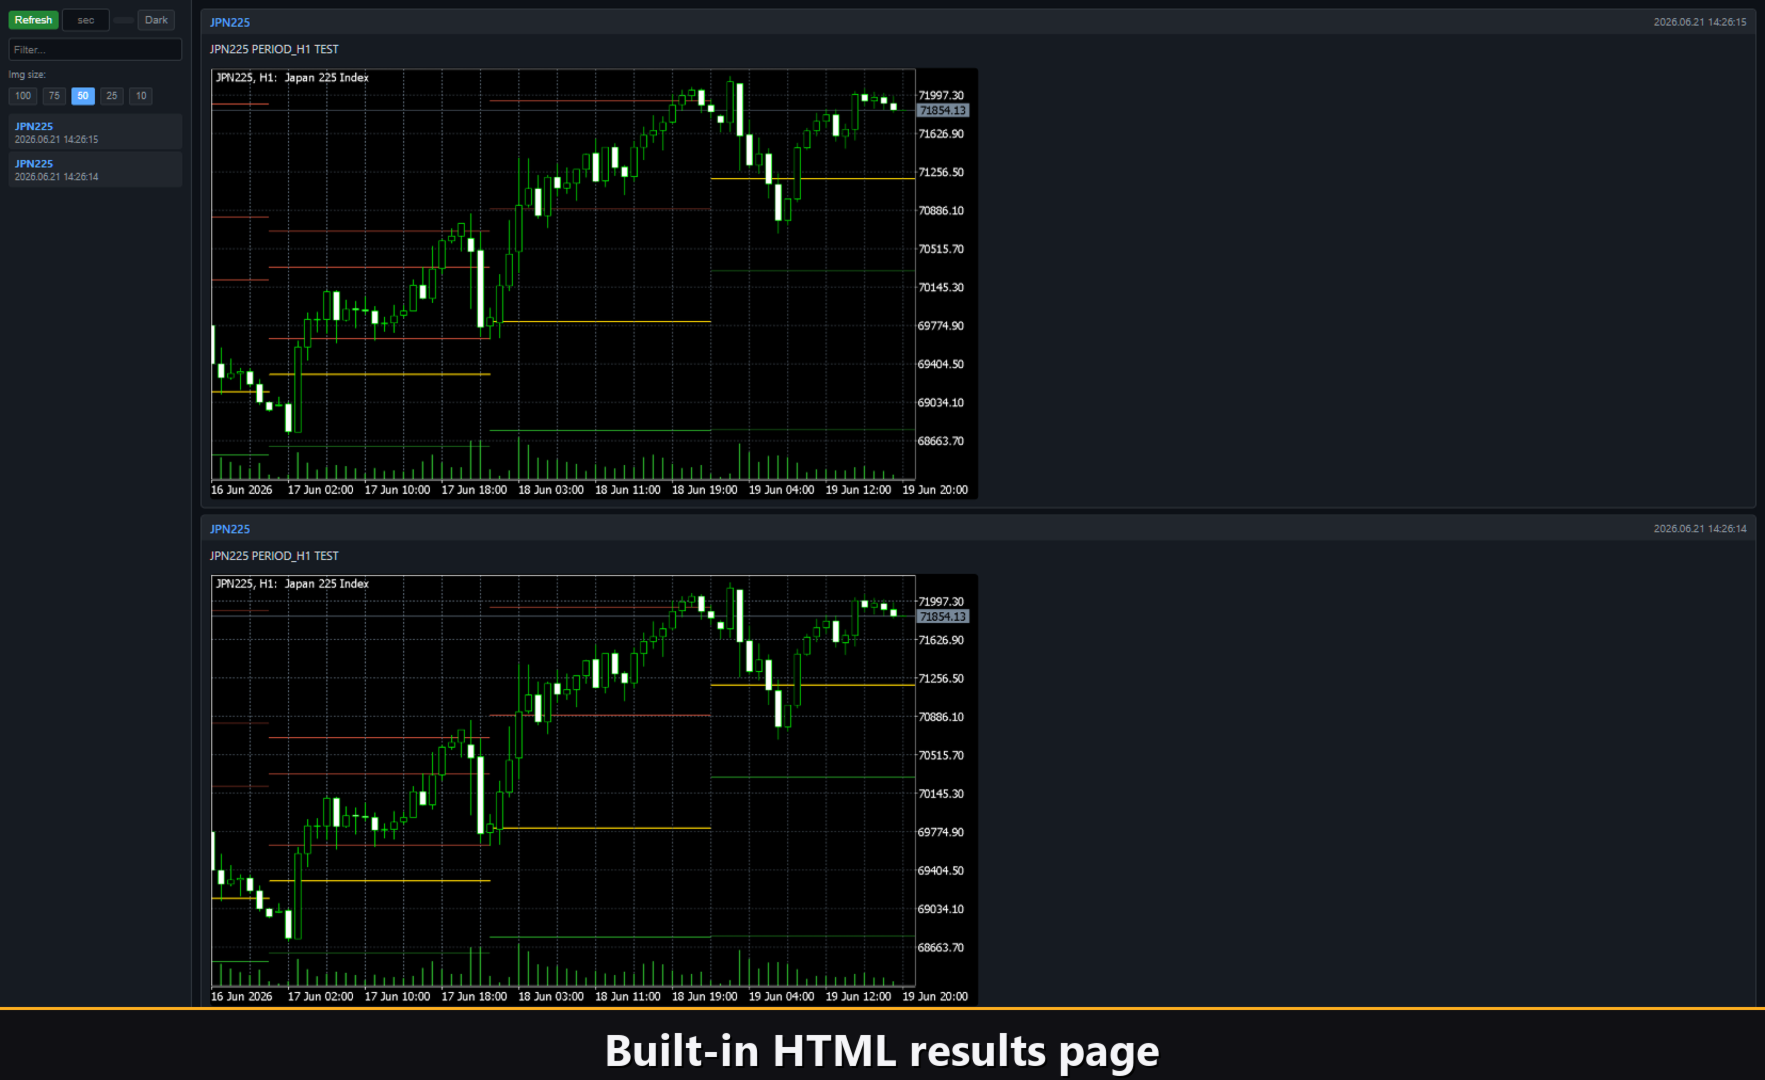
Visual history — Html report
Enable the Html channel and every entry signal is saved to an HTML report together with a screenshot of the chart at the moment of the trigger. The report is stored in the terminal's Files folder, in the VibeFox_PivotPoints sub-directory, and opens in any browser — giving you a visual log of every entry the indicator has found. The trash button clears the report and its screenshots in one click whenever you want to start fresh.
Telegram Alerts
Signals can also be delivered straight to your Telegram chat — the alert text together with a screenshot of the chart at the moment of detection. Turn on the Telegram channel and enter your bot token and chat id in the inputs.
Delivery rides on the HTML report: each new signal is written into the report, and the report — opened in a browser — forwards it to your Telegram chat on its own. For this reason, enabling Telegram automatically keeps the Html report on, and the two channels work together.
Built-in multi-language help
A complete help page is built into the panel and available in 10 languages, so every control is explained right where you use it.
Parameters (Inputs tab)
Most settings can also be changed live directly on the panel (Settings button) — the input parameters only set the initial values at launch.
Pivot
Method — pivot calculation formula: Classic, Camarilla, Woodie, Fibonacci or DeMark. Default: Classic.
Period (prior D/W/M) — source period for the pivot calculation: Daily, Weekly or Monthly. Default: Daily.
History periods to show (1..30) — number of past period pivot sets displayed alongside the current one. Default: 3.
Visual
Resistance Color — colour of resistance levels R1, R2, R3. Default: Tomato.
Support Color — colour of support levels S1, S2, S3. Default: LimeGreen.
Pivot (PP) Color — colour of the central pivot line PP. Default: Gold.
Line Width (1-10) — thickness of pivot lines in pixels. Default: 1.
Line Style — dash pattern of pivot lines (Solid, Dash, Dot, DashDot, DashDotDot). Default: Solid.
Show Midpoints — draw midpoint lines between adjacent pivot levels. Default: off.
Show Labels — display level name labels at the right end of each line. Default: on.
Project current period right — extend the current period's lines to the right chart edge. Default: on.
Entry Points
Level Touch signal — enables the Level Touch entry signal: fires when price closes within Touch tolerance of any pivot level. Default: off.
Touch tolerance (x ATR) — proximity band expressed as a multiple of the ATR; determines how close price must come to a level to trigger the signal. Default: 0.25.
Notifications
Push Notification — push notification to the mobile MetaTrader app. Default: off.
Alert Popup — pop-up Alert window inside the terminal. Default: off.
Email — message sent through the terminal's mail settings. Default: off.
Html — saves each signal with a chart screenshot to an HTML report (Files folder, VibeFox_PivotPoints directory), opens in any browser. Default: off.
Telegram — send each signal to your Telegram chat (alert text plus a chart screenshot) through the HTML report. Default: off.
Telegram bot token — the token of your Telegram bot, used to send the messages.
Telegram chat id — the id of the Telegram chat that receives the signals.
Panel / Settings
Panel width, px (300..800) — panel width in pixels. Default: 800.
Header size (1..6) — header size. Default: 1.
Theme — colour theme: Auto (follows chart), Dark or Light. Default: Auto.
Row height (px) — row height of the panel in pixels. Default: 34.
Font size — panel font size. Default: 8.
Hide Footer — hide the bottom strip of the panel. Default: off.
Mini Header on collapse — show a mini header when the panel is collapsed. Default: off.
Close on click outside — collapse the panel on a click outside it. Default: off.
Instance (unique per copy: 1,2,3...) — instance number; allows multiple independent copies on the same chart. Default: 1.
Panel Start Window — where the panel opens at launch: Subwindow or Chart. Default: Subwindow.