Meravith Scanner

5

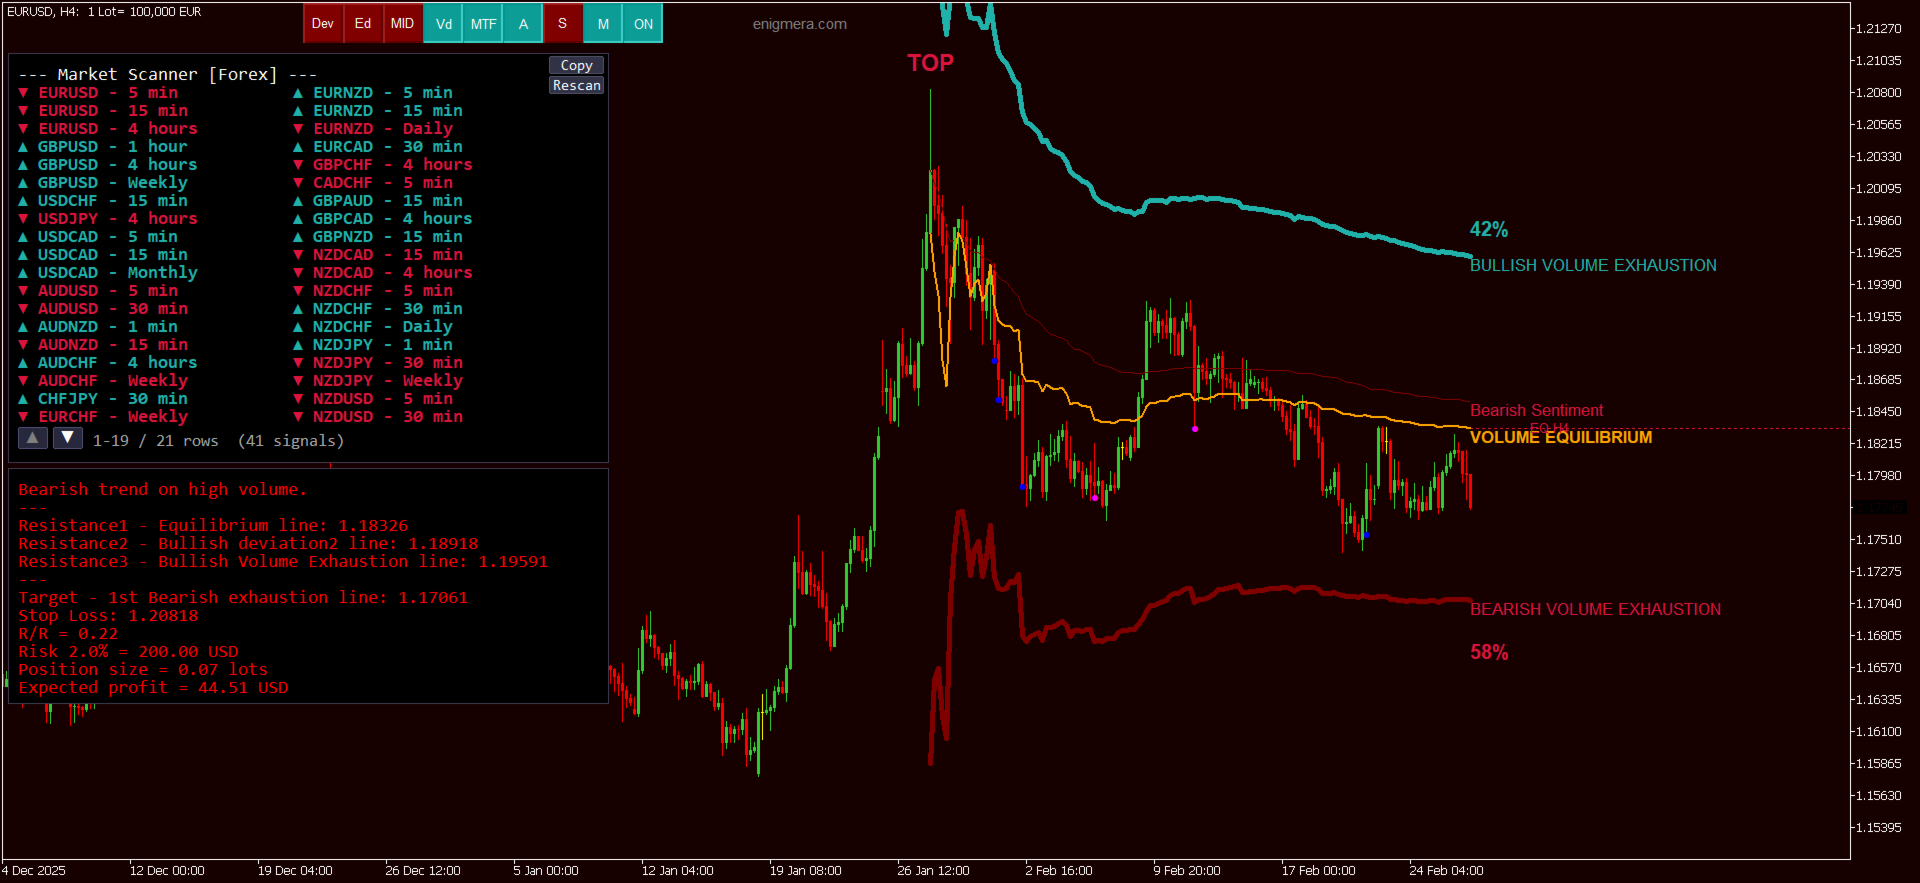
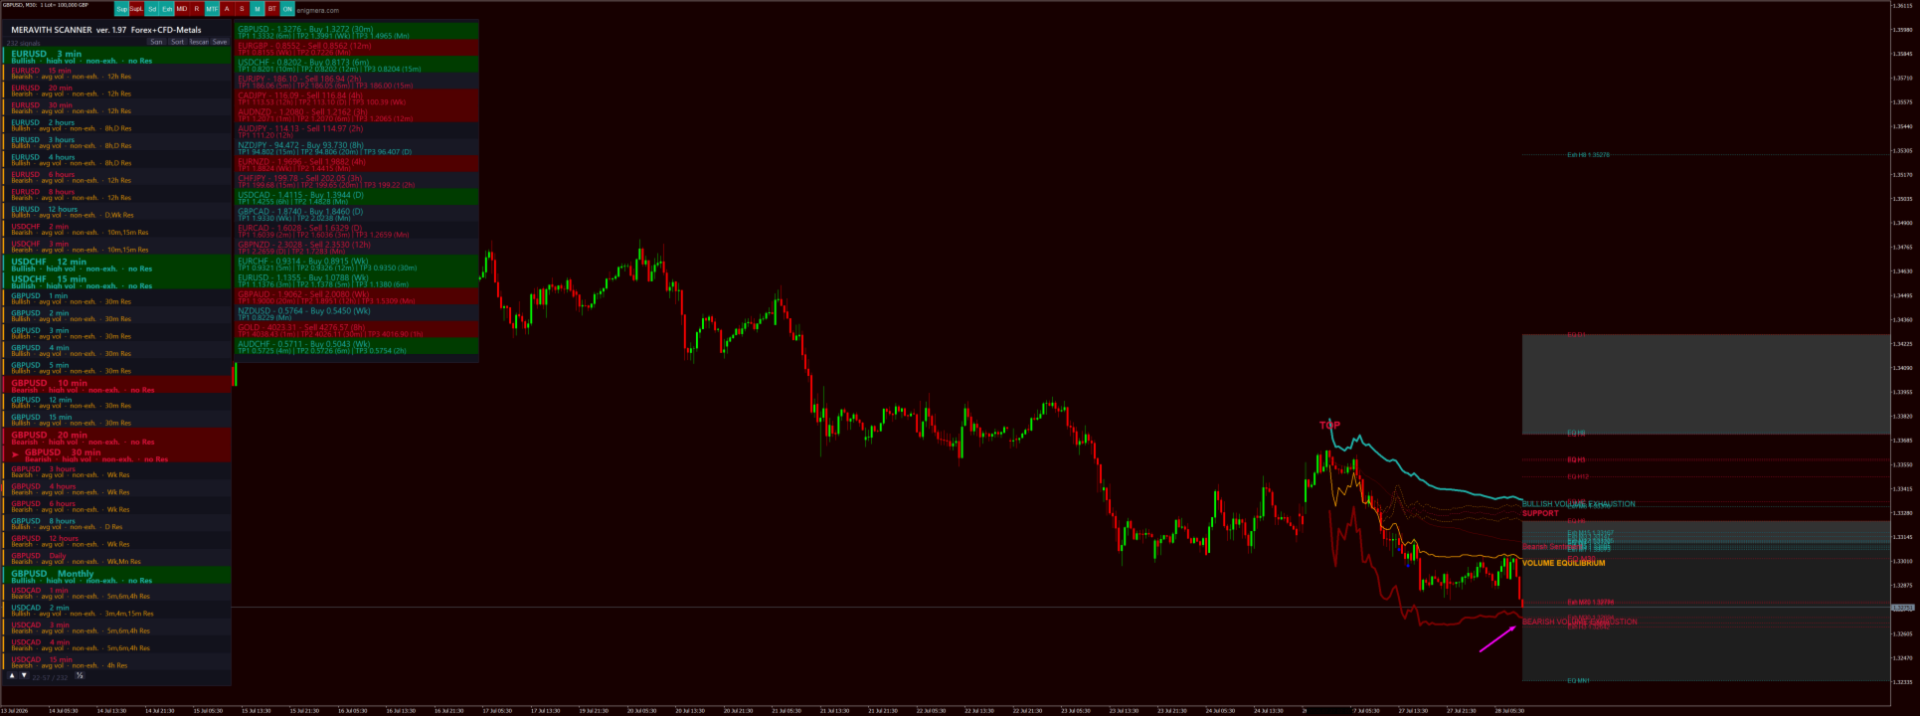
MERAVITH SCANNER는 MetaTrader 5용 전문 금융 시장 지표로, 여러 분석 도구를 하나의 통합 시스템으로 결합합니다. 독점적인 거래량 가중 평균 가격(VWAP) 방법론을 사용하여 모든 계산을 자동으로 수행하며, 주관적인 해석을 완전히 배제합니다.

이 지표는 모든 자산 클래스(Forex, 주식, 지수, 상품, 암호화폐)와 M1부터 월간 차트까지 모든 시간 프레임에서 작동합니다. 기본 원리는 “가격은 거래량을 따른다”입니다. MERAVITH는 기관 거래량이 집중되는 위치를 식별하고, 그 집중에서 수학적으로 정확한 가격 수준을 도출합니다. 예측이나 투기를 하지 않으며, 계산만 수행합니다.

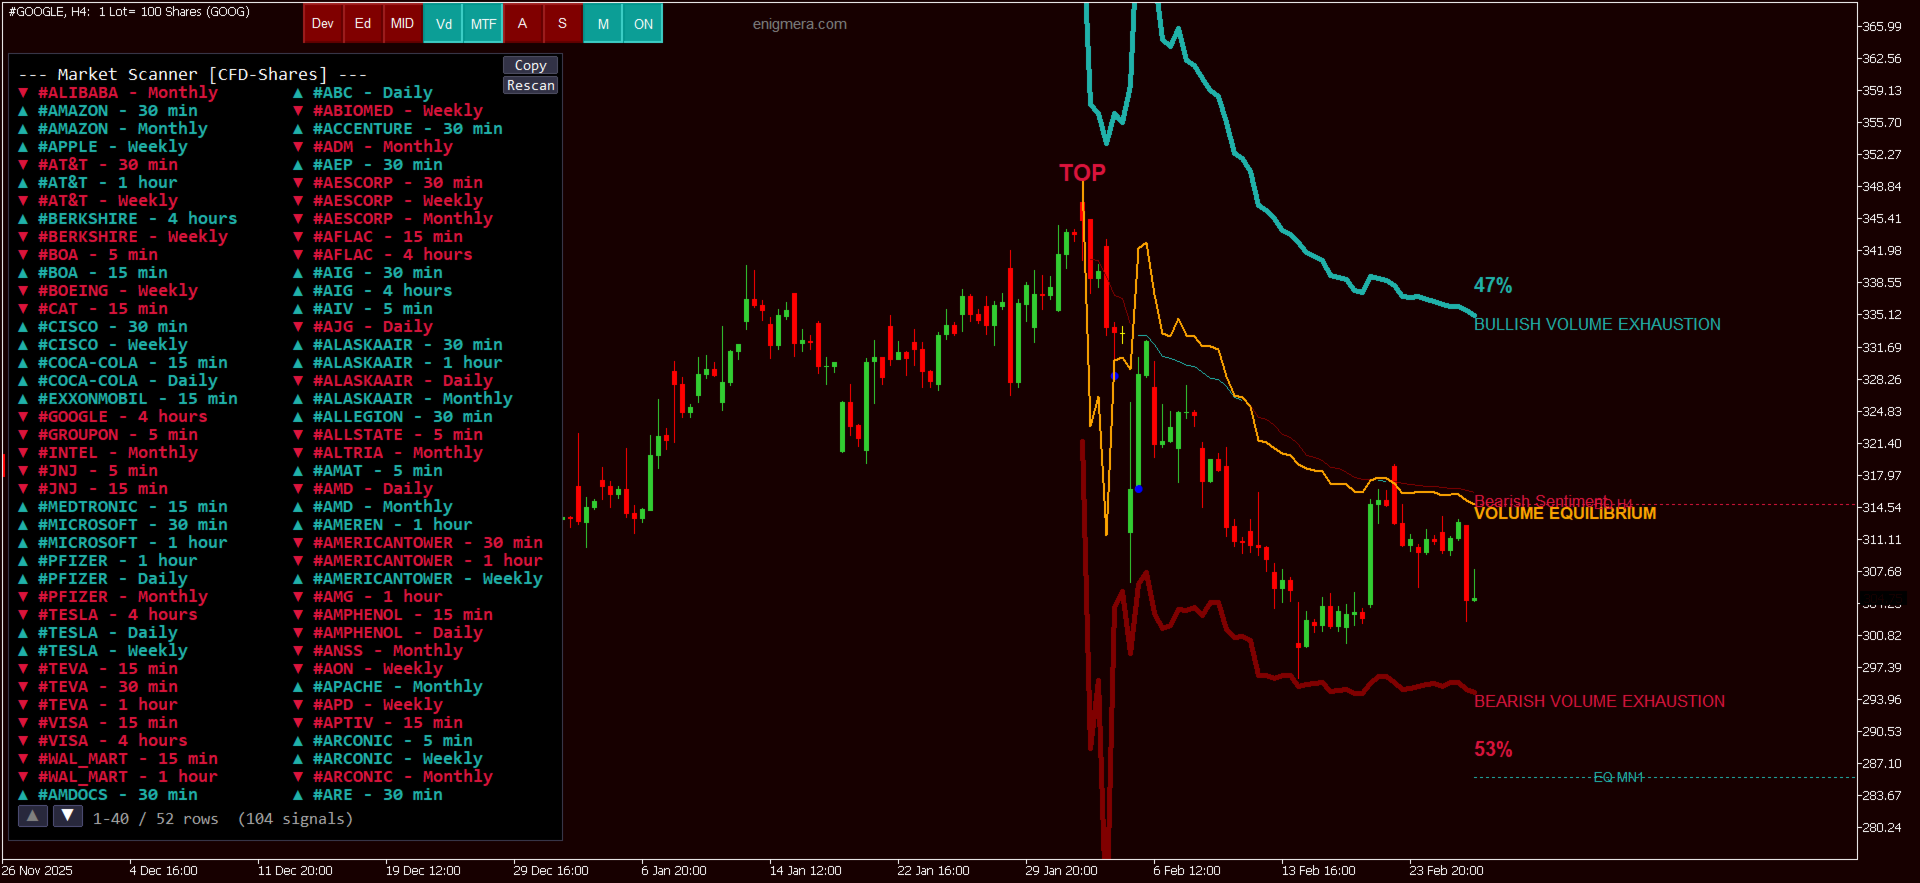
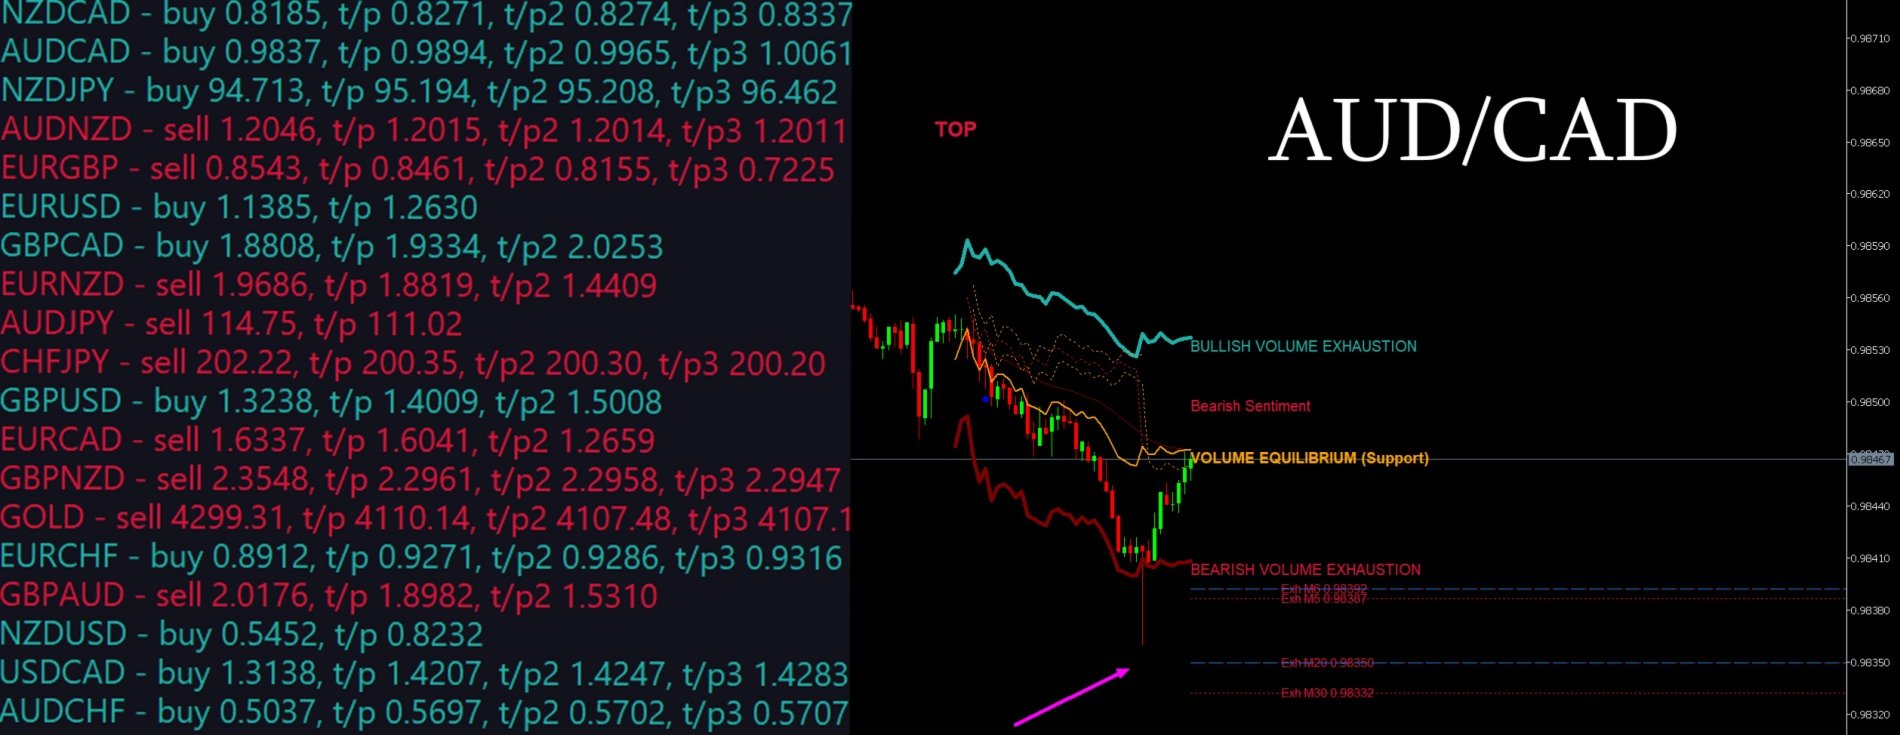
MERAVITH SCANNER를 사용하면 28개의 주요 Forex 통화쌍을 모든 시간 프레임에서 단 2~3분 만에 스캔할 수 있습니다. 또한 원하는 시장을 스캔할 수도 있으며, 예를 들어 약 100개의 주식을 약 10분 안에 스캔할 수 있습니다.

지표는 소진 레벨, 균형선, 편차, 통계 레벨, 목표 예측을 도출합니다.

차트 요소

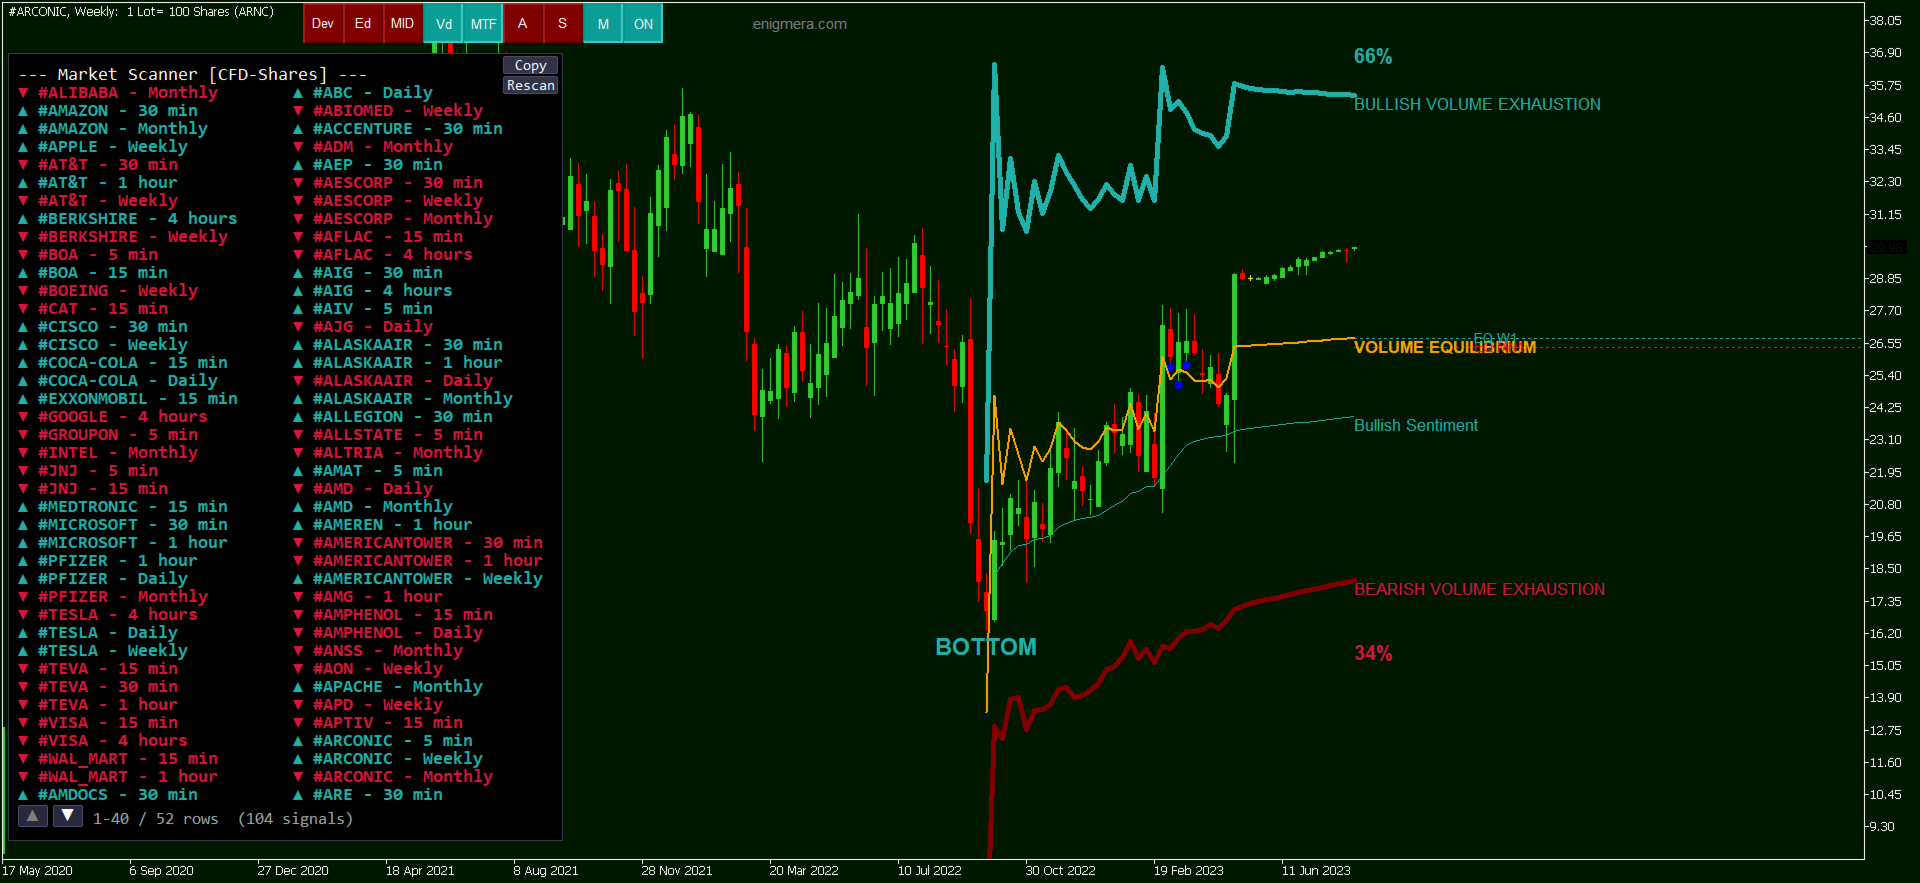
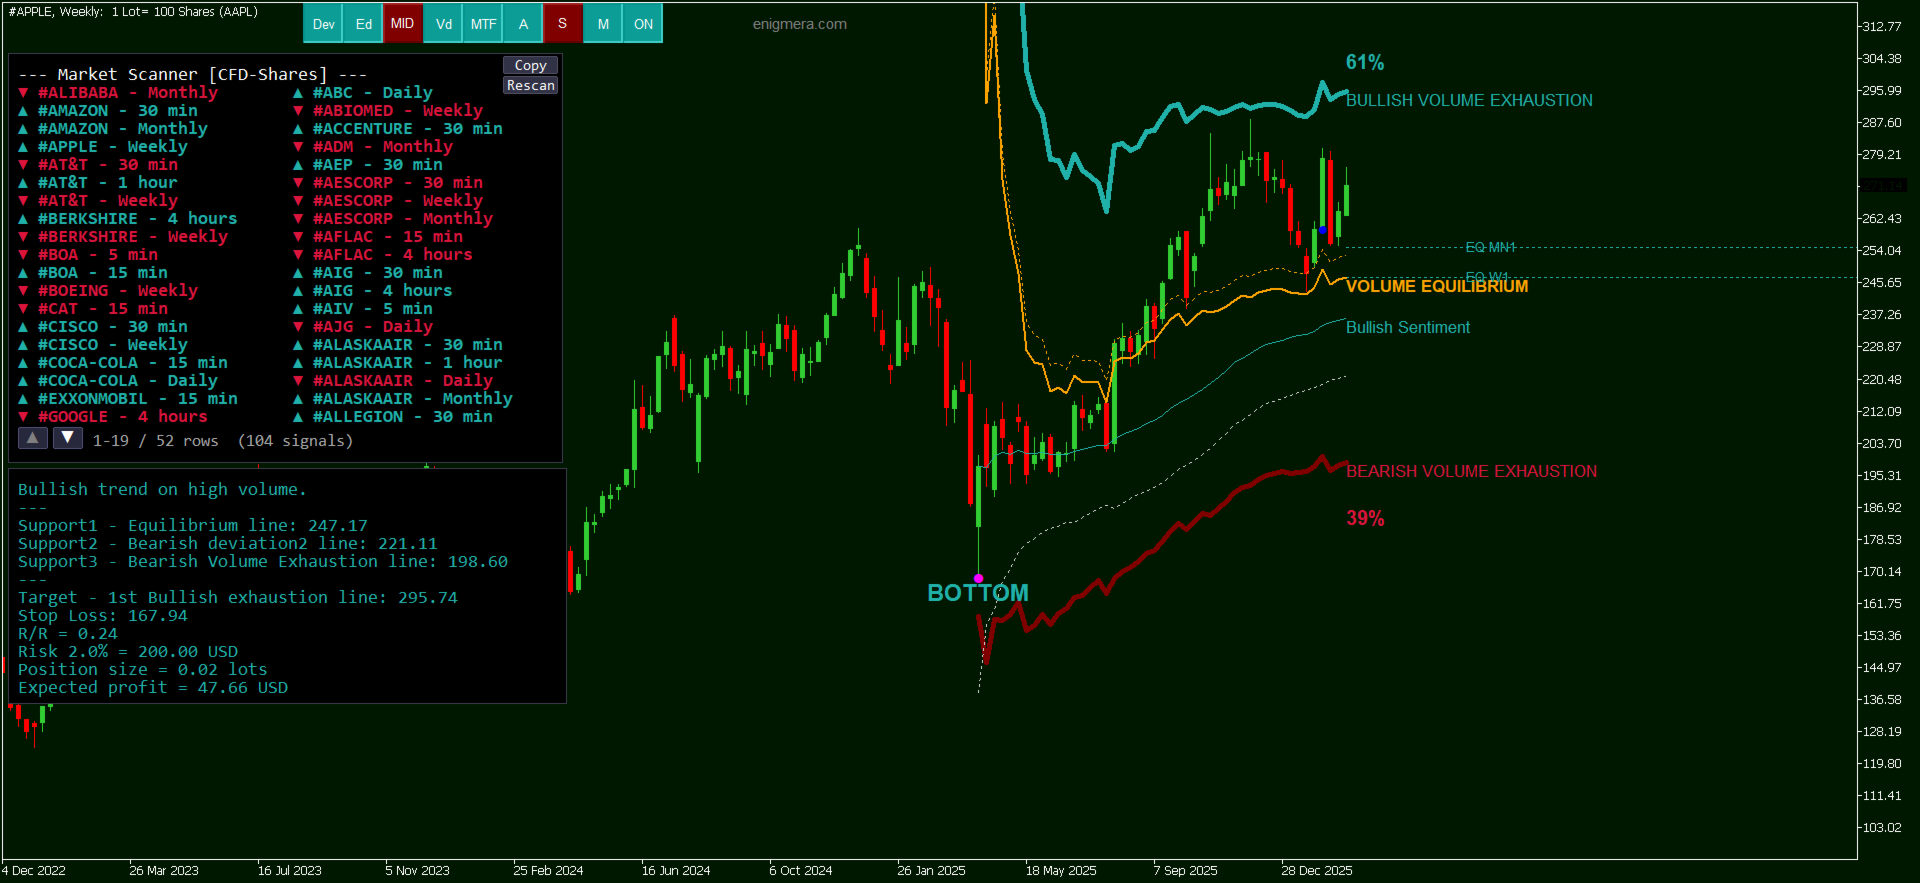
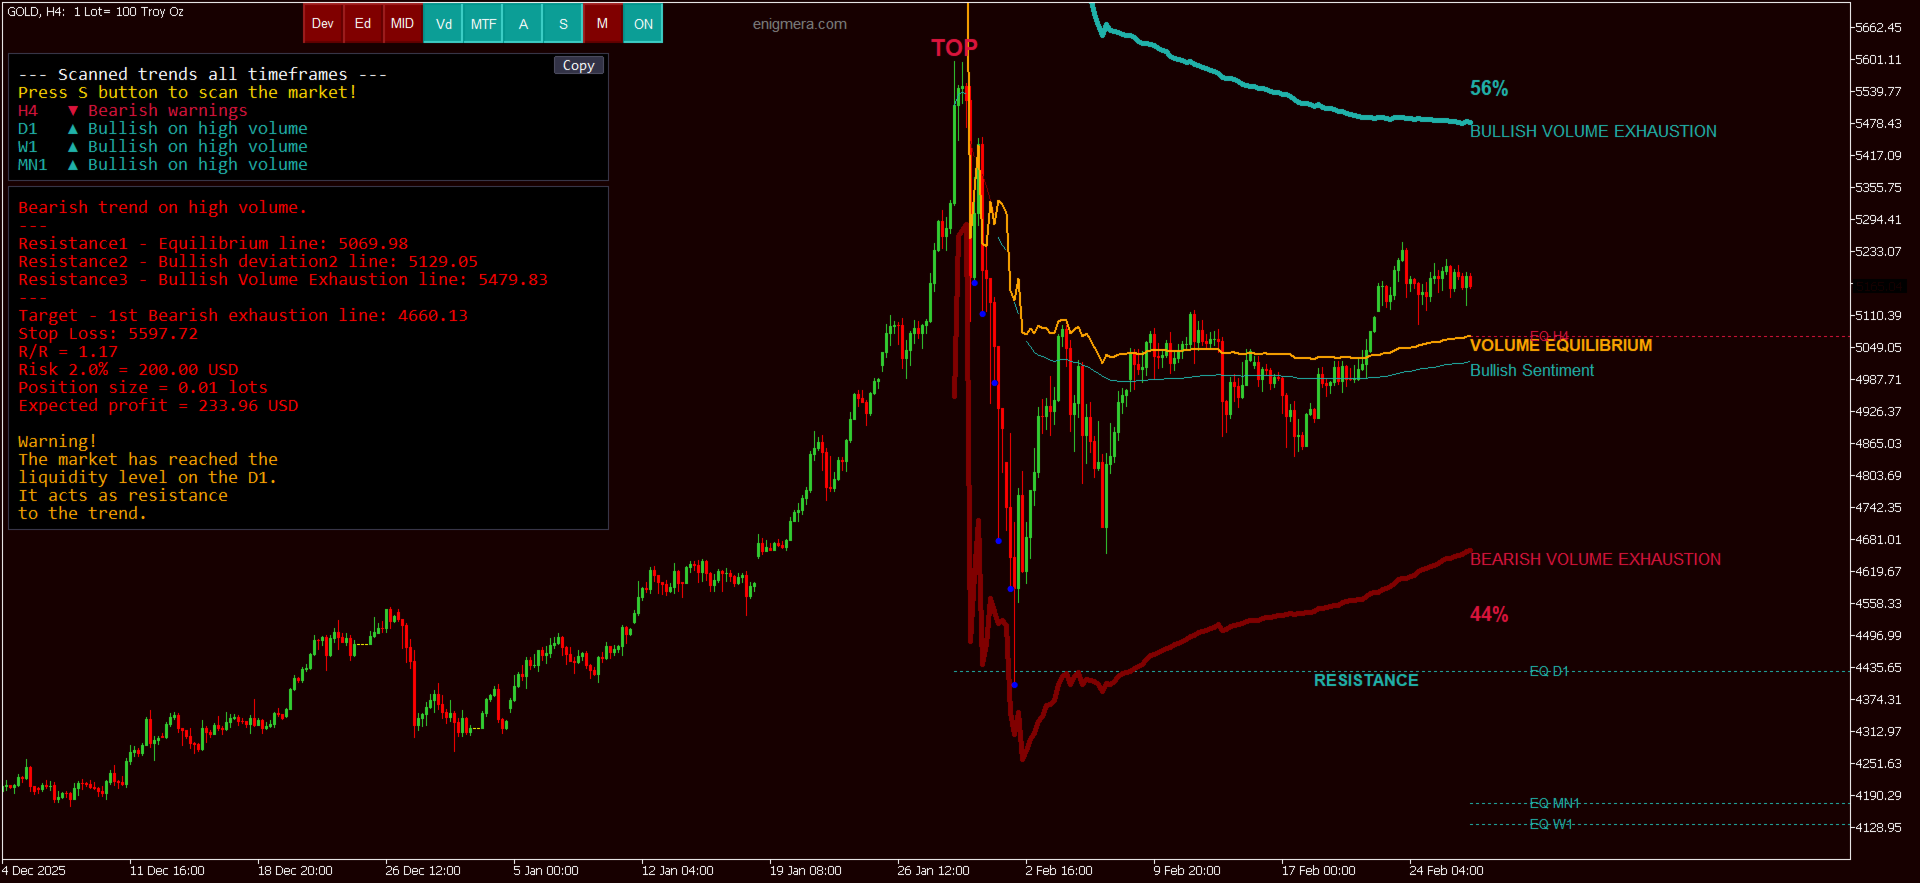
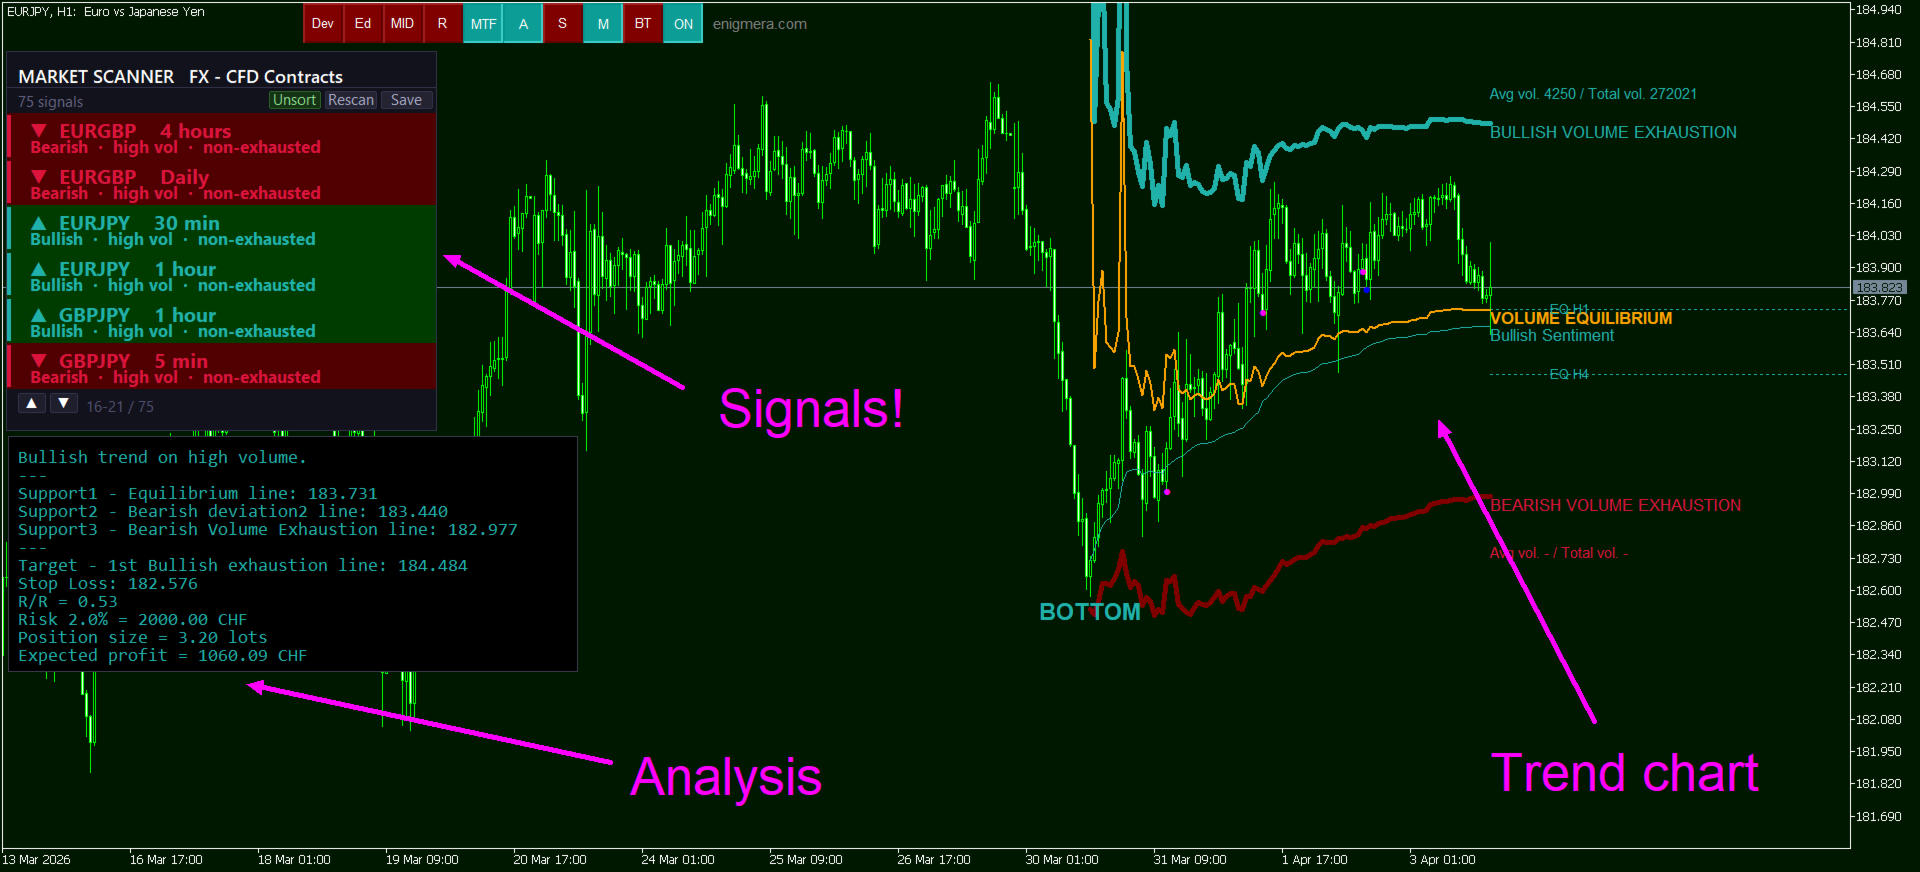
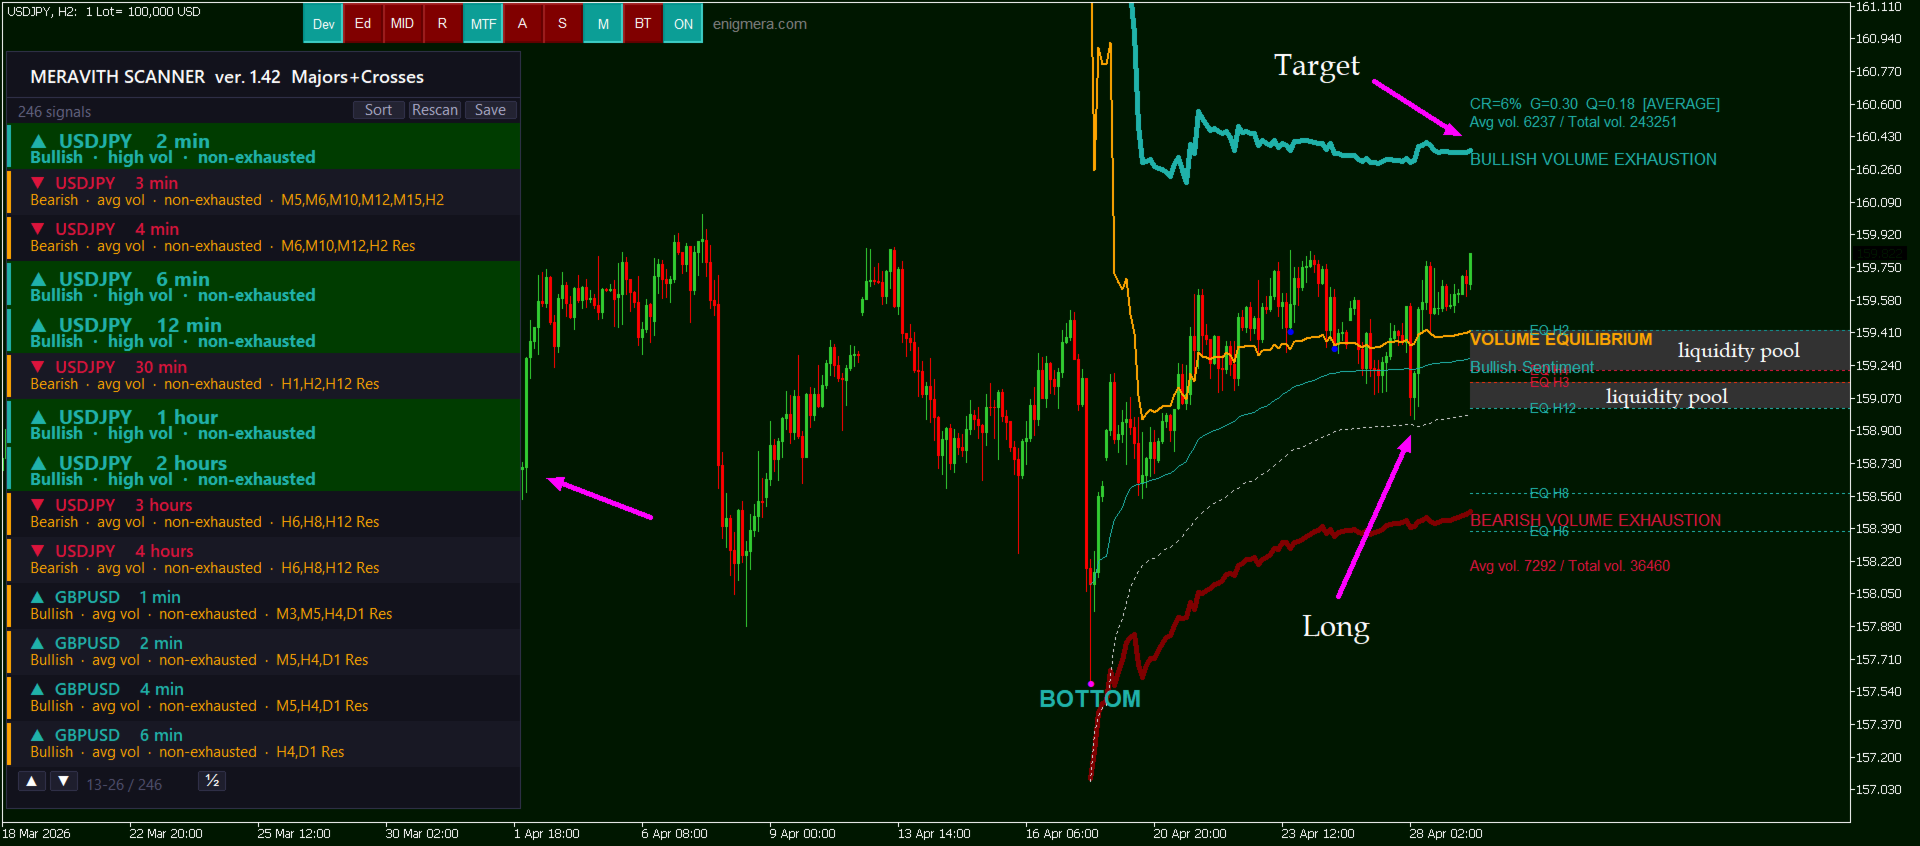
Origin Point: 모든 계산이 시작되는 지점을 표시합니다. 지표는 최적의 위치에 자동으로 배치합니다. 빨간 라벨(TOP)은 약세 편향의 시장 고점을 나타내며, 초록 라벨(BOTTOM)은 강세 편향의 시장 저점을 나타냅니다.

Sentiment Line: 거래량 가중 계산에서 파생된 시장 심리를 반영하는 동적 곡선입니다. 빨강은 약세, 초록은 강세, 흰색은 드문 전환 상태를 나타냅니다.

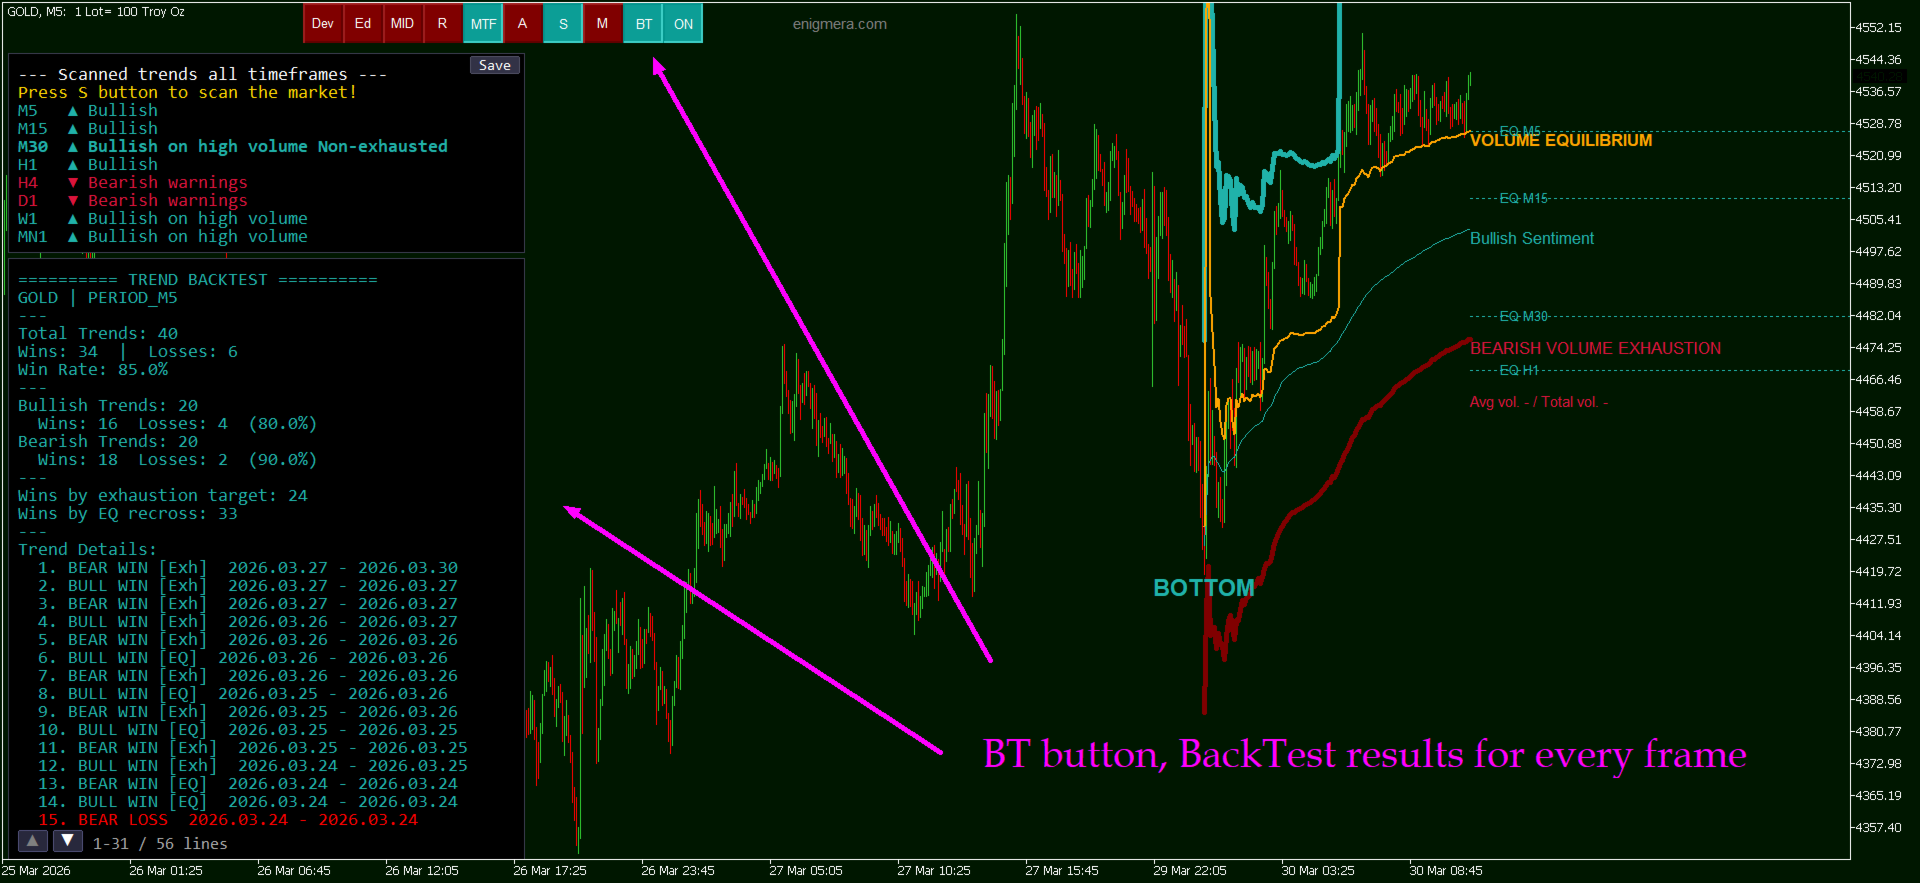
Exhaustion Lines: 방향성 거래량이 소진되는 지점을 나타내는 굵은 실선입니다. 굵은 초록선은 강세 소진 레벨(상향 목표)을, 굵은 빨간선은 약세 소진 레벨(하향 목표)을 나타냅니다. 이 레벨은 순차적으로 최대 12단계까지 표시됩니다. 새로운 레벨은 이전 레벨 도달 후에만 나타납니다. 레벨이 더 이상 나타나지 않으면 움직임은 완전 소진에 근접합니다.

Volume Equilibrium Line: 가장 높은 강세 소진 레벨과 가장 낮은 약세 소진 레벨 사이의 중간점을 나타내는 주황색 실선입니다. 주요 거래량이 집중되는 유동성 축으로 작동하며, 강세 추세에서는 동적 지지, 약세 추세에서는 동적 저항, Stop Loss 참조점으로도 사용됩니다. 지속적인 돌파는 현재 추세 가설을 무효화합니다.

Volume Dots: 통계적으로 유의한 거래량이 있는 캔들 아래에 표시됩니다. 파란 점은 거래량이 2 표준편차를 초과함을 나타내며, 중요한 기관 활동을 의미합니다. 보라색 점은 거래량이 3 표준편차를 초과함을 나타내며, 매우 강력한 기관 참여를 의미합니다. 균형선 한쪽에만 점이 나타나면 추세를 확인할 수 있고, 양쪽에 나타나면 횡보장 가능성이 있습니다.

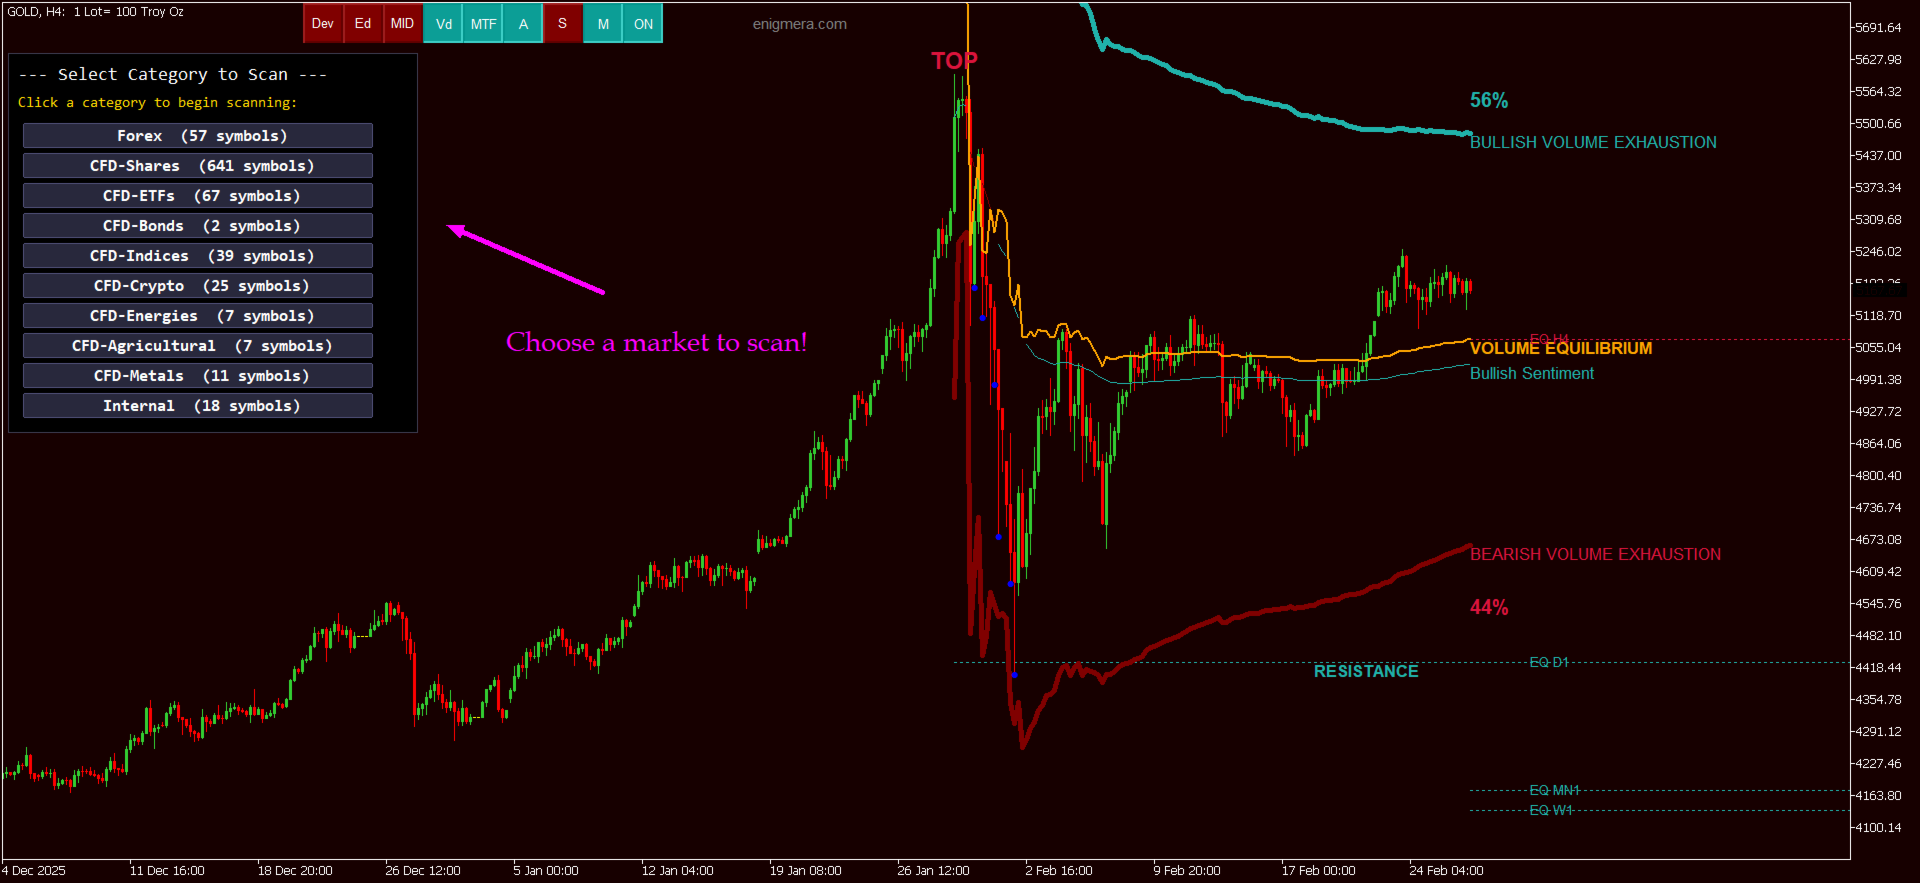
MTF Horizontal Lines: 상위 시간 프레임의 점선 수평 균형선입니다. H1 차트를 보면 H4, D1, W1, MN1의 선이 표시됩니다. 초록색 선은 해당 시간 프레임의 강세 추세, 빨간색 선은 약세 추세를 나타냅니다. 가격이 상위 시간 프레임 균형선에 접근하면서 반대 추세일 경우, 선이 깜박이며 “RESISTANCE” 라벨이 나타납니다.

차트 배경색은 즉각적인 방향 인식을 제공합니다. 진한 초록색 배경은 강세, 진한 빨강 배경은 약세를 나타냅니다.

제어 버튼

지표 상단에는 9개의 제어 버튼이 있습니다. 초록색은 활성, 진한 빨강은 비활성을 나타냅니다.

  • Dev (Deviation): 거래량 가중 평균으로부터 두 배 편차를 나타내는 추가 편차선을 표시합니다. Stop Loss 조정 또는 반전 구간 식별용 보조 레벨 제공.

  • Ed (Equilibrium Deviation / Channel): 균형선 주위에 변동성 채널을 그립니다. 가격은 일반적으로 채널 내에서 움직이며, 채널 경계 돌파는 비정상적으로 강한 방향성 움직임을 신호합니다.

  • MID (0%, 50%, 100% Levels): 현재 추세의 가격 범위를 정의하는 노란색 점선 3개를 표시합니다. 50% 레벨은 되돌림 참조로 사용됩니다. 0% 아래로 하락하면 추세가 종료되었을 가능성이 있습니다.

  • Vd (Volume Dots): 통계적으로 유의한 거래량의 파란색 및 보라색 점을 표시/숨기기 전환합니다. 추세 확인에 중요하며 항상 활성 상태를 권장합니다.

  • MTF (Multi-Timeframe Lines): 상위 시간 프레임의 수평 점선 균형선을 표시/숨기기 전환합니다. 낮은 시간 프레임에서는 보이지 않는 구조적 장벽을 드러냅니다. 항상 활성 상태 권장.

  • A (Analysis): 추세 방향, 거래량 품질, 지지/저항 레벨, 목표, Stop Loss, 위험/보상 비율, 포지션 크기, 예상 수익, 상위 시간 프레임 목표, 활성 경고 등 종합 분석 패널 표시.

  • S (Scan / Multi-Timeframe Trend Summary): 현재 시간 프레임부터 월간까지 모든 시간 프레임의 추세 방향 표시. “Non-exhausted” + 높은 거래량 굵은 행은 가장 신뢰도 높은 신호. 클릭 시 해당 시간 프레임으로 차트 전환. Copy 버튼으로 텍스트 파일로 내보내기 가능.

  • M (Market Scanner): 브로커가 제공하는 모든 종목을 9개의 시간 프레임에서 자동 분석하는 종합 스캐너. 카테고리 선택 후 스캔 실행. 최적 조건 종목만 색상 패널에 표시. 클릭 시 즉시 차트 이동. 이전 카테고리 결과는 캐시 보존. Rescan 버튼으로 현재 카테고리 재스캔 가능.

  • ON/OFF: 지표 전체 켜기/끄기. 비활성화 시 모든 선, 레벨, 패널은 숨겨지고 버튼만 표시됨.

알림 시스템

차트에서 세 번 클릭하면 해당 가격에 노란색 점선 수평 알람선 생성. 가격 도달 시 경고 대화창 표시, 소리 재생, 선택 시 이메일, 푸시 알림 또는 스크린샷 전송. 클릭하면 제거 가능.

설정 가능한 알림 옵션: 이메일 알림, 모바일 푸시 알림, 균형선 터치 알림, 역추세 거래량 알림, 첫 소진 레벨 도달 알림.

리스크 관리

RiskPercent 입력(기본값 2%)은 거래당 계좌 자산 위험 비율을 설정합니다. 분석 패널은 자동으로 적절한 로트 크기와 예상 수익 계산.

입력 파라미터

  • IndicatorID — 동일 차트에서 여러 인스턴스 사용 가능.

  • IgnoreWeekendBars — D1에서 토요일/일요일 바 제외, 권장: 활성화.

  • ShowFirstTouchDots — 첫 소진 레벨 접촉 시 다이아몬드 마커 표시.

  • RiskPercent — 거래당 위험 비율, 기본 2%.

  • BlinkVolumeDots — 경고 활성 시 거래량 점 깜박임.

  • EnableEmailAlerts — 이메일 알림 활성화.

  • EnablePushAlerts — 모바일 푸시 알림 활성화.

  • EnableEquilibriumAlert — 균형선 도달 시 알림.

  • EnableWrongSideDotAlert — 추세 반대쪽 거래량 점 출현 시 알림.

  • EnableExhaustionAlert — 첫 소진 레벨 도달 시 알림.

  • EnableChartScreenshot — 알림 시 자동 스크린샷 FTP 전송.

  • AutoScanTFTrend — 모든 시간 프레임 주기적 자동 스캔.

  • AutoScanIntervalMin — 자동 스캔 간격(분).

  • 버튼 배경, 텍스트, 라벨 색상 사용자 지정 가능.

이 지표는 브로커가 제공하는 모든 종목과 모든 시간 프레임에서 작동합니다. 상위 시간 프레임일수록 강력하고 신뢰성 높은 레벨 생성. 모든 레벨은 알고리즘 계산되며, 동일 차트에서 MERAVITH를 사용하는 10명의 트레이더가 동일한 레벨을 관찰할 수 있습니다. 소진 레벨은 표준편차에서 도출되며, 연속된 높은 소진 레벨에 도달할수록 평균 회귀 확률이 증가합니다.
리뷰 2
Mase
1794
Mase 2026.07.04 09:03 
 

like all of Ivans Indicators big value add. In this case its masterpiece, highly recommend it. As always Ivan is very supportive and steady improving, its big joy with him. Big thx Ivan

Valeriu-alexandru Petrache
183
Valeriu-alexandru Petrache 2026.03.24 21:53 
 

The best system on the market. I recommend it with pleasure. Ivan has the best indicators and the most profitable systems. He is a wonderful man, who is happy to help you and who works on improvements every day.

추천 제품
Win43 Scalper
Eadvisors Software Inc.
O novo s43 Scalper para Mini-Índice (WIN-IND) faz operações de curto prazo no timeframe 1min buscando pequenas variações do mercado, utiliza nova tecnologia de trade, os resultados no intraday são íncríveis, confira:      Após a instalação adicione no gráfico dos instrumentos win para visualizar os resultados no backteste. Recomendamos o timeframe de 1min.
BTC 퀀텀 AI 스캘퍼 PRO 메타트레이더 5용 전문가용 비트코인 ​​AI 트레이딩 지표 BTC 퀀텀 AI 스캘퍼 PRO는 고전적인 기술 분석, 시장 심리 분석, 그리고 독자적인 AI 기반 확률 엔진을 결합한 차세대 비트코인 ​​트레이딩 시스템입니다. 이동 평균이나 오실레이터에만 의존하는 기존 지표와 달리, 이 시스템은 다음과 같은 여러 핵심 시장 요소를 동시에 분석합니다. • 공포/탐욕 지수 • 펀딩 비율 • 펀딩 비율 델타 • 미결제 약정 델타 • 롱/숏 비율 • 매수/매도 비율 • 거래량 델타 • 암호화폐 뉴스 심리 이러한 데이터 소스를 기반으로, 이 지표는 독자적인 AI 점수를 계산하고 가장 강력한 거래 기회만을 식별합니다. 주요 기능 매수/매도 신호 확률 기반 거래 필터링 TP1 및 TP2 목표가 설정 동적 손절매 실시간 알림 추세 확인 시스템 시각적 거래 관리 레벨 추천 사용 사례 • 비트코인 ​​스캘핑 • 데이 트레이딩 • 모
Mean Reversion Supply Demand Indicator Mean Reversion Supply Demand is the indicator to detect the important supply demand zone in your chart. The concept of supply demand trading relies on the quantity mismatching between buying and selling volumes in the financial market. Typically, supply demand zone serves to predict the turning point. The wave pattern, for any supply demand zone to work as an successful trade, looks like the price must touch the base zone, move away and then return to zone
PREngulfing
Slobodan Manovski
PR EA - Engulfing Pattern Trading System Automated Engulfing Pattern Detection with MA Confirmation The PR EA is a Meta Trader 5 expert advisor that identifies and trades bullish/bearish engulfing candlestick patterns when confirmed by a moving average filter. Designed for swing trading on 30-minute charts with compatibility for M15 and H1 time frames. Key Features: Pattern Recognition - Detects valid bullish/bearish engulfing candle formations Trend Confirmation - 238-period SMA filter
Manyal trading system, CovEchoTrend Robot, focuses on reliability and flexibility. By employing statistical analysis methods to study the relationships between the base indicator and market patterns, the system enables a deeper understanding of market processes. Intelligent pattern analysis: The application of statistical data processing helps identify key trend reversal points more accurately, signaling significant market shifts. Informed decision-making is based on the intersection of indicato
Flashe
Kodjo Olivier Leonard Daga
FLASHE INDICATOR - La Révolution du Trading Intelligent PRÉSENTATION FLASHE INDICATOR est un système de trading de nouvelle génération qui repousse les limites de l'analyse technique traditionnelle. Développé par l'équipe DovTech, cet indicateur allie intelligence artificielle et algorithmes propriétaires pour offrir une expérience de trading unique. Conçu aussi bien pour le Day Trading que pour le Swing Trading, FLASHE s'adapte à toutes les conditions de marché et à tous les styles de
Max Ribbon Mt5
Stefano Frisetti
WARNING: This indicator is distributed EXCLUSIVELY on MQL5.com MT4 version:   https://www.mql5.com/it/market/product/160363 MT5 version:   https://www.mql5.com/it/market/product/160410 MAX RIBBON ver 1.00 The indicator that shows you the TREND clearly and unambiguously! DESCRIPTION MAX RIBBON is an advanced trend indicator that combines two ribbon systems to accurately identify market direction: • MaxRib2 (Fast Ribbon): Responsive to short-term movements, ideal for capturing rapid reversals and
Innovative trading robot Smart Capital: Your reliable partner in the Forex market Smart Capital is an advanced trading robot created for deep analysis of financial markets using specialized algorithms. This robot is designed to evaluate complex market data, which allows it to accurately predict trend changes and make optimal trading decisions. With its help, you can significantly increase the efficiency of your investments. Advantages of Smart Capital Unique analysis system: Smart Capital app
Expert. Automatic and manual trading. Ready-made trading system based on Elliott waves and Fibonacci retracement levels . It is simple and affordable. Display of the marking of Elliott waves (main or alternative option) on the chart. Construction of horizontal levels, support and resistance lines, a channel. Superposition of Fibonacci levels on waves 1, 3, 5, A Alert system (on-screen, E-Mail, Push notifications).    visual panel for opening orders in manual trading. visual panel for setting up
Introduction to Harmonic Pattern Scenario Planner The present state of Forex market can go through many different possible price paths to reach its future destination. Future is dynamic. Therefore, planning your trade with possible future scenario is an important step for your success. To meet such a powerful concept, we introduce the Harmonic Pattern Scenario Planner, the first predictive Harmonic Pattern Tool in the world among its kind. Main Features Predicting future patterns for scenario
Gartley Projections D
Oleksandr Medviediev
3 (2)
The indicator identifies the harmonic patterns (XABCD) according to developments of H.M.Gartley ( "Profits in the Stock Market" , 1935г). It projects D-point as a point in the perspective projection (specify ProjectionD_Mode = true in the settings). Does not redraw. When a bar of the working timeframe closes, if the identified pattern point has not moved during Patterns_Fractal_Bars bars, an arrow appears on the chart (in the direction of the expected price movement). From this moment on, the ar
Overview Harmonic Patterns MT5 is a technical analysis indicator designed for the MetaTrader 5 platform. It identifies and displays harmonic price patterns, such as Butterfly, Cypher, Crab, Bat, Shark, and Gartley, in both bullish and bearish directions. The indicator calculates key price levels, including entry, stop loss, and three take-profit levels, to assist traders in analyzing market movements. Visual elements and customizable alerts enhance usability on the chart. Features Detects six ha
SPECIAL LAUNCH OFFER: $30 (1-Month Rent) Limited time offer to build our community and gather feedback! AmbM GOLD Institutional Scalper A high-precision M5 algorithm for XAUUSD (Gold) , engineered to trade exclusively at Institutional Liquidity Levels ($5/$10 psychological marks). PERFORMANCE DATA (BUY ONLY) • Win Rate: 87.09%. • Safe Growth: +$4,113 profit on $10k (13.75% Max Drawdown). • Extreme Stress Test: Successfully generated +$22,997 in a 5-year stress test (2020-2026), proving
M & W Pattern Pro is an advanced scanner for M and W patters , it uses extra filters to ensure scanned patterns are profitable. The indicator can be used with all symbols and time frames. The indicator is a non repaint indicator with accurate statistics calculations. To use , simply scan the most profitable pair using the statistics dashboard accuracy , then enter trades on signal arrow and exit at the TP and SL levels. STATISTICS : Accuracy 1 : This is the percentage of the times price hits TP
SMC Market Structure PRO — Order Blocks, FVG, Liquidity & Confluence Zones Stop guessing. Start reading the market the way the big players see it. SMC Market Structure PRO automatically detects smart money zones of interest on your chart — Order Blocks, Fair Value Gaps (FVG) and time-based imbalances — and highlights Confluence Zones where all three types of structure overlap. That is exactly where price reacts most often. This is a complete market structure analysis tool based on the Smart Mone
FVG Sessions
Thi Thanh Huong Vo
The FVG Sessions indicator highlights the first fair value gap of the trading session as well as the session range. Detected fair value gaps extend to the end of the trading session. Alerts are included on the formation of a session fair value gap, price being within a session fair value gap, mitigations, and price crossing session fair value gaps average. Trader ICT states that the first fair value gap of the trading session can attract the most significant reaction. Having only one FVG per
WanaScalper
Isaac Wanasolo
1 (1)
A scalping indicator based on mathematical patterns, which on average gives signals with relatively small SL, and also occasionally helps to catch big moves in the markets (more information in the video) This indicator has three main types of notifications: The first type warns of a possible/upcoming signal on the next bar The second type indicates the presence of a ready signal to enter the market/open a position The third type is for SL and TP levels - you will be notified every time price re
This indicator is, without a doubt, the best variation of the Gann Angles among others. It allows traders using Gann methods to automatically calculate the Gann angles for the traded instrument. The scale is automatically calculated when the indicator is attached to the chart. When switching timeframes, the indicator recalculates the scale for the current timeframe. Additionally, you can enter your own scales for the Gann angles. You can enter your own scales either for both vectors or for each
ENGLISH DESCRIPTION (MQL5 Standard Optimized) Product Name: Obsidian Forest Automaton AI (MT5) [Subtitle: Forest Structure | Obsidian Blade TEMA | Shield Safety] Introduction Obsidian Forest Automaton AI is a structural trend-following construct designed to navigate the market with the cold precision of an automaton. It builds a "Forest Structure" using Ichimoku Cloud , cuts through noise with the Obsidian Blade (TEMA) , and validates density with Standard Deviation . This creates a system that
Uno Quant Trader
Mark Joseph Borromeo Juan
UNO Quant Trader UNO Quant Trader is a premium market-bias and trade-planning indicator built for traders who want cleaner decisions, faster chart reading, and a professional dashboard view. This indicator uses a multi-layer mathematical market model designed to analyze price behavior, momentum pressure, imbalance zones, trend strength, market exhaustion, and high-probability trade areas. Instead of relying on emotion or random entries, UNO Quant Trader helps you read the market using structured
Meravith MT5
Ivan Stefanov
5 (3)
마켓 메이커를 위한 도구. Meravith는 다음과 같은 기능을 제공합니다: 모든 타임프레임을 분석하고 현재 유효한 추세를 표시합니다. 강세와 약세 거래량이 동일한 유동성 구간(거래량 균형 구간)을 강조 표시합니다. 서로 다른 타임프레임의 모든 유동성 레벨을 차트에 직접 표시합니다. 텍스트 기반 시장 분석을 생성하여 참고용으로 제공합니다. 현재 추세를 기반으로 목표가, 지지선 및 손절가를 계산합니다. 거래의 위험 대비 보상 비율(Risk/Reward)을 계산합니다. 계좌 잔고에 따라 포지션 크기를 산출하고 잠재 수익을 추정합니다. 시장에 중대한 변화가 발생할 경우 경고도 제공합니다. 지표의 주요 라인: 강세/약세 거래량 소진 라인 — 목표가로 사용됩니다. 시장 추세를 나타내는 라인. 시장이 강세인지 약세인지에 따라 색상이 변경되며 추세 지지선 역할을 합니다. 색상은 주로 시장 심리를 보여줍니다. 거래량 균형선(Eq). Eq(Volume Equilibrium) 라인은 시스템의 핵심입니
SURMAchannelPRO
Roman Surmanidze
SURMAchannelPRO는 동적 가격 채널과 명확한 추세 추종 신호를 생성하는 프리미엄 다기능 지표입니다. 부드러운 Hull Moving Average (HMA)를 핵심으로 사용하며, 그 주변에 동적 지지 및 저항 역할을 하는 여러 채널 라인(내부, 중간, 외부)을 구축합니다. 지표는 채널 돌파/재진입 시 시각적 매수/매도 화살표를 제공하고, 사용자 정의 채널 폭의 백분율을 기반으로 자동으로 수평 Take Profit (TP) 및 Stop Loss (SL) 라인을 그립니다. 주요 특징은 설정된 기간 내 모든 과거 신호의 성과(총합, T/P, S/L, 이익, 손실)를 추적하는 통합 통계 패널입니다. 또한 다음 봉까지의 실시간 카운트다운 타이머가 포함되어 있습니다. 주요 특징: 동적 멀티 라인 채널:   기본 상단/하단 밴드와 정확한 시장 구조 분석을 위한 피보나치 기반 중간 라인을 생성합니다. 자동 신호 및 백테스팅:   가격과 채널의 상호작용을 기반으로 매수(초록색) 및 매도(분
Aurex Fibo Scalper
Cristofher Robles
Aurex Fibo Scalper is a premium precious metal (Gold, Silver) and forex scalping system. By focusing on the Golden Ratio of Fibonacci projections and incorporating specialized trend filter channels, it identifies strategic daily turning points. Key Features: Golden Ratio Projections: Levels calculated using precise Fibonacci coefficients. Metal Optimization: Tuned for volatile assets like XAUUSD (Gold) and XAGUSD (Silver). Synergy Crossover: Double MA filter to block counter-trend signals. Tradi
Chronos Auto-Adaptive Matrix - Pure Mathematical Precision Tired of fake "AI", "Deep Learning", and "ChatGPT" buzzwords? So are we. Welcome to Chronos Auto-Adaptive Matrix — an honest, transparent, and mathematically rigorous trading system.  === GOD-TIER PRESETS === [SETUP 1] SCALPING MATRIX (Best Overall / Default) Maximum trade frequency and highest profit yield. Very active breakout hunting. - **Breakout Period:** 12 - **Risk per Trade:** 2.0% - **SL / TP Multiplier:** 1.0 ATR / 1.5 ATR
Rocket Trend
Andriy Sydoruk
The Rocket Trend indicator is trending. The indicator draws two-color points connected by lines along the chart. This is a trend indicator, it is an algorithmic indicator. It is easy to work and understand when a blue circle appears, you need to buy, when a red one appears, sell. The indicator is used for scalping and pipsing, and has proven itself well. Rocket Trend is available for analyzing the direction of the trend for a specific period of time. Ideal for novice traders learning the laws o
UZFX-알파 스트라이크 시그널 v2.0은 높은 확률의 거래 기회를 정밀하고 명확하게 식별하도록 설계된 전문가급 시장 분석 도구입니다. 이 고급 지표는 정교한 가격 움직임 인식과 동적 리스크 관리 시각화를 결합하여 차트에 직접 명확한 매수 및 매도 신호를 제공합니다. 참고: { LTL 164343 } 지표와 함께 사용하면 신호의 적중률을 높일 수 있습니다. LTL 신호를 통해 추세를 파악하고, 알파 신호를 진입 신호로 활용하십시오. 이러한 접근 방식은 승률을 극대화하고 오신호를 방지하는 데 도움이 됩니다. 작동 원리 이 지표는 잠재적인 추세 반전 또는 지속을 시사하는 특정 캔들 패턴을 식별하여 시장 구조를 분석합니다. 이러한 패턴이 당사의 독자적인 알고리즘 조건과 일치할 때 지표는 명확한 시각적 신호를 생성합니다: 매수 신호(파란색 화살표)는 강세 모멘텀이 감지될 때 시장 저점에서 나타납니다 매도 신호(빨간색 화살표)는 약세 압력이 확인될 때 시장 고점에서 나타납니다 트레이더를
Seasonal Pattern Trader
Dominik Patrick Doser
Disclaimer : Keep in mind that seasonal patterns are not always reliable. Therefore, thoughtful risk management is crucial to minimize losses.  Seasonal patterns in the financial world are like a well-guarded secret that successful investors use to their advantage. These patterns are recurring price movements that occur during specific periods or around special events. Additionally, there are also intraday patterns that repeat. For example, Uncle Ted from Forex Family suggests examining previou
Insight Investor: Advanced Multi-Currency Forex Trading Bot Introduction In the fast-paced world of Forex trading, having the right tools can significantly enhance your trading experience. Insight Investor is an advanced multi-currency trading bot designed to automate and optimize your trading operations. This expert advisor employs modern algorithms to analyze market conditions and execute trades, aiming to deliver consistent results while maintaining controlled risk levels. Key Features of Ins
Volume flow Profile
Israr Hussain Shah
Master Edition은 거래량과 자금 흐름의 관점을 통해 시장 구조를 시각화하도록 설계된 전문가급 분석 도구입니다. 표준 거래량 지표와 달리, 이 도구는 차트에 일일 거래량 프로필을 직접 표시하여 가격 발견이 발생한 위치와 "스마트 머니"가 위치한 곳을 정확하게 볼 수 있게 합니다. 이 Master Edition은 명확성과 속도를 위해 설계되었으며, 로드 시 차트 레이아웃을 즉시 아름답게 만드는 독특한 자동 테마 동기화 시스템을 특징으로 합니다. 주요 기능: 진정한 자금 흐름 계산: 표준 틱 거래량을 넘어섭니다. "Use Money Flow"를 활성화하면 거래량이 가격에 따라 가중치가 부여되어 특정 가격 수준에서의 실제 자본 투입을 드러냅니다. 가치 영역(VA) 시각화: 가치 영역(기본값: 거래량의 70%)을 자동으로 계산합니다. VA Fill: 통제 구역을 즉시 식별하기 위해 가치 영역 배경을 음영 처리합니다. 주요 수준: 통제점(POC), 가치 영역 고점(VAH), 가치 영
Sonic R Pro Enhanced EA - 버전 2025 249달러 - 첫 5명만! 실시간 신호 Sonic R Pro Enhanced의 실시간 성과 확인하기: 거래 전략 Sonic R Pro Enhanced는 Dragon Band (EMA 34 및 EMA 89)를 기반으로 한 전통적인 Sonic R 전략의 업그레이드 버전으로, 자동화된 거래 시스템입니다. 타임프레임: M15, M30 지원 통화쌍: XAUUSD, BTCUSD, AUDJPY, USDJPY 거래 스타일: 스윙 트레이딩 - 풀백 및 반대 트렌드 최소 자본: 500 USD 레버리지: 1:200 이상 사용자 가이드 Sonic R Pro Enhanced는 단순함을 위해 최적화되었습니다. 사용자는 RiskAmount 하나의 파라미터만 설정하면 됩니다. RiskAmount < 0일 경우: 계좌 잔액의 백분율로 위험을 계산 RiskAmount > 0일 경우: 거래당 고정 USD 금액으로 위험을 설정 예제:
이 제품의 구매자들이 또한 구매함
ARIPoint
Temirlan Kdyrkhan
1 (1)
ARIPoint is a powerful trading companion designed to generate high-probability entry signals with dynamic TP/SL/DP levels based on volatility. Built-in performance tracking shows win/loss stats, PP1/PP2 hits, and success rates all updated live. Key Features: Buy/Sell signals with adaptive volatility bands Real-time TP/SL/DP levels based on ATR Built-in MA Filter with optional ATR/StdDev volatility Performance stats panel (Success, Profit/Loss, PP1/PP2) Alerts via popup, sound, push, or email Cu
PrimeScalping
Temirlan Kdyrkhan
PrimeScalping is a powerful trading companion designed to generate high-probability entry signals with dynamic TP/SL/DP levels based on volatility. Built-in performance tracking shows win/loss stats, PP1/PP2 hits, and success rates — all updated live. Key Features: Buy/Sell signals with adaptive volatility bands Real-time TP/SL/DP levels based on ATR Built-in MA Filter with optional ATR/StdDev volatility Performance stats panel (Success, Profit/Loss, PP1/PP2) Alerts via popup, sound, push, or e
SmartScalping
Temirlan Kdyrkhan
SmartScalping is a powerful trading companion designed to generate high-probability entry signals with dynamic TP/SL/DP levels based on volatility. Built-in performance tracking shows win/loss stats, PP1/PP2 hits, and success rates — all updated live. Key Features: Buy/Sell signals with adaptive volatility bands Real-time TP/SL/DP levels based on ATR Built-in MA Filter with optional ATR/StdDev volatility Performance stats panel (Success, Profit/Loss, PP1/PP2) Alerts via popup, sound, push, or e
ScalpPoint
Temirlan Kdyrkhan
ScalpPoint is a powerful trading companion designed to generate high-probability entry signals with dynamic TP/SL/DP levels based on volatility. Built-in performance tracking shows win/loss stats, PP1/PP2 hits, and success rates — all updated live. Key Features: Buy/Sell signals with adaptive volatility bands Real-time TP/SL/DP levels based on ATR Built-in MA Filter with optional ATR/StdDev volatility Performance stats panel (Success, Profit/Loss, PP1/PP2) Alerts via popup, sound, push, or emai
TrendProMaster
Temirlan Kdyrkhan
MasterTrend Indicator for MT5 A powerful trend-following and signal-evaluation tool MasterTrend   is a custom MT5 indicator that combines Moving Averages and ATR-based risk/reward logic to generate clear buy/sell signals. It visualizes dynamic SL/TP levels, evaluates past trade outcomes, and displays win/loss statistics in a clean on-chart panel. Key features include: Buy/Sell signals based on MA crossovers ATR-based SL/TP1/TP2/TP3 levels with visual lines and labels Signal outcome tracking wit
MasterTrend
Temirlan Kdyrkhan
MasterTrend Indicator for MT5 A powerful trend-following and signal-evaluation tool MasterTrend   is a custom MT5 indicator that combines Moving Averages and ATR-based risk/reward logic to generate clear buy/sell signals. It visualizes dynamic SL/TP levels, evaluates past trade outcomes, and displays win/loss statistics in a clean on-chart panel. Key features include: Buy/Sell signals based on MA crossovers ATR-based SL/TP1/TP2/TP3 levels with visual lines and labels Signal outcome tracking wit
ARICoins
Temirlan Kdyrkhan
ARICoin is a powerful trading companion designed to generate high-probability entry signals with dynamic TP/SL/DP levels based on volatility. Built-in performance tracking shows win/loss stats, PP1/PP2 hits, and success rates all updated live. Key Features: Buy/Sell signals with adaptive volatility bands Real-time TP/SL/DP levels based on ATR Built-in MA Filter with optional ATR/StdDev volatility Performance stats panel (Success, Profit/Loss, PP1/PP2) Alerts via popup, sound, push, or email Cust
Euro Escalper
Cristofher Robles
Euro Escalper — Peulopesyeoneol Gigugeup Seukael-ping Jipyo Euro Escalper  eun mobeun jingib-eseo gigugeub jeongmilseong-eul yoguhaneun teuleideoui goseongneung georae jipyo. Hapseong Jisu (Deriv), Forex mich MetaTrader 5 eseo sayong ganeunghan modeun jasan-e jeogyong. Fibonacci giban yudongseong jiyeog, naejang SuperTrend enjin mich silsigan jeonmun daesiboeleu-leul gyeolhap. Juyo Jangjeom Jaegeurim Eobseum: Signal hwasalpyo-neun bong maegam si-eman natanago jeoldae umjigiji ankeo sarajiji anhs
Классификатор силы тренда. Показания на истории не меняет. Изменяется классификация только незакрытого бара. По идее подобен полной системе ASCTrend, сигнальный модуль которой, точнее его аппроксимация в несколько "урезанном" виде, есть в свободном доступе, а также в терминале как сигнальный индикатор SilverTrend . Точной копией системы ASCTrend не является. Работает на всех инструментах и всех временных диапазонах. Индикатор использует несколько некоррелируемых между собой алгоритмов для класси
FFx Universal Strength Meter PRO is more than a basic strength meter. Instead of limiting the calculation to price, it can be based on any of the 19 integrated strength modes + 9 timeframes. With the FFx USM, you are able to define any period for any combination of timeframes. For example, you can set the dashboard for the last 10 candles for M15-H1-H4… Full flexibility! Very easy to interpret... It gives a great idea about which currency is weak and which is strong, so you can find the best pai
The FFx Universal MTF alerter shows on a single chart all the timeframes (M1 to Monthly) with their own status for the chosen indicator. 9 indicators mode (MACD-RSI-Stochastic-MA-ADX-Ichimoku-Candles-CCI-PSAR). Each can be applied multiple times on the same chart with different settings. Very easy to interpret. Confirm your BUY entries when most of the timeframes are showing green color. And confirm your SELL entries when most of the timeframes are showing red color. 2 Alert Options : input to s
FFx Watcher Pro MT5
Eric Venturi-Bloxs
The FFx Watcher PRO is a dashboard displaying on a single chart the current direction of up to 15 standard indicators and up to 21 timeframes. It has 2 different modes: Watcher mode: Multi Indicators User is able to select up to 15 indicators to be displayed User is able to select up to 21 timeframes to be displayed Watcher mode: Multi Pairs User is able to select any number of pairs/symbols User is able to select up to 21 timeframes to be displayed This mode uses one of the standard indicators
FFx Patterns Alerter gives trade suggestions with Entry, Target 1, Target 2 and StopLoss .... for any of the selected patterns (PinBar, Engulfing, InsideBar, OutsideBar) Below are the different options available: Multiple instances can be applied on the same chart to monitor different patterns Entry suggestion - pips to be added over the break for the entry 3 different options to calculate the SL - by pips, by ATR multiplier or at the pattern High/Low 3 different options to calculate the 2 TPs -
FFx Basket Scanner MT5
Eric Venturi-Bloxs
MetaTrader 4 version available here : https://www.mql5.com/en/market/product/24881 FFx Basket Scanner is a global tool scanning all pairs and all timeframes over up to five indicators among the 16 available. You will clearly see which currencies to avoid trading and which ones to focus on. Once a currency goes into an extreme zone (e.g. 20/80%), you can trade the whole basket with great confidence. Another way to use it is to look at two currencies (weak vs strong) to find the best single pairs
MetaTrader 4 version available here: https://www.mql5.com/en/market/product/25793 FFx Pivot SR Suite PRO is a complete suite for support and resistance levels. Support and Resistance are the most used levels in all kinds of trading. Can be used to find reversal trend, to set targets and stop, etc. The indicator is fully flexible directly from the chart 4 periods to choose for the calculation: 4Hours, Daily, Weekly and Monthly 4 formulas to choose for the calculation: Classic, Camarilla, Fibonac
Recommended TimeFrame >= H1. 100% Non Repainted at any moment.  Use it carefully, only with Trend Direction. Trading Usage: 2 Variants: as Range System or as BreakOut System (Both Only With Trend Direction)::: (Always use StopLoss for minimise Risk); [1] as Range System: (Recommended) in UP TREND:  - BUY in Blue Line , then if price goes down by 50 points (on H1) open Second BUY.   Close in any Profit you wish: TrailingStop(45 points) or Close when Price touches upper Gold Line. in DOWN TREND
BC Scalper Aroow
Tete Adate Adjete
This indicator is based on the crossing of two Moving Average with the RSI It is intended for scalpers Specially designed for Boom and Crash syhtetic indices from Binary.com/Deriv.com It is easy to use and intuitive. We recommend its use on M1 and is equipped with three types of notification Email alert Sound notification Push notification these parameters can be activated and deactivated.
Magicx
Hasan Abdulhussein
The indicator places a buy or sell signal when the conditions of the strategy it was designed with are met. The strategy is guaranteed, strong, and has been tested for 9 years. The indicator is for binary options and can be converted into a bot by linking it to MT2Trading, where it sends the signal to this platform. This platform automatically opens a trade on the trading platform you are using, whether it is Pocket Option, IQ Option, or any other binary options platforms. The entry is on the n
CBT Quantum Maverick
Arpit Sharma
1 (1)
CBT Quantum Maverick 고효율 바이너리 옵션 거래 시스템 CBT Quantum Maverick는 정밀하고 간단하며 체계적인 거래를 원하는 트레이더를 위해 설계된 고성능 바이너리 옵션 거래 시스템입니다. 사용자 지정이 필요 없으며, 처음부터 최적화된 결과를 제공합니다. 약간의 연습만으로 신호를 쉽게 마스터할 수 있습니다. 주요 특징: 정확한 신호 제공: 현재 봉 데이터를 기반으로 다음 캔들에 대한 신호를 생성하며, 빈번한 재도색이 없습니다. 다양한 시장에 대한 적응성: 바이너리 옵션 거래에 특화되었으며, 여러 브로커 및 자산 클래스와 호환됩니다. 호환 가능: Deriv Synthetic Charts: 모든 시간 프레임에서 사용 가능. OTC 차트: Quotex, PocketOption, Binomo, Stockity, IQOption, Exnova, OlympTrade, Deriv, Binolla, Homebroker 등의 브로커와 호환(MT5로의 무료 데이터 임
ITF Trend Filter
Mayowa Daniel Sonaike
This strategy focuses on identifying and following clear market trends by filtering out noise and short-term fluctuations. Using advanced algorithms, it highlights significant upward and downward movements, enabling traders to make data-driven decisions. The indicator is designed for simplicity and precision, ideal for traders who prefer a systematic approach to trend trading. Whether you're a beginner or an experienced trader, this tool helps you stay aligned with the dominant market direction
Paradigm Shift
Oliver John Vella
PRICE WILL BE INCREASED TO £4999 SOON! 5 or 15 MINUTE CHART ONLY: A state-of-the-art trading indicator, designed with advanced analytical and mathematical programming, delivers top-tier buy and sell signals. Simply enter a small buy position when a green arrow appears and a small sell position when a red arrow is shown. While signals from this indicator are infrequent, they boast exceptional accuracy when generated. Please apply your own stop-loss and take-profit levels as needed.
In sadiq100
Xssadq Alseydy
مؤشر Smart Trend Candles هو أداة فعّالة في منصة MetaTrader 4، تجمع بين عناصر تحليل فني متعددة لتحديد اتجاهات السوق وقياس قوة المشترين والبائعين. يوفر هذا المؤشر متعدد الاستخدامات إشارات مرئية واضحة تُحسّن قرارات التداول الخاصة بك. الميزات الرئيسية 1. تحديد الاتجاه يستخدم شموع Heikin-Ashi المعدلة (اختياري) لتصفية ضوضاء السوق يتضمن متوسطًا متحركًا (فترة قابلة للتكوين) لتأكيد الاتجاه تنفيذ مؤشر القوة النسبية لقياس الزخم 2. قياس القوة تشير الشموع المرمزة بالألوان إلى شدة ضغط الشراء/البيع تحليل الحج
Trend Frequency Market MT5 Carry out analysis and backtest even before opening your orders, check the strategy's Winrate and stay in favor of the Trend and the strength of the movement. The TFM indicator is specialized in providing you with the strength points of the movement, painting the candles GREEN or RED to report price aggression from the Players who are acting at the exact moment. Taking advantage of this detection, the indicator plots Arrow and Entry, Stop Loss and Take Profit levels
Knight Rider FX
Oliver John Vella
PRICE WILL BE INCREASED TO £4999 SOON! Knight Rider FX is a precision-engineered trading indicator that delivers highly accurate, non-repainting signals without flooding your chart. It filters out noise and selectively highlights only the highest probability trade setups. On higher timeframes, it anticipates major market reversals, while on intraday charts it pinpoints mini reversals with tactical clarity. By focusing on quality over quantity, Knight Rider FX equips traders with disciplined ent
AriX
Temirlan Kdyrkhan
1 (4)
AriX Indicator for MT5 A powerful trend-following and signal-evaluation tool AriX is a custom MT5 indicator that combines Moving Averages and ATR-based risk/reward logic to generate clear buy/sell signals. It visualizes dynamic SL/TP levels, evaluates past trade outcomes, and displays win/loss statistics in a clean on-chart panel. Key features include: Buy/Sell signals based on MA crossovers ATR-based SL/TP1/TP2/TP3 levels with visual lines and labels Signal outcome tracking with real-time stat
VI Comparison
Ivan Andrescov
Screens realtime-  https://t.me/ +rEuJQo8zHLllMzgy Signals.Metals.etc This tool is designed to detect anomalies in market trading activity. It analyzes price movements and volumes to identify moments of unusually strong buying or selling pressure. Such periods are often followed by a cooling phase or consolidation, providing traders with valuable reference points for decision-making.  The indicator requires no complex setup and is suitable for both experienced traders and beginners. Screensho
VI Calculator
Ivan Andrescov
Screens realtime-  https://t.me/ +rEuJQo8zHLllMzgy in Signals.Metals.etc VI Calculator  is a professional MetaTrader 5 indicator that analyzing volume at the moment. This synergy allows traders to evaluate both the strength of market movements and overbought/oversold conditions at the same time. The indicator automatically processes market data and provides clear trading signals directly on the chart in the form of arrows and text recommendations. It is ideal for identifying entry and exit p
TrendFlow Tracker
David Macharia Kamau
TrendCatcherBot: Find Your Edge in the Market Don't guess the trend—catch it. The TrendCatcherBot is an Expert Advisor designed for MetaTrader 5 that simplifies your trading strategy. By leveraging the power of moving average crossovers, this bot provides clear, visual signals directly on your chart, so you always know when to act. Watch for the unmistakable green, red, and black dots in the corner of your screen to instantly see if the market is signaling a buy, sell, or hold. It's the perfect
AlphaSeekingBull5
Thendo Evans Sithagu
Introducing the Ultimate Trend-Following Indicator: Precision Signals at Your Fingertips In a market saturated with "black-box" systems and cluttered, confusing charts, clarity is the ultimate advantage. Alpha Seeking Bull strips away the noise, distilling complex market analysis into a single, high-fidelity visual cue. Whether you are a seasoned day trader or just starting your journey, this indicator is engineered to provide the confidence you need to execute trades with surgical precision. Th
Dubai Sniper Ultra V6
Mohammed Khalid M Almatrudi
WELCOME TO THE ULTIMATE TRADING REVOLUTION!   Are you tired of lagging indicators, fakeouts, and leaving massive profits on the table? It’s time to stop guessing and start sniping! Introducing Dubai Sniper Ultra Strategy, the most powerful, highly-optimized trend-following and reversal indicator meticulously engineered for MetaTrader 5. This isn't just another indicator—this is your ultimate weapon to dominate the markets, especially built to crush indices like SPX500, Gold, and Major Forex pair
제작자의 제품 더 보기
KAMA Confluence Engine 트렌드에 따라 거래하고, 시장이 반전되는 순간에 즉시 진입, 스톱, 목표가를 확인하세요. KAMA Confluence Engine은 Kaufman Adaptive Moving Average(KAMA)를 기반으로 한 올인원 트렌드 지표로, 틱 거래량 가중치, 멀티 타임프레임 확인, 자동 거래 레벨 기능이 강화되어 있습니다. 시장 상황에 따라 자동으로 적응하며, 트렌드 구간에서는 빠르고 민감하게, 횡보 구간에서는 안정적이고 노이즈를 필터링하여 항상 올바른 방향에서 거래할 수 있도록 돕습니다. 특징 거래량 가중 적응형 엔진 실제 틱 거래량이 증가하면 KAMA 라인이 빨라지고, 거래량이 줄어들면 느려집니다. 강한 움직임에는 머물고, 가짜 신호는 피할 수 있습니다. 눈에 띄는 네온 리본 밝고 부드러운 라인으로, 아래에는 짙은 그림자가 있습니다. 녹색 = 상승 추세, 빨간색 = 하락 추세, 회색 = 횡보/비거래. 멀리서도 한눈에 추세를 파악할 수 있습니
Transaction Speed MT5
Ivan Stefanov
5 (4)
이 지표는 시장에서 관심이 나타나는 영역 을 강조 표시한 후, 주문이 누적되는 영역 을 보여줍니다. 이는 **대규모 오더북(호가창)**처럼 작동합니다. 이것은 거대한 자금 을 위한 인디케이터입니다. 성능은 탁월하며, 시장에서 어떤 관심이 있든 반드시 포착할 수 있습니다 . (이것은 완전히 새로 작성되고 자동화된 버전 입니다 – 이제 수동 분석은 필요하지 않습니다.) **거래 속도(Transaction Speed)**는 새로운 개념의 인디케이터로, 시장에 대규모 주문이 언제, 어디에 쌓이는지를 보여주며 , 그 이점을 분석합니다. 매우 초기 단계에서 트렌드 전환 을 감지할 수 있습니다. FX 시장에서 흔히 사용하는 "거래량(volume)"은 오해입니다. 실제로는 시간당 가격 변화량 이므로, 올바른 용어는 거래 속도 입니다. 우리가 어떻게 사고하고, 행동하며, 분석하느냐 가 가장 중요합니다. 분석 패러다임의 전환 은 필수적입니다. 이 인디케이터는 외환 시장에서의 볼륨 개념을 논리적으로
Imbalance Pro
Ivan Stefanov
5 (4)
이 인디케이터는 선택한 기간 동안 상승과 하락 사이의 불균형을 측정하고 두 지점 사이의 직선을 표시합니다. 상승세가 하락세보다 거래량이 많으면 선이 녹색으로 바뀝니다.  하락세가 더 많으면 빨간색으로 표시됩니다. 이 선은 거래량의 백분율 차이도 표시합니다. 표시기는 별도의 창에 동일한 데이터를 표시합니다. 분할된 볼륨도 볼 수 있습니다. 표시기에는 두 가지 모드가 있습니다. 이를 위해 왼쪽 상단에 버튼이 있습니다,  - 누르지 않으면 시장의 임의의 지점과 현재 가격 사이의 불균형을 측정합니다.  - 버튼을 누르면 선택한 시장의 두 지점 사이의 잔액을 측정할 수 있습니다. 이 인디케이터는 선택한 기간 동안 상승과 하락 사이의 불균형을 측정하고 두 지점 사이의 직선을 표시합니다. 상승세가 하락세보다 거래량이 많으면 선이 녹색으로 바뀝니다.  하락세가 더 많으면 빨간색으로 표시됩니다. 이 선은 거래량의 백분율 차이도 표시합니다. 표시기는 별도의 창에 동일한 데이터를 표
MACD divergency
Ivan Stefanov
4.63 (8)
이 지표는 지수이동평균(EMA) 기간을 5(빠름)와 34(느림), 신호선 기간을 5로 설정하여 가격 움직임과 MACD 히스토그램 간의 강세 및 약세 다이버전스를 정확하게 식별합니다. 지표는 모멘텀이 약화되는 지점을 강조 표시하여 잠재적 추세 반전을 알립니다. 올바른 다이버전스 식별 규칙: 강세 다이버전스는 가격이 더 낮은 저점을 형성하면서 MACD 히스토그램이 동시에 0선 위에서 더 높은 저점을 형성할 때 유효합니다. 약세 다이버전스는 가격이 더 높은 고점을 형성하면서 MACD 히스토그램이 동시에 0선 아래에서 더 낮은 고점을 형성할 때 유효합니다. 히스토그램의 극값과 가격의 극값이 0선의 같은 쪽에 있지 않으면 다이버전스 신호는 무효로 간주되며, 이는 잘못된 신호를 초래할 수 있습니다. 이 접근법은 MACD 다이버전스 분석을 적용하는 가장 정확하고 신뢰할 수 있는 방법을 제시합니다. 지표 특징: 확인된 강세 및 약세 다이버전스를 명확하게 표시합니다. 신뢰성을 높이기 위해 MACD
FREE
SuperTrend Apex는 클래식 SuperTrend 개념을 기반으로 크게 향상된 적응형 추세 거래 시스템입니다. 이 시스템은 변동성 레짐 감지, 스마트 반전 필터, 다중 심볼 실시간 시장 스캐너, 멀티 타임프레임 오버레이, 내장 성능 패널, 전체 알림 패키지를 포함합니다. 모든 기능은 하나의 MT5 인디케이터 안에서 작동하며, 외환, 지수, 금속, 암호화폐, 주식 등 모든 심볼과 모든 타임프레임에서 사용할 수 있습니다. 기존 SuperTrend가 고정된 ATR 기간과 배수를 사용하는 것과 달리, SuperTrend Apex는 시장 상황에 따라 두 값을 자동으로 조정합니다. ATR 기간은 변동성에 따라 최소값과 최대값 사이에서 동적으로 변화하며, 배수는 횡보장이나 높은 변동성 구간에서는 확대되어 거짓 반전을 줄이고, 낮은 변동성의 깔끔한 추세에서는 좁아져 반응성을 높입니다. ADX는 시장이 추세인지 횡보인지 판단하는 데 사용되며, 이 레짐은 인디케이터의 반응 방식에 직접적인 영
Meravith MT5
Ivan Stefanov
5 (3)
마켓 메이커를 위한 도구. Meravith는 다음과 같은 기능을 제공합니다: 모든 타임프레임을 분석하고 현재 유효한 추세를 표시합니다. 강세와 약세 거래량이 동일한 유동성 구간(거래량 균형 구간)을 강조 표시합니다. 서로 다른 타임프레임의 모든 유동성 레벨을 차트에 직접 표시합니다. 텍스트 기반 시장 분석을 생성하여 참고용으로 제공합니다. 현재 추세를 기반으로 목표가, 지지선 및 손절가를 계산합니다. 거래의 위험 대비 보상 비율(Risk/Reward)을 계산합니다. 계좌 잔고에 따라 포지션 크기를 산출하고 잠재 수익을 추정합니다. 시장에 중대한 변화가 발생할 경우 경고도 제공합니다. 지표의 주요 라인: 강세/약세 거래량 소진 라인 — 목표가로 사용됩니다. 시장 추세를 나타내는 라인. 시장이 강세인지 약세인지에 따라 색상이 변경되며 추세 지지선 역할을 합니다. 색상은 주로 시장 심리를 보여줍니다. 거래량 균형선(Eq). Eq(Volume Equilibrium) 라인은 시스템의 핵심입니
KAMA   Confluence   Engine 트렌드에   따라   거래하고,   시장이   반전되는   순간에   즉시   진입,   스톱,   목표가를   확인하세요. KAMA   Confluence   Engine은   Kaufman   Adaptive   Moving   Average(KAMA)를   기반으로   한   올인원   트렌드   지표로,   틱   거래량   가중치,   멀티   타임프레임   확인,   자동   거래   레벨   기능이   강화되어   있습니다.   시장   상황에   따라   자동으로   적응하며,   트렌드   구간에서는   빠르고   민감하게,   횡보   구간에서는   안정적이고   노이즈를   필터링하여   항상   올바른   방향에서   거래할   수   있도록   돕습니다. 특징 거래량   가중   적응형   엔진   실제   틱   거래량이   증가하면   KAMA   라인이   빨라지고,   거래량이   줄어들면   느려집니다.
FREE
RSI Divergence Pulse는 다이버전스 감지, 다중 타임프레임 분석, 시각 도구를 하나의 가벼운 애플리케이션에 통합한 포괄적인 RSI 지표입니다. Regular 및 Hidden 다이버전스를 자동으로 식별하고, 실시간 Multi-Timeframe RSI 패널을 표시하며, OB/OS 영역을 시각적으로 인식하기 쉽게 채우고, 가격 차트와 RSI 하위 창 모두에 다이버전스 선을 그려주며, Buy/Sell 화살표를 배치하고 실시간 알림을 제공합니다. Features Color-Coded RSI Line RSI 선은 현재 영역에 따라 색상이 변경됩니다. 파랑은 중립 영역(30~70)을 나타냅니다. 초록은 과매수 영역(70 이상)을 나타냅니다. 빨강은 과매도 영역(30 이하)을 나타냅니다. RSI Signal Line RSI의 SMA(기본 기간 9)가 신호선으로 작동합니다. RSI와 신호선의 교차는 타이밍 정보를 추가로 제공합니다. 차이값(Diff)은 대시보드에 표시됩니다. Auto
Enigmera
Ivan Stefanov
5 (9)
ENIGMERA: 시장의 핵심 중요: MQL5.com의 데모는 Strategy Tester에서 실행되며 Enigmera의 기능을 완전히 반영하지 못할 수 있습니다. 설명, 스크린샷 및 비디오를 확인하여 자세한 내용을 확인하십시오. 질문이 있으면 언제든지 메시지를 보내주세요! 인디케이터의 코드는 완전히 다시 작성되었습니다. 버전 3.0은 새로운 기능을 추가하고 인디케이터가 처음 출시된 이후 누적된 버그를 수정했습니다. 소개 이 인디케이터 및 거래 시스템은 금융 시장에 대한 주목할 만한 접근 방식입니다. ENIGMERA는 프랙탈 주기를 사용하여 정확하게 지원 및 저항 수준을 계산합니다. 실제 축적 단계를 보여주고 방향과 목표를 제공합니다. 트렌드와 수정 모두에서 작동하는 시스템입니다. 작동 방식 인디케이터의 대부분의 기능은 차트 왼쪽에 있는 버튼을 통해 제어되며, 이를 통해 다양한 시장 상황에 빠르게 대응할 수 있습니다. 버튼 ON/OFF – 인디케이터 전체를 표시하거나 숨깁니다.
이 지표는 지수이동평균(EMA) 기간을 5(빠름)와 34(느림), 신호선 기간을 5로 설정하여 가격 움직임과 MACD 히스토그램 간의 강세 및 약세 다이버전스를 정확하게 식별합니다. 지표는 모멘텀이 약화되는 지점을 강조 표시하여 잠재적 추세 반전을 알립니다. 올바른 다이버전스 식별 규칙: 강세 다이버전스는 가격이 더 낮은 저점을 형성하면서 MACD 히스토그램이 동시에 0선 위에서 더 높은 저점을 형성할 때 유효합니다. 약세 다이버전스는 가격이 더 높은 고점을 형성하면서 MACD 히스토그램이 동시에 0선 아래에서 더 낮은 고점을 형성할 때 유효합니다. 히스토그램의 극값과 가격의 극값이 0선의 같은 쪽에 있지 않으면 다이버전스 신호는 무효로 간주되며, 이는 잘못된 신호를 초래할 수 있습니다. 이 접근법은 MACD 다이버전스 분석을 적용하는 가장 정확하고 신뢰할 수 있는 방법을 제시합니다. 지표 특징: 확인된 강세 및 약세 다이버전스를 명확하게 표시합니다. 신뢰성을 높이기 위해 MACD
FREE
Times MT5
Ivan Stefanov
TIMES는 분석에 시간 차원을 추가합니다. 이것은 트레이딩 삼위일체의 세 번째 요소입니다. Meravith는 공정 가격을 보여주고, TransactionSpeed는 공정 거래량을 보여주며, TIMES는 거래 활동이 어느 시간대에 집중되는지 를 보여줍니다. 이를 통해 모멘텀이 쌓이고 있는지, 혹은 약해지고 있는지를 드러냅니다. 표시되는 것: 존(사각형) 차트를 선으로 복잡하게 만드는 대신, TIMES는 분석을 가격 차트 위에 직접 그려지는 색상 사각형으로 압축합니다. 각 사각형은 인디케이터 내부의 시간 구조로 생성된 중요한 가치 존을 나타내며, 거래 활동이 모였던 가격대이자 시장이 반응할 가능성이 높은 영역입니다. 색상 해석 녹색 / 청록색 사각형 → 상승 존 (여기서 모멘텀이 형성됨 — 지지 / 지속 구간 역할). 빨간색 / 진홍색 사각형 → 하락 존 (여기서 모멘텀이 약화됨 — 저항 / 지속 구간 역할). 존의 동작 방식 (지능형 기능) 확정 돌파 시 색상 전환 가격이 존의 한


Two Snakes
Ivan Stefanov
5 (1)
2 SNAKES  is a first class scalping system. As the entries are quite precise, you are likely to become addicted to this system very quickly.  You have 2 snakes. When you see a candle above or below them that does not touch them - that is your scalping signal. Then buy or sell at the green line or close. If you use a larger time frame, scalping can become trend following. The snakes are calculated precisely in relation to the current state of the market. They ARE NOT moving averages.  You decide
Levelss
Ivan Stefanov
5 (1)
레벨스 지표가 표시됩니다: - 일일 강세 및 약세 영역. 매일 00:00~23:59에 표시됩니다.  - 주간 강세 및 약세 영역. 매주 월요일 0:00부터 금요일 23:59까지 표시됩니다. - 특정 시간대에서 특별히 계산된 채널로 다른 모든 시간대에 표시됩니다. 기본적으로 4시간 주기로 표시되며 거래하고자 하는 다른 주기로 변경할 수 있습니다. 논스톱으로 계산됩니다. 화면 왼쪽 상단에는 강세, 약세 또는 중립 영역과 채널이 표시됩니다. 세 가지가 모두 강세인 경우 현재 캔들에 녹색 점이 나타납니다. 세 개가 모두 약세인 경우 분홍색 점이 나타납니다. 인디케이터에는 제한이 없습니다. 레벨스 지표가 표시됩니다: - 일일 강세 및 약세 영역. 매일 00:00~23:59에 표시됩니다.  - 주간 강세 및 약세 영역. 매주 월요일 0:00부터 금요일 23:59까지 표시됩니다. - 특정 시간대에서 특별히 계산된 채널로 다른 모든 시간대에 표시됩니다. 기본적으로 4시간 주기로 표시되며


GANN Master
Ivan Stefanov
5 (1)
GANN의 정확한 목표는 그의 오랜 방법론에 따라 계산되어 눈앞에 제시됩니다. 이 도구는 거래를 더욱 쉽고 직관적으로 만들어줍니다. 흰 선을 위로 또는 녹색 선을 아래로 움직이면 GANN의 기법이 여전히 거래 세계에서 영향력 있는 이유를 즉시 알 수 있습니다. GANN의 전략은 시장 움직임을 높은 정확도로 예측하는 데 중점을 두며, 이 도구는 그 힘을 여러분의 손끝에 전달합니다. 숙련된 트레이더든 초보자든, 선을 조작하면 그의 접근 방식이 왜 오랜 세월 동안 신뢰받았는지 깊이 이해할 수 있게 될 것입니다. GANN의 정확한 목표는 그의 오랜 방법론에 따라 계산되어 눈앞에 제시됩니다. 이 도구는 거래를 더욱 쉽고 직관적으로 만들어줍니다. 흰 선을 위로 또는 녹색 선을 아래로 움직이면 GANN의 기법이 여전히 거래 세계에서 영향력 있는 이유를 즉시 알 수 있습니다. GANN의 전략은 시장 움직임을 높은 정확도로 예측하는 데 중점을 두며, 이 도구는 그 힘을 여러분의 손끝에 전달합니다.
Sense
Ivan Stefanov
5 (2)
SENSE는 선택된 GANN 방식과 프랙탈 계산을 결합한 자동화된 시스템입니다. 이 시스템은 거래를 개시하고 청산할 위치를 알려줍니다. 더 이상 복잡한 계산에 시간을 낭비할 필요가 없습니다. SENSE가 모든 것을 알아서 해줍니다. 인디케이터를 설치하기만 하면 됩니다. 기본 원칙: 가격이 흰색 선 위에 있으면 시장은 강세입니다. 흰색 선 위에서 매수, 아래에서 손절 녹색 선은 상승 목표 가격이 흰색 선 아래에 있으면 시장은 약세입니다. 흰색 선 아래에서 매도, 그 위에 스톱 빨간색 선은 하락 목표 녹색 또는 빨간색 이중선은 강세 구간을 나타냅니다. 왜 센스인가? 수익 목표: SENSE는 자동으로 이익 실현 목표를 설정하여 트레이딩 성공을 극대화할 수 있도록 도와줍니다. 자동 적응: 인디케이터는 모든 차트주기에 대해 자동으로 다시 계산하여 수동으로 조정할 필요 없이 정확하고 신뢰할 수 있는 신호를 제공합니다. 스캘핑에도 좋습니다. 데모를 확인해 보세요!
Meravith
Ivan Stefanov
5 (3)
마켓 메이커를 위한 도구. Meravith는 다음과 같은 기능을 제공합니다: 모든 타임프레임을 분석하고 현재 유효한 추세를 표시합니다. 강세와 약세 거래량이 동일한 유동성 구간(거래량 균형 구간)을 강조 표시합니다. 서로 다른 타임프레임의 모든 유동성 레벨을 차트에 직접 표시합니다. 텍스트 기반 시장 분석을 생성하여 참고용으로 제공합니다. 현재 추세를 기반으로 목표가, 지지선 및 손절가를 계산합니다. 거래의 위험 대비 보상 비율(Risk/Reward)을 계산합니다. 계좌 잔고에 따라 포지션 크기를 산출하고 잠재 수익을 추정합니다. 시장에 중대한 변화가 발생할 경우 경고도 제공합니다. 지표의 주요 라인: 강세/약세 거래량 소진 라인 — 목표가로 사용됩니다. 시장 추세를 나타내는 라인. 시장이 강세인지 약세인지에 따라 색상이 변경되며 추세 지지선 역할을 합니다. 색상은 주로 시장 심리를 보여줍니다. 거래량 균형선(Eq). Eq(Volume Equilibrium) 라인은 시스템의 핵심입니
Stefanov
Ivan Stefanov
The indicator displays support and resistance zones defined logically using the MACD. The entire concept is explained in the video, with specific examples shown. The indicator works on any instruments and timeframes. It does not repaint. After placing it on the chart, please go through all the timeframes sequentially, from monthly to 1-minute, so that all lines load correctly. After that, you can start using it. The concept is unique and has not been seen in other systems or indicators.
Fifty Pro
Ivan Stefanov
5 (1)
FIFTY 인디케이터는 이제 자동화된 버전으로 제공되어 수동으로 레벨을 그릴 필요가 없습니다. 이 버전은 일간, 주간, 월간 및 연간 레벨을 자동으로 차트에 표시하여 정확성을 보장하고 시간을 절약합니다. 또한, 이러한 레벨의 표시 여부를 전환할 수 있는 버튼이 제공되어 완전한 사용자 맞춤 설정이 가능합니다. 수동 조작을 선호하는 사용자들을 위해 무료 버전도 계속 제공되며, 완전한 기능을 갖추고 있습니다. 트레이더는 자신의 거래 스타일에 맞춰 수동 또는 자동 도구를 선택할 수 있습니다. 가장 논리적인 인디케이터 중 하나. 높은 신뢰성. FIFTY 인디케이터는 이제 자동화된 버전으로 제공되어 수동으로 레벨을 그릴 필요가 없습니다. 이 버전은 일간, 주간, 월간 및 연간 레벨을 자동으로 차트에 표시하여 정확성을 보장하고 시간을 절약합니다. 또한, 이러한 레벨의 표시 여부를 전환할 수 있는 버튼이 제공되어 완전한 사용자 맞춤 설정이 가능합니다. 수동 조작을 선호하는 사용자들을 위해 무료 버
Naturu MT4
Ivan Stefanov
“Naturu”는 자연의 대칭성을 알고리즘으로 활용하는 수동 인디케이터입니다. 간단한 전략과 숨겨진 지혜로 시장을 제패하세요! 인디케이터를 로드하면 위(Top)와 아래(Bottom) 두 개의 라인이 표시됩니다. 라인을 한 번 클릭해 활성화한 후, 이동하고 싶은 캔들 위를 클릭하면 그 위치로 이동합니다. 사용자가 고점과 저점을 지정하면, 인디케이터가 자동으로 계산합니다: 마젠타 색 영역: 상승(불) 세력과 하락(곰) 세력의 관심이 가장 가까워져서 지지/저항이 될 가능성이 큰 구간 회색 영역: 다음 관심 구간 아쿠아 색 실선: 상승 세력의 목표가 골드 색 실선: 하락 세력의 목표가 수동 인디케이터는 실시간 시장 상황과 개인의 직관에 따라 레벨을 자유롭게 조정할 수 있는 완전한 제어력과 유연성을 제공합니다. 직접 가격 움직임을 분석함으로써 지지·저항과 패턴 형성을 본질적으로 이해할 수 있습니다. 인간의 판단을 통해 자동 시스템이 놓치거나 오해하기 쉬운 ‘노이즈’를 걸러내어 잘못된 신호를
RSI Divergence Pulse — Smart Divergence Scanner with MTF Panel, Zone Fill, Alerts & Dashboard SHORT DESCRIPTION Professional RSI indicator with automatic Regular & Hidden divergence detection, color-coded RSI line, Multi-Timeframe panel, OB/OS zone fills, Buy/Sell arrows, signal labels, real-time dashboard, and multi-channel alerts. Works on any symbol and timeframe. FULL DESCRIPTION
こちらが 韓国語訳 です。追加のコメントはありません。 인디케이터는 시장 참여자들이 관심을 드러내는 구역을 강조 표시하고, 그 다음 주문 누적 구역을 보여줍니다. Transaction Speed는 대규모 오더북처럼 작동합니다. 이것은 가장 큰 자금 흐름을 위한 인디케이터입니다. 성능은 매우 뛰어나며, 시장에 어떤 관심이 생기든 모두 볼 수 있습니다. Transaction Speed는 시장에서 대규모 주문이 어디에서, 언제 누적되는지를 보여주고 이를 활용할 수 있게 해주는 새로운 개념의 인디케이터입니다. 매우 초기 단계에서 추세 변화를 감지합니다. 포렉스에서 ‘거래량’이라고 부르는 것은 사실 잘못된 표현입니다. 실제로는 시간당 가격 변화이며, 올바른 이름은 트랜잭션 속도입니다. 우리가 어떻게 생각하고, 행동하고, 분석하느냐가 핵심입니다. 패러다임의 변화는 매우 중요합니다. 이 인디케이터는 포렉스의 거래량 개념을 완전히 재정의하며, 논리적으로 올바른 방식으로 정의하고 이를 적용함으로써 독특
Enigmera MT5
Ivan Stefanov
3.67 (3)
ENIGMERA: 시장의 핵심 (이 지표는 수동형 인디케이터이며, 현재 MetaTrader 테스트 환경에서 일부 기능이 지원되지 않을 수 있습니다) 소개 이 인디케이터와 트레이딩 시스템은 금융시장을 다루는 독창적인 접근 방식을 제시합니다. ENIGMERA는 프랙탈 사이클을 이용하여 지지선과 저항선을 정밀하게 계산합니다. 실제 매집 구간을 표시하며, 시장의 방향성과 목표를 제시합니다. 추세장이든 조정장이든 관계없이 작동하는 시스템입니다. 작동 방식 대부분의 기능은 차트 왼쪽에 있는 버튼을 통해 제어되며, 다양한 시장 상황에 빠르게 대응할 수 있습니다. 버튼 설명 ON/OFF – 전체 인디케이터를 표시하거나 숨깁니다. Support – 주요 추세 지지선입니다. Ch – 지지 채널을 활성화하여 허용 가능한 편차 범위를 표시합니다. Dev1 (1차 편차) – 지지선 내 가격 움직임을 표시하며, 시장의 조정 또는 에너지 축적을 시사합니다. Dev2 (2차 편차) – 편차 사이의 가격 움직임을
Fifty Pro MT5
Ivan Stefanov
가격만을 기준으로 레벨을 계산하는 몇 안 되는 인디케이터 중 하나입니다. 이 인디케이터는 시간 프레임, 추세 또는 시장 사이클의 영향을 받지 않습니다. 지금까지 만들어진 것 중 가장 논리적인 인디케이터 중 하나입니다. FIFTY 인디케이터는 이제 자동화 버전으로 제공되어 수동으로 레벨을 그릴 필요가 없습니다. 이 버전은 일간, 주간, 월간, 연간 레벨을 자동으로 차트에 표시하여 정확성을 높이고 시간을 절약해 줍니다. 또한, 이러한 레벨의 표시 여부를 전환할 수 있는 버튼이 제공되어 완전한 사용자 맞춤 설정이 가능합니다. 수동 방식을 선호하는 분들을 위해 무료 버전도 여전히 제공되며, 완전히 작동합니다. 사용자들은 자신의 트레이딩 스타일에 따라 수동 또는 자동 도구를 선택할 수 있습니다. 매우 신뢰할 수 있으며 강력히 추천드립니다! 수동 버전의 FIFTY 인디케이터를 지금 요청해 보세요!
전설적인 윌리엄 갠(William Gann) 수준을 완전 자동화하여 표시하는 MT5 인디케이터. GANN Master는 일간, 주간, 월간 데이터를 바탕으로 가격이 전환하거나 추세를 이어갈 가능성이 높은 핵심 구역을 정확히 포착합니다. 주요 기능 원클릭 기간 선택 버튼 : Daily, Weekly, Monthly 버튼 클릭 한 번으로 해당 일, 주, 월의 구역을 즉시 표시 자동 및 수동 모드 자동 모드: GANN Master가 모든 레벨을 자동으로 계산, 수동 입력 불필요 수동 모드: 차트에서 Top 및 Bottom 라인을 드래그하여 스윙 포인트를 설정하면, 모든 Gann 레벨이 즉시 재계산 매수 및 매도 레벨 : 강세(매수)·약세(매도) 레벨을 모두 표시, 레벨이 모일수록 강력한 지지/저항 구역 표시 다양한 자산 지원 : Forex, 귀금속(Gold 등), 지수, 암호화폐 등 고가 자산 모두 지원 — 설정에서 자산 클래스를 변경하면 자동으로 스케일 및 승수 조정 직관적 인터페이스
Speculator MT5
Ivan Stefanov
SPEKULATOR는 주요 지원 영역과 시장 방향을 식별하는 데 도움이 되는 수동 거래 시스템 및 지표입니다. 간단한 전략과 숨겨진 지혜로 시장을 마스터하세요. 차트에서 원하는 최고점(TOP)과 최저점(BOTTOM)을 선택하면 지표는 다음을 그립니다: 당신의 트렌드를 위한 지원 영역. 상승 추세에서는 녹색 영역이, 하락 추세에서는 빨간색 영역이 나타납니다. 지원 영역의 민감도는 지표 설정에서 조정할 수 있습니다. 이 영역은 선택한 추세를 기반으로 지원이 나타날 가능성이 있는 위치를 나타냅니다. 높은 편차선과 낮은 편차선 W.D. Gann의 9의 제곱에 따라 계산된 각도선 거래에 진입할 때: 높은 편차선이 위로 돌파되면 롱 포지션을 취합니다. 낮은 편차선이 아래로 돌파되면 숏 포지션을 취합니다. 시장이 편차선 사이에 있을 경우, 해당 구간 내에서 매수와 매도를 하며 지원 영역을 존중합니다. Gann의 각도선은 이익 실현 구간으로 가이드를 제공합니다. 핵심 수준은 360도 선입니다: 가
Naturu
Ivan Stefanov
5 (1)
“Naturu”는 자연의 대칭성을 알고리즘으로 활용하는 수동 인디케이터입니다. 간단한 전략과 숨겨진 지혜로 시장을 제패하세요! 인디케이터를 로드하면 위(Top)와 아래(Bottom) 두 개의 라인이 표시됩니다. 라인을 한 번 클릭해 활성화한 후, 이동하고 싶은 캔들 위를 클릭하면 그 위치로 이동합니다. 사용자가 고점과 저점을 지정하면, 인디케이터가 자동으로 계산합니다: 마젠타 색 영역: 상승(불) 세력과 하락(곰) 세력의 관심이 가장 가까워져서 지지/저항이 될 가능성이 큰 구간 회색 영역: 다음 관심 구간 아쿠아 색 실선: 상승 세력의 목표가 골드 색 실선: 하락 세력의 목표가 수동 인디케이터는 실시간 시장 상황과 개인의 직관에 따라 레벨을 자유롭게 조정할 수 있는 완전한 제어력과 유연성을 제공합니다. 직접 가격 움직임을 분석함으로써 지지·저항과 패턴 형성을 본질적으로 이해할 수 있습니다. 인간의 판단을 통해 자동 시스템이 놓치거나 오해하기 쉬운 ‘노이즈’를 걸러내어 잘못된 신호를
시장 변동성에 따라 계산 기간을 자동으로 조정하여 과매수 및 과매도 신호를 보다 정확하게 제공하는 고급 모멘텀 오실레이터입니다. 작동 방식 이 지표는 적응형 기간 계산을 사용하며, 변동성이 높을 때는 기간을 짧게 하고 변동성이 낮을 때는 기간을 길게 합니다. 이러한 동적 조정은 추세 시장에서는 더 빠른 신호를 제공하고, 횡보 시장에서는 거짓 신호를 줄여줍니다. RSI 값은 이 가변 기간을 기반으로 계산되므로 현재 시장 상황에 더욱 민감하게 반응합니다. 전통적인 30(과매도)과 70(과매수) 수준을 사용하지만, 적응형 특성으로 인해 이러한 수준에 도달할 때의 신뢰도가 더 높아집니다. 주요 특징: 시장 변동성에 따라 계산 기간 자동 조정 매수 / 매도 시점을 표시하는 차트 화살표 컬러 오실레이터: 50 이상은 녹색, 50 이하는 빨간색 추세 시장에서 더 빠른 반응 횡보 시장에서 거짓 신호 감소 리페인트 없음 지표 — 캔들 마감 후 값이 고정됨 모든 타임프레임과 모든 시장에서 작동
필터:
Mase
1794
Mase 2026.07.04 09:03 
 

like all of Ivans Indicators big value add. In this case its masterpiece, highly recommend it. As always Ivan is very supportive and steady improving, its big joy with him. Big thx Ivan

Valeriu-alexandru Petrache
183
Valeriu-alexandru Petrache 2026.03.24 21:53 
 

The best system on the market. I recommend it with pleasure. Ivan has the best indicators and the most profitable systems. He is a wonderful man, who is happy to help you and who works on improvements every day.

리뷰 답변