Meravith Scanner

5

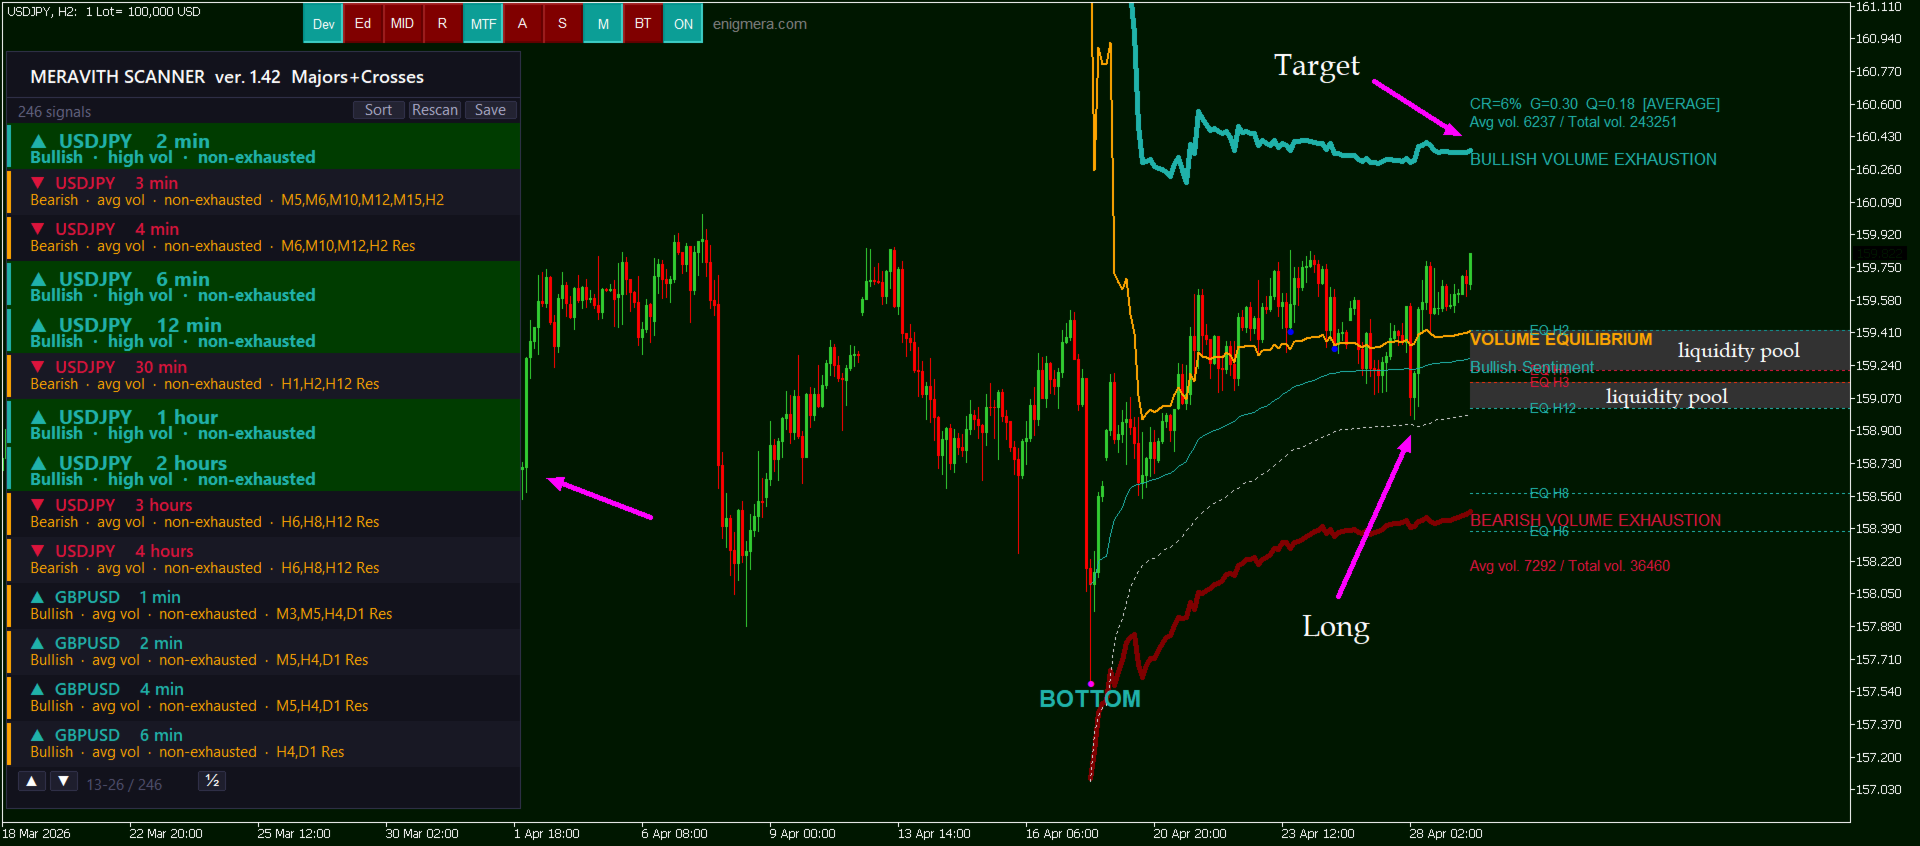
MERAVITH SCANNER 是一款适用于 MetaTrader 5 的专业金融市场指标,将多种分析工具整合为一个统一的系统。它基于专有的成交量加权平均价格(VWAP)方法自动完成所有计算,完全消除主观判断。

该指标适用于所有资产类别(外汇、股票、指数、大宗商品、加密货币)以及从 M1 到 Monthly 的所有时间周期。其核心原理是价格跟随成交量。MERAVITH 识别机构资金成交量的集中区域,并从该集中区域中推导出数学上精确的价格水平。它不预测,不推测。它只计算。

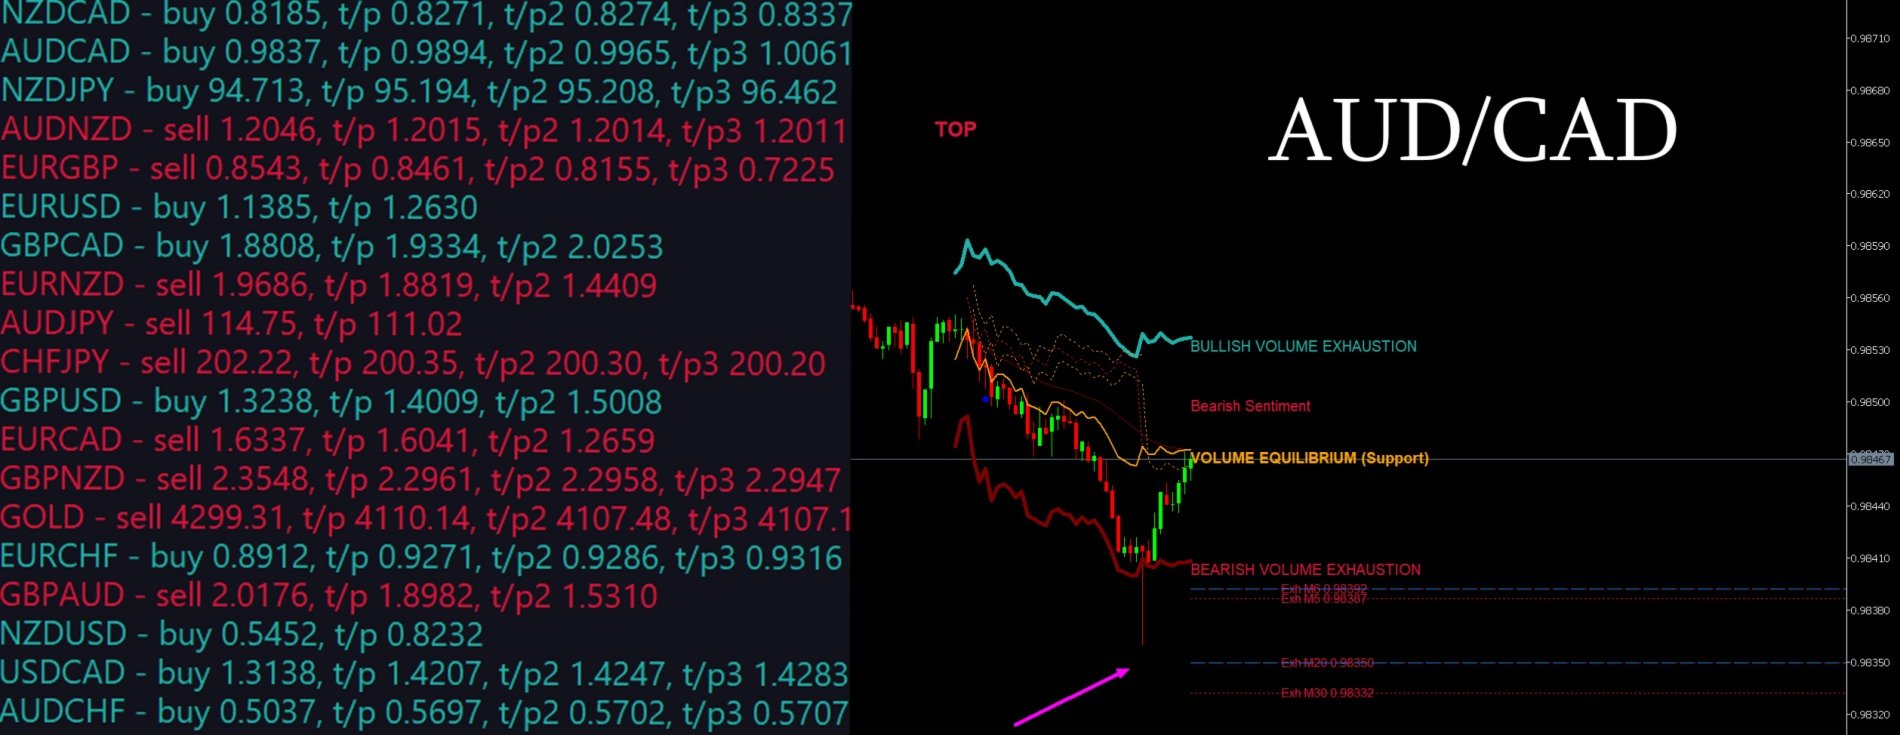
使用 MERAVITH SCANNER,您可以在 2–3 分钟内扫描全部 28 个主要外汇货币对的所有时间周期。您也可以扫描任何您选择的市场——例如,大约 100 只股票约需 10 分钟。

该指标计算耗尽水平、平衡线、偏差、统计水平以及目标投射。

图表元素

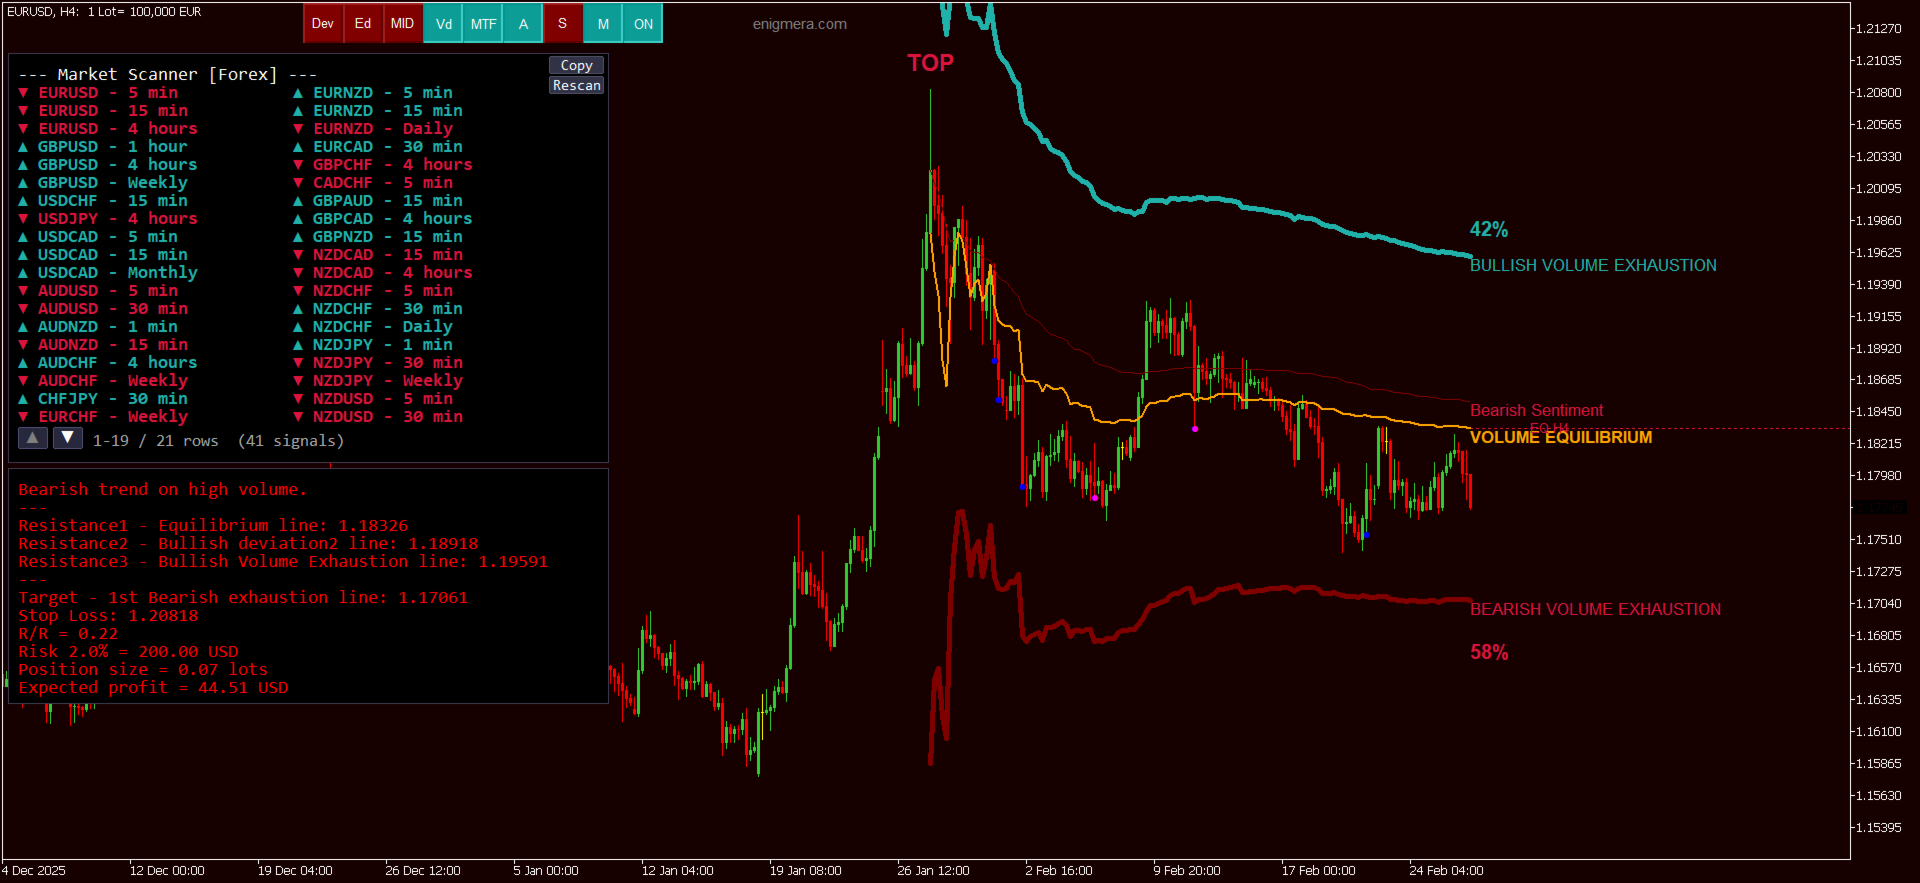
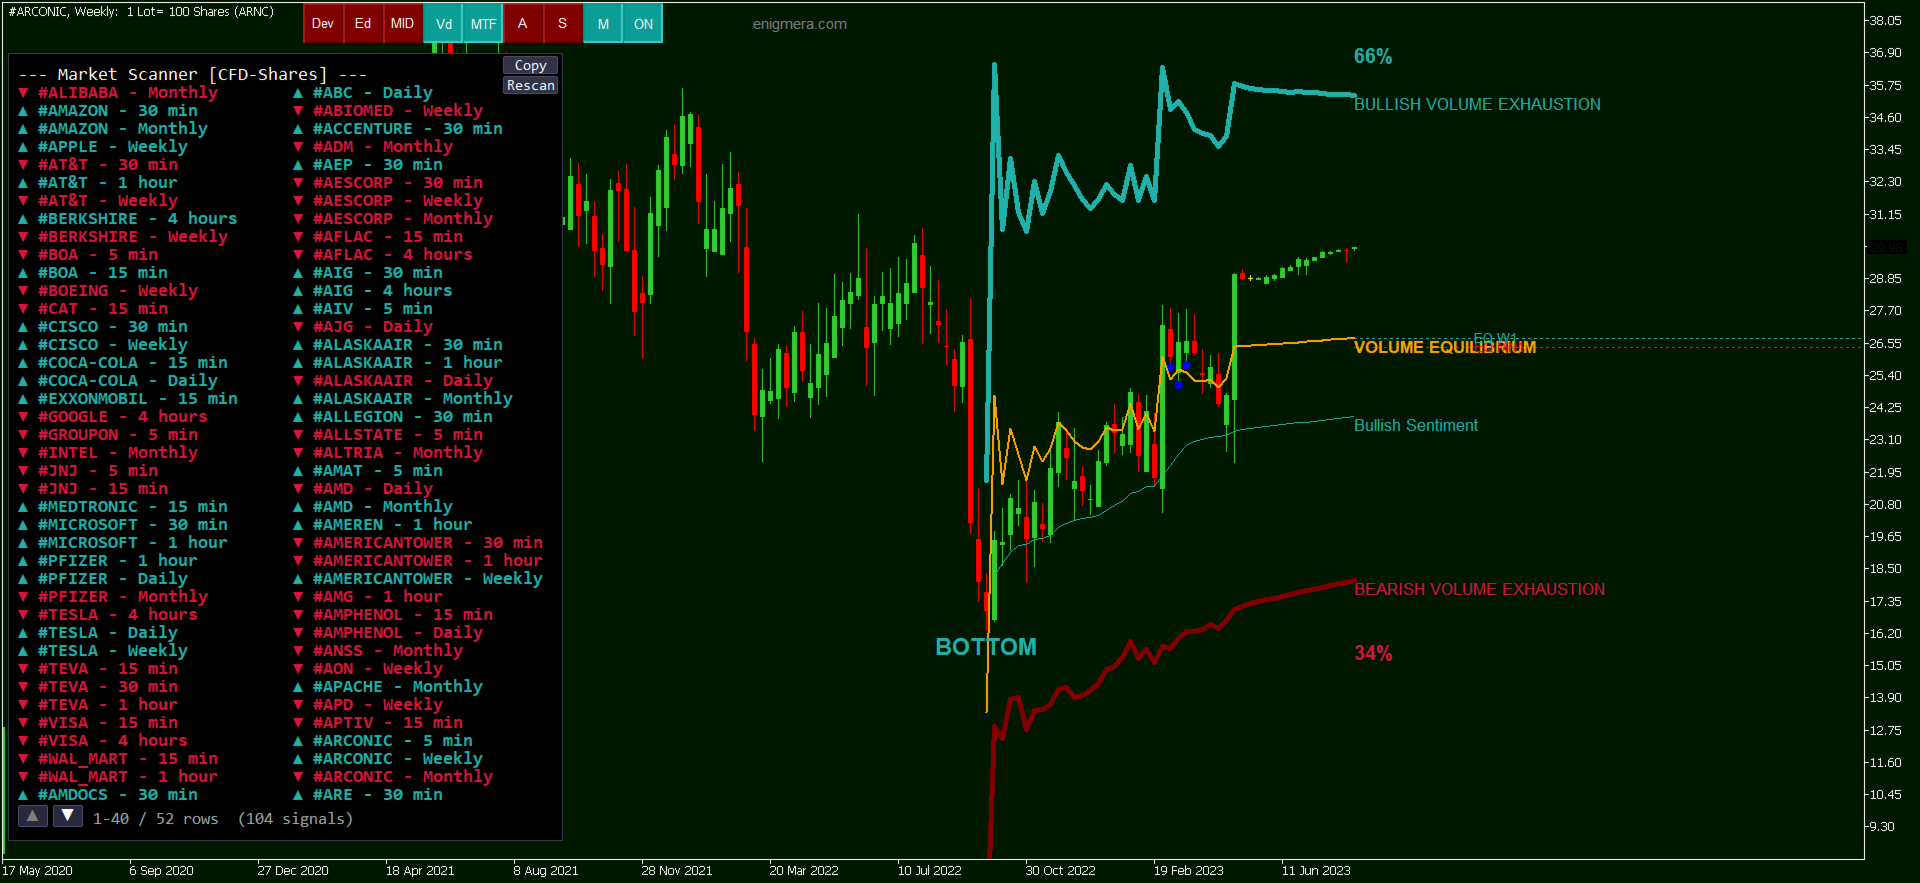
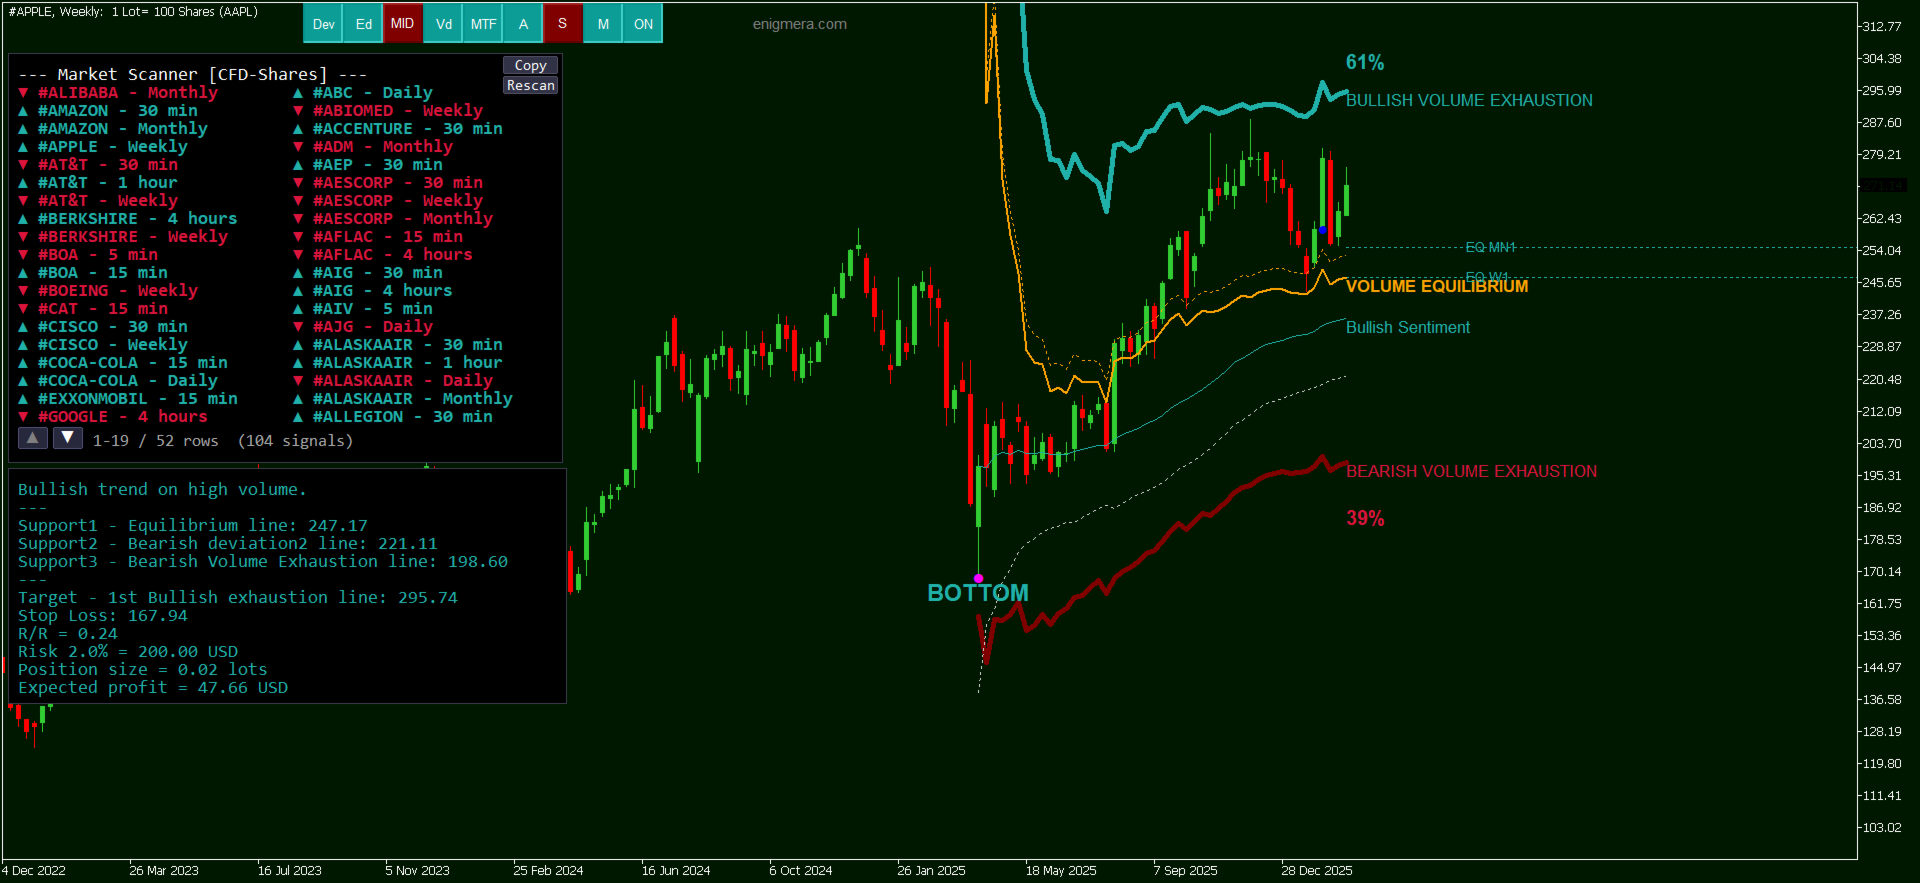
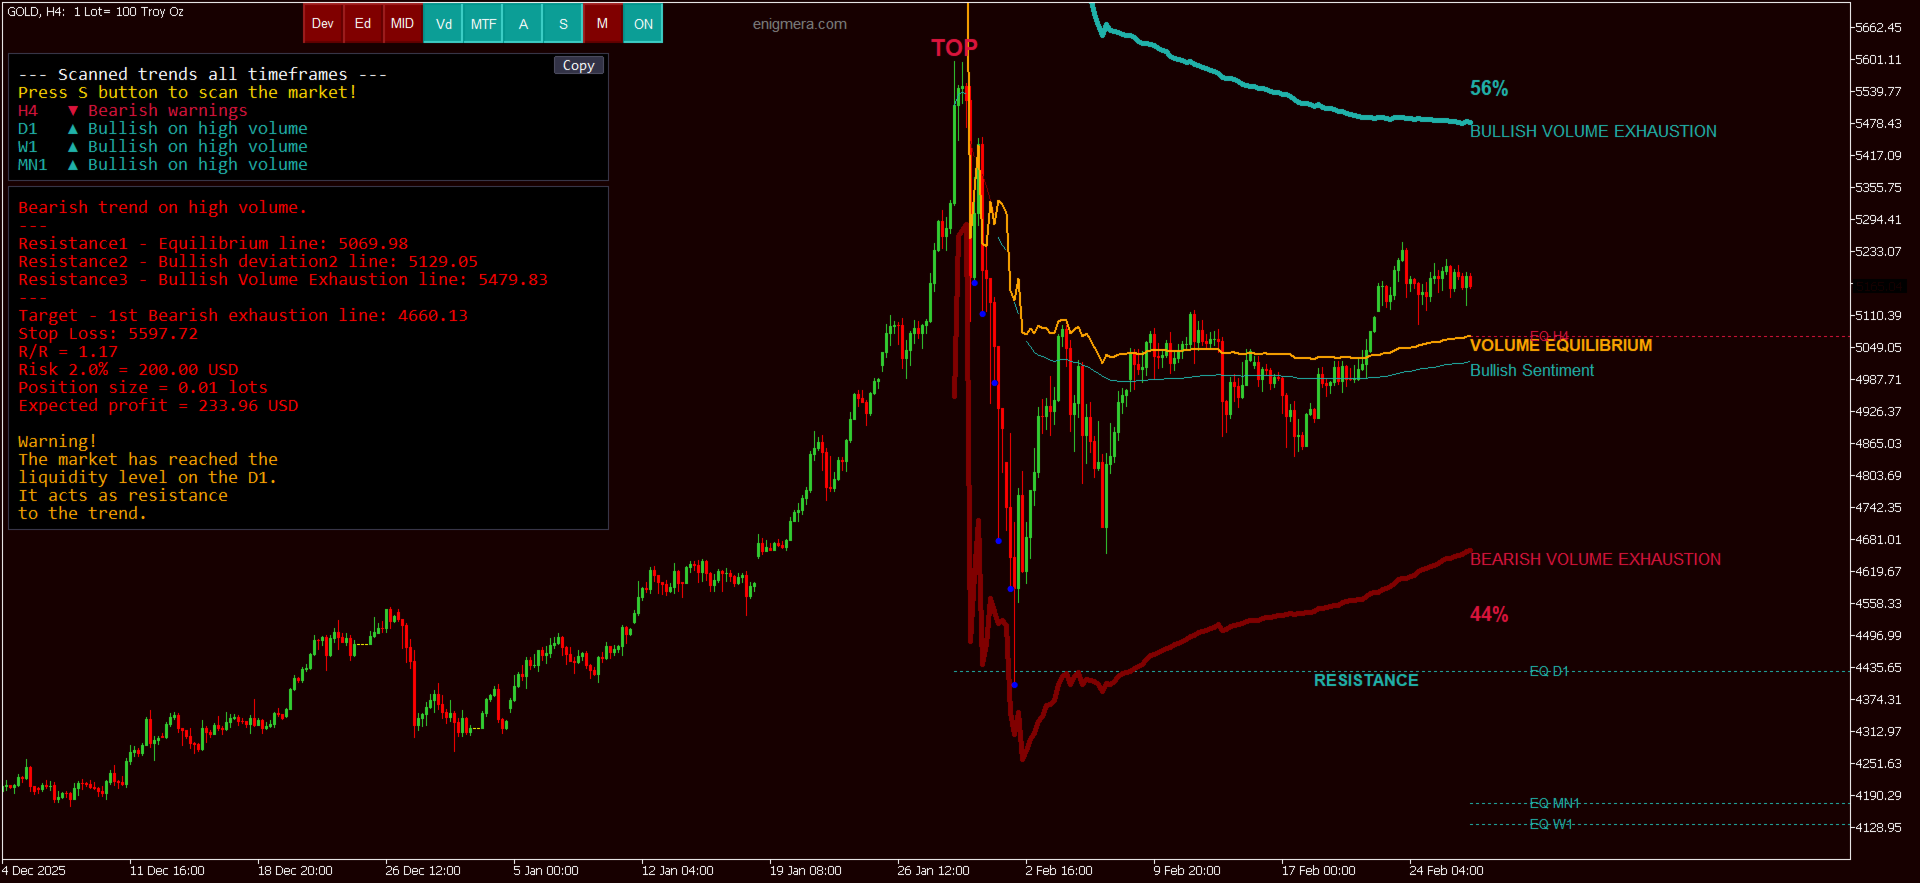
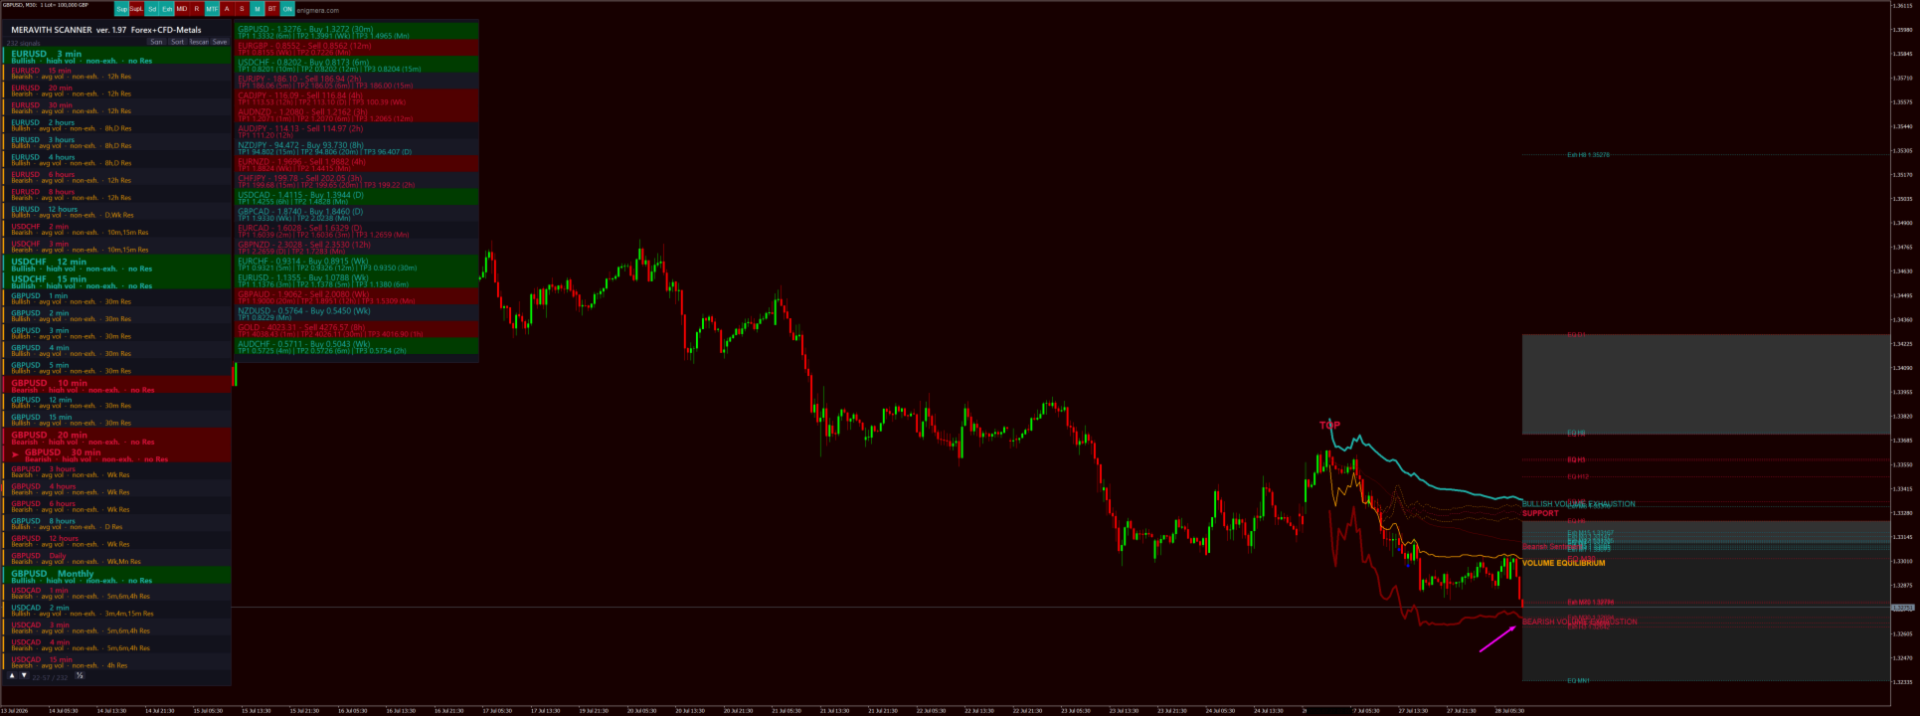
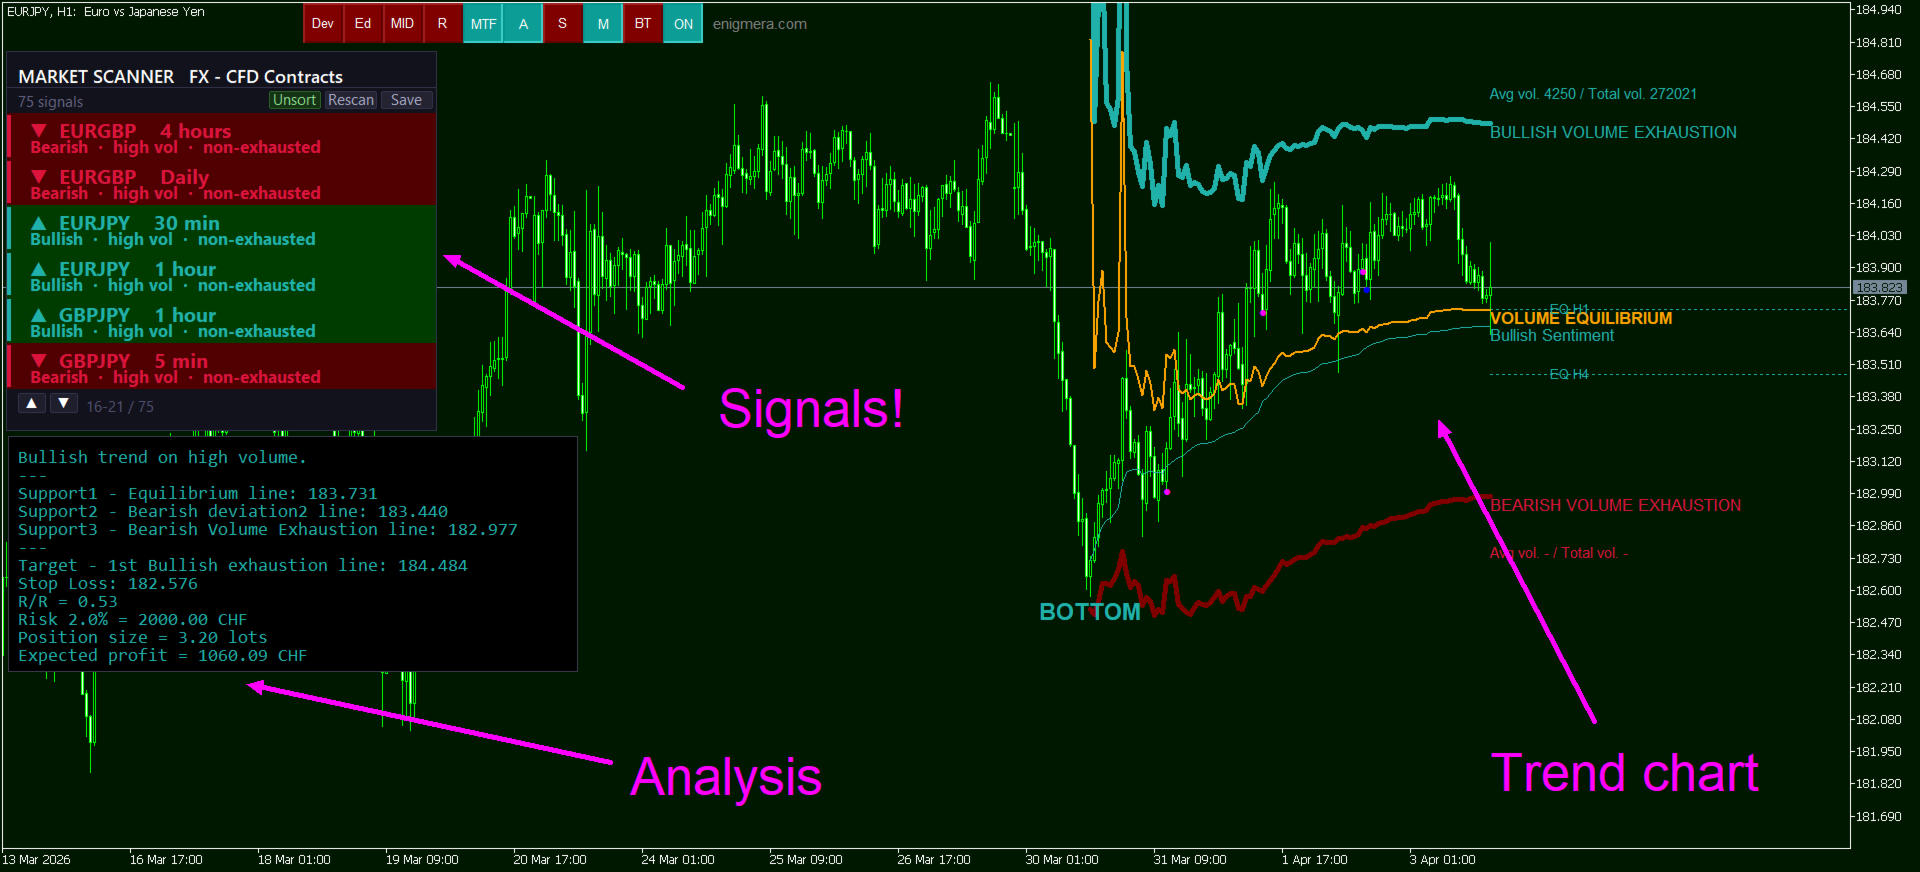
Origin Point 标记所有计算的起始位置。指标会自动将其放置在最佳位置。红色标签(TOP)表示市场高点并带有看跌倾向。绿色标签(BOTTOM)表示市场低点并带有看涨倾向。

Sentiment Line 是一条动态曲线,反映基于成交量加权计算得出的市场情绪。红色表示空头状态,绿色表示多头状态,白色表示罕见的过渡状态。

Exhaustion Lines 是粗实线,表示方向性成交量达到耗尽的位置。绿色粗线表示多头耗尽水平(上行目标)。红色粗线表示空头耗尽水平(下行目标)。这些水平按顺序出现,最多可达 12 层。只有当价格达到前一层后,下一层才会出现。当新的层级不再出现时,行情接近完全耗尽。

Volume Equilibrium Line 是一条橙色实线,表示最高多头耗尽水平与最低空头耗尽水平之间的中点。它作为流动性轴心,是主要成交量集中区域;在多头趋势中充当动态支撑,在空头趋势中充当动态阻力,同时也是止损参考点。持续性突破将使当前趋势假设失效。

Volume Dots 出现在具有统计显著成交量的K线下方。蓝点表示成交量超过 2 个标准差,代表显著的机构活动。紫点表示成交量超过 3 个标准差,代表极高置信度的机构参与。若成交量点仅出现在平衡线的一侧,则确认趋势;若两侧均出现,则市场可能处于震荡区间。

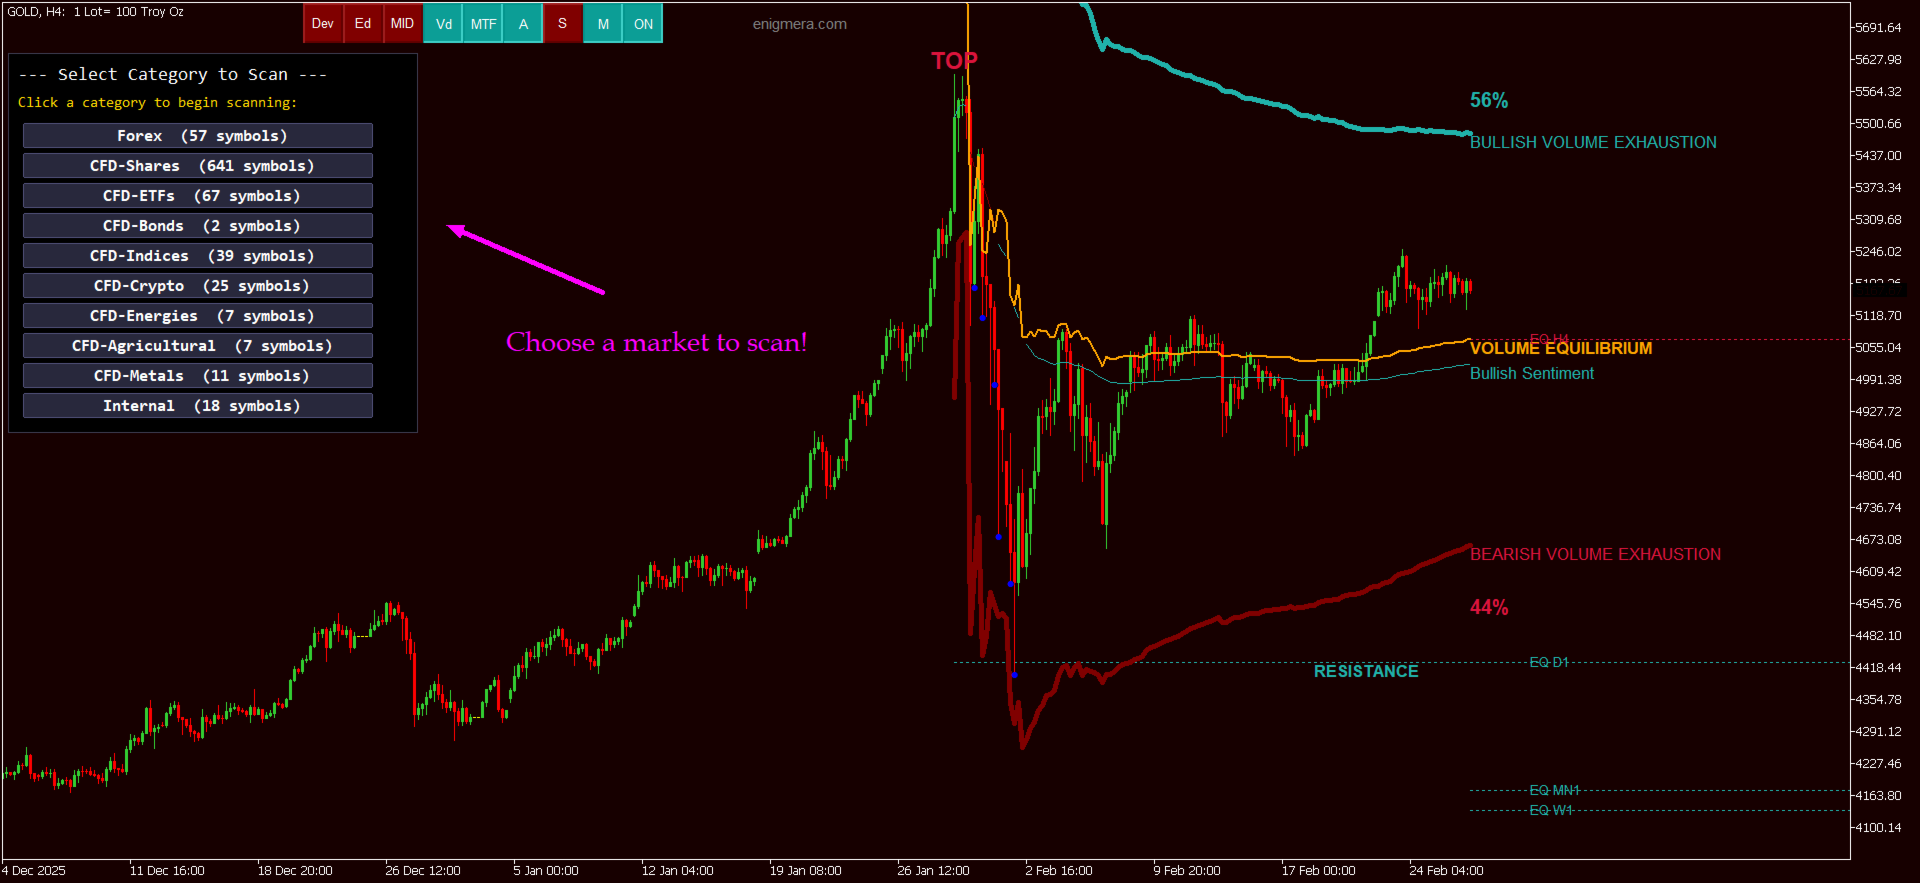
MTF Horizontal Lines 是来自更高时间周期的虚线水平平衡线。在 H1 图表上将显示来自 H4、D1、W1 和 MN1 的线条。绿色表示该周期为多头趋势,红色表示为空头趋势。当价格接近与当前趋势相反的高周期平衡线时,该线会闪烁并出现 RESISTANCE 标签。

图表背景颜色提供即时方向识别。深绿色背景表示多头状态。深红色背景表示空头状态。

控制按钮

指标在图表顶部设有 9 个控制按钮。绿色表示启用状态,深红色表示未启用。

Dev(Deviation)显示额外的偏差线,代表成交量加权平均值的双倍偏差。用于提供辅助支撑或阻力水平,以优化止损设置或识别反转区域。

Ed(Equilibrium Deviation / Channel)在平衡线周围显示波动通道。价格通常在通道内波动。突破通道边界表示异常强劲的方向性动能。

MID(0%、50%、100% Levels)显示三条黄色虚线参考线,定义当前趋势的价格区间。50% 水平用于回撤参考。跌破 0% 表明趋势可能已终止。

Vd(Volume Dots)用于开启或关闭蓝色与紫色成交量点。此功能对趋势验证至关重要,应始终保持开启。

MTF(Multi-Timeframe Lines)用于开启或关闭来自更高时间周期的虚线平衡线,揭示低周期中不可见的结构性障碍,应始终保持开启。

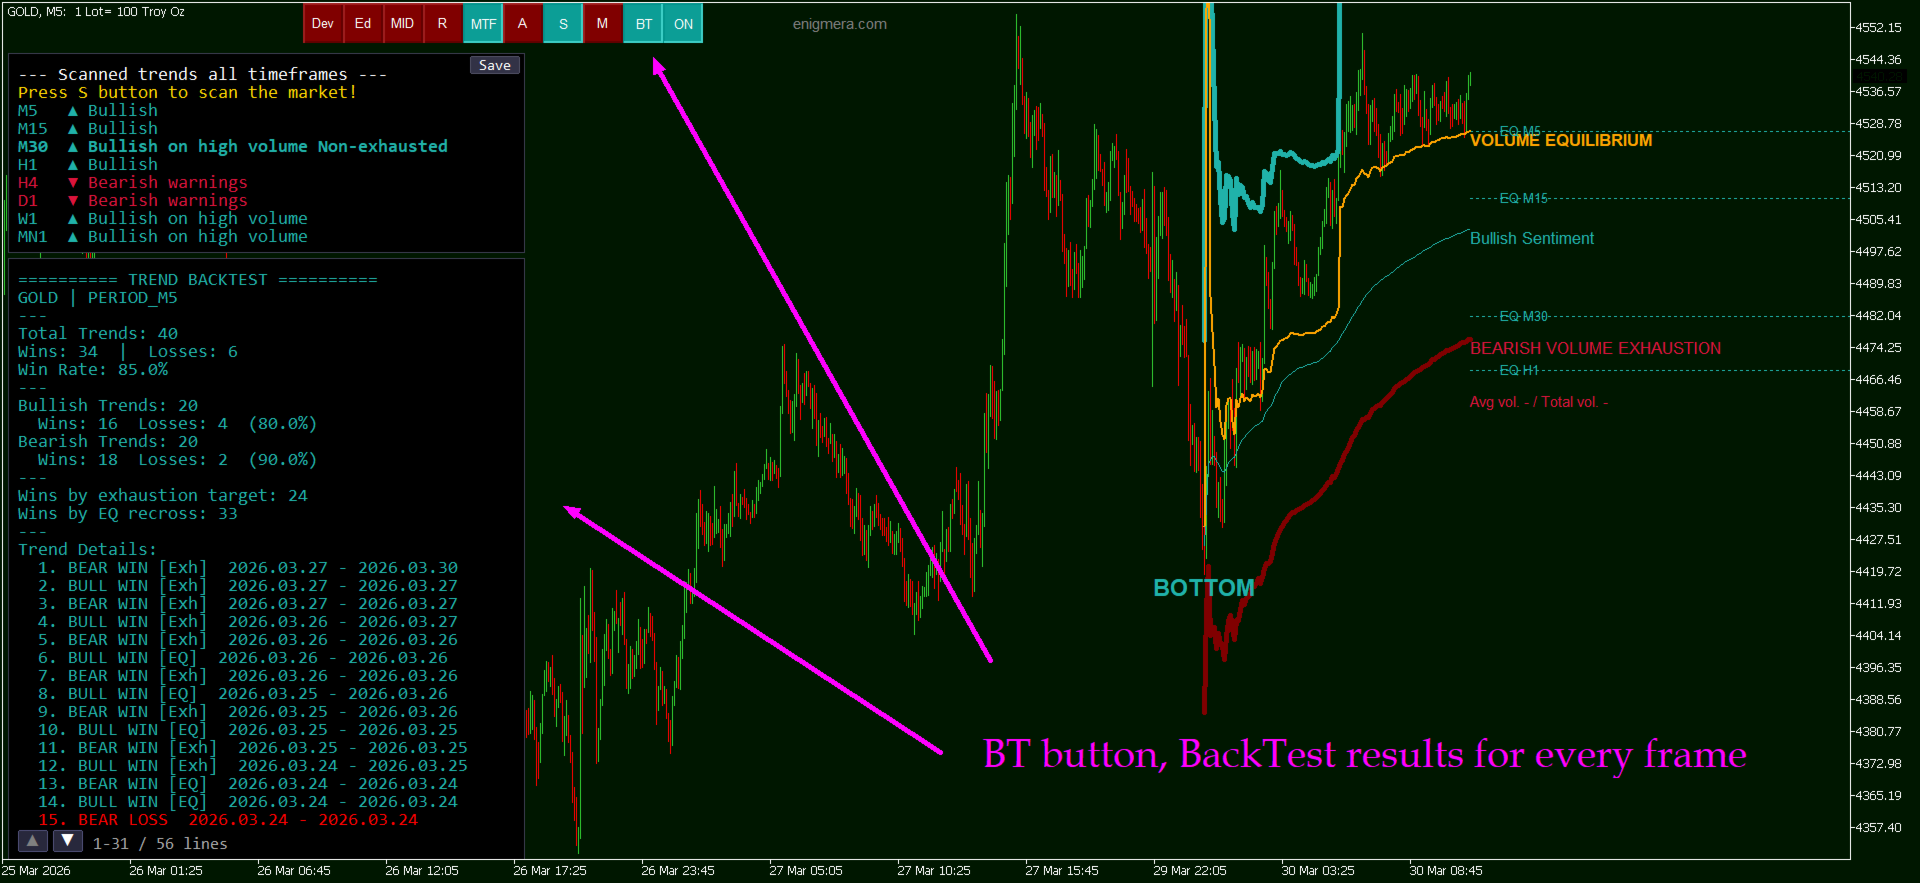
A(Analysis)显示完整分析文本面板,包括:趋势方向、成交量质量、支撑/阻力水平、目标价、止损位、风险回报比、手数规模、预期利润、更高周期目标以及任何警告。警告包括双侧成交量、价格位于流动性之下或之上、高周期阻力、区间市场以及反向成交量。

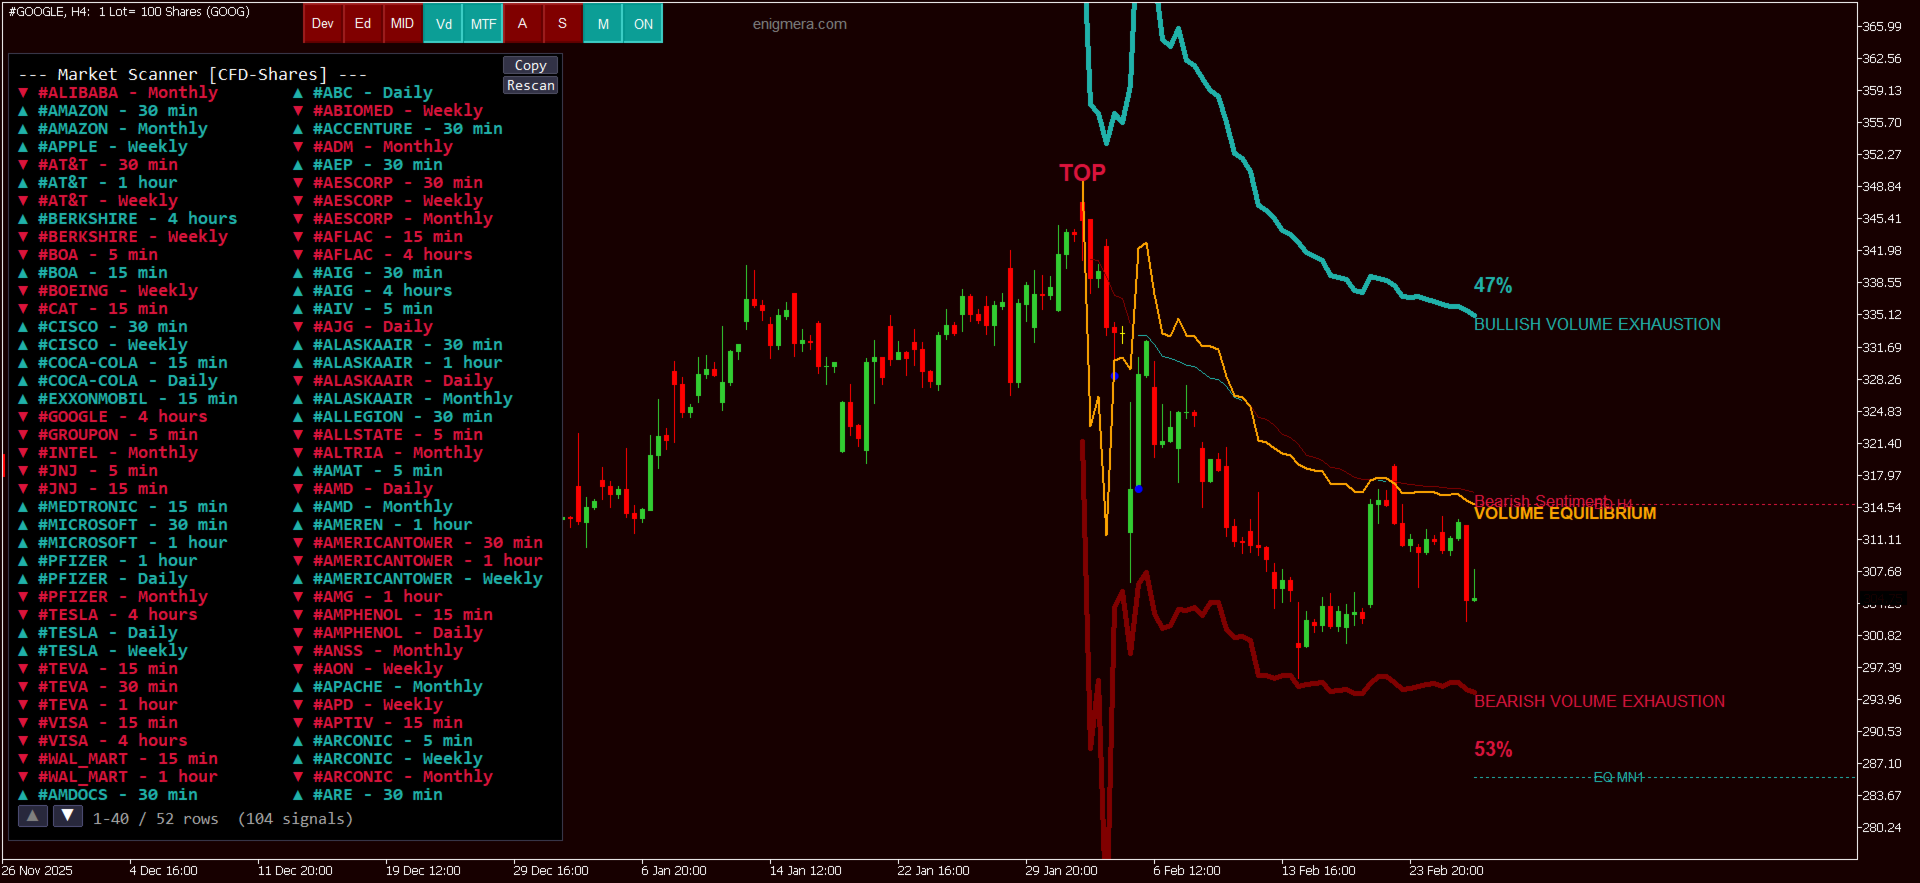
S(Scan / Multi-Timeframe Trend Summary)显示从当前周期到 Monthly 的所有时间周期趋势方向。加粗标记为 Non-exhausted 且伴随高成交量的行表示最高置信度信号,即趋势受到机构成交量支持且尚未达到耗尽水平。点击任意行即可切换至对应周期。Copy 按钮可将结果导出为文本文件。

M(Market Scanner)是综合市场扫描器,可对经纪商提供的所有交易品种在 9 个时间周期上进行全自动系统分析。按下 M,选择类别(外汇、指数、加密货币、大宗商品等),扫描器即执行完整分析。结果以颜色面板显示,仅展示具备最佳条件的品种:高机构成交量、趋势未耗尽、无活跃警告。点击任意结果即可立即跳转图表。扫描器会保存所有已扫描类别的结果。先扫描外汇,再扫描加密货币,系统会缓存两者。之后返回外汇时无需重新扫描即可立即显示结果。该缓存机制在更换图表品种或重启终端后仍然有效。Rescan 按钮可强制重新扫描当前类别。

ON/OFF 用于整体开启或关闭指标。关闭时,所有线条、水平和面板将隐藏,但控制按钮仍保持可见。

警报系统

在图表上三次点击可创建一条黄色虚线水平警报线。当价格到达该水平时,指标会弹出提示框、播放声音通知,并可选择发送电子邮件、推送通知或截取屏幕截图。点击该线即可删除。

可配置的警报选项包括:电子邮件警报、移动推送通知、触及平衡线警报、反趋势成交量警报以及首次耗尽突破警报。

风险管理

RiskPercent 输入参数(默认 2%)用于设置每笔交易承担的账户权益风险比例。分析面板会根据该参数自动计算适当的手数规模及预期利润。

输入参数

IndicatorID —— 唯一标识符,允许在同一图表上运行多个指标实例而不冲突。
IgnoreWeekendBars —— 在 D1 周期排除周六和周日K线。建议开启。
ShowFirstTouchDots —— 在首次触及耗尽水平时显示菱形标记。
RiskPercent —— 每笔交易风险百分比,默认 2%。
BlinkVolumeDots —— 在有警告时启用成交量点闪烁。
EnableEmailAlerts —— 启用电子邮件警报。
EnablePushAlerts —— 启用移动推送警报。
EnableEquilibriumAlert —— 触及平衡线时警报。
EnableWrongSideDotAlert —— 成交量点出现在趋势错误一侧时警报。
EnableExhaustionAlert —— 达到首个耗尽线时警报。
EnableChartScreenshot —— 触发警报时自动截图并通过 FTP 发送。
AutoScanTFTrend —— 定期自动扫描所有时间周期。
AutoScanIntervalMin —— 自动扫描间隔(分钟)。
按钮背景、按钮文字及标签颜色的自定义设置。

该指标适用于经纪商提供的所有交易品种及所有时间周期。更高时间周期产生更强、更可靠的水平。所有水平均由算法计算,确保十位交易者在同一图表上使用 MERAVITH 时将看到完全一致的水平。耗尽水平基于标准差计算,随着价格触及更高层级的耗尽水平,均值回归的统计概率随之增加。
评分 2
Mase
1794
Mase 2026.07.04 09:03 
 

like all of Ivans Indicators big value add. In this case its masterpiece, highly recommend it. As always Ivan is very supportive and steady improving, its big joy with him. Big thx Ivan

Valeriu-alexandru Petrache
183
Valeriu-alexandru Petrache 2026.03.24 21:53 
 

The best system on the market. I recommend it with pleasure. Ivan has the best indicators and the most profitable systems. He is a wonderful man, who is happy to help you and who works on improvements every day.

推荐产品
Win43 Scalper
Eadvisors Software Inc.
O novo s43 Scalper para Mini-Índice (WIN-IND) faz operações de curto prazo no timeframe 1min buscando pequenas variações do mercado, utiliza nova tecnologia de trade, os resultados no intraday são íncríveis, confira:      Após a instalação adicione no gráfico dos instrumentos win para visualizar os resultados no backteste. Recomendamos o timeframe de 1min.
BTC Quantum AI Scalper PRO 適用於 MetaTrader 5 的專業比特幣 AI 交易指標 BTC Quantum AI Scalper PRO 是一款新一代比特幣交易系統,它結合了經典的技術分析、市場情緒分析以及自主研發的基於 AI 的機率引擎。 與僅依賴移動平均線或震盪指標的傳統指標不同,此系統可同時分析多個關鍵市場因素: • 恐慌與貪婪指數 • 資金費率 • 資金費率變化 • 未平倉合約變化 • 多空比率 • 吃單者買賣比率 • 成交量變化 • 加密貨幣新聞情緒 基於這些資料來源,該指標會計算出一個專有的 AI 評分,並僅識別出最強勁的交易機會。 主要功能 買進和賣出訊號 基於機率的交易過濾 TP1 和 TP2 目標 動態止損 即時警報和通知 趨勢確認系統 可視化交易管理級別 推薦用途 • 比特幣短線交易 • 日內交易 • 動量交易 • 高波動性市場 推薦時間週期 M1 M5 此指標針對需要快速決策並同時嚴格控制風險的交易者進行了最佳化。 額外贈送 每次購買均包含

Mean Reversion Supply Demand Indicator Mean Reversion Supply Demand is the indicator to detect the important supply demand zone in your chart. The concept of supply demand trading relies on the quantity mismatching between buying and selling volumes in the financial market. Typically, supply demand zone serves to predict the turning point. The wave pattern, for any supply demand zone to work as an successful trade, looks like the price must touch the base zone, move away and then return to zone
PREngulfing
Slobodan Manovski
PR EA - 吞没形态交易系统 自动识别吞没形态,均线确认信号 PR EA是一款MetaTrader 5专家顾问,专门用于识别并交易看涨/看跌吞没形态,并通过移动平均线过滤确认信号。优化适用于30分钟图表,同时兼容M15和H1时间框架。 核心功能: 形态识别 - 精准检测有效的吞没K线形态 趋势确认 - 238周期SMA过滤器(参数可调) 风险管理 - 自定义止损、止盈 + 可选追踪止损 时间框架优化 - 专为M30图表设计(兼容M15/H1) 仓位控制 - 同一时间仅持有一个仓位 推荐设置: 最佳表现:M30时间框架 不建议使用:高于H1的时间框架 自定义选项: 可调整交易手数 灵活设置止损/止盈值 追踪止损功能 均线周期调节 点差过滤,避免低效执行 适合以下交易者: 偏好自动K线形态交易 需要均线确认的反转策略 波段交易(30分钟-1小时图表) 规则明确的交易系统 "通过均线确认的吞没形态交易信号" MT5专用 • 需MetaTrader 5平台 • 兼容所有经纪商
Manyal trading system, CovEchoTrend Robot, focuses on reliability and flexibility. By employing statistical analysis methods to study the relationships between the base indicator and market patterns, the system enables a deeper understanding of market processes. Intelligent pattern analysis: The application of statistical data processing helps identify key trend reversal points more accurately, signaling significant market shifts. Informed decision-making is based on the intersection of indicato
Flashe
Kodjo Olivier Leonard Daga
FLASHE INDICATOR - La Révolution du Trading Intelligent PRÉSENTATION FLASHE INDICATOR est un système de trading de nouvelle génération qui repousse les limites de l'analyse technique traditionnelle. Développé par l'équipe DovTech, cet indicateur allie intelligence artificielle et algorithmes propriétaires pour offrir une expérience de trading unique. Conçu aussi bien pour le Day Trading que pour le Swing Trading, FLASHE s'adapte à toutes les conditions de marché et à tous les styles de
Max Ribbon Mt5
Stefano Frisetti
WARNING: This indicator is distributed EXCLUSIVELY on MQL5.com MT4 version:   https://www.mql5.com/it/market/product/160363 MT5 version:   https://www.mql5.com/it/market/product/160410 MAX RIBBON ver 1.00 The indicator that shows you the TREND clearly and unambiguously! DESCRIPTION MAX RIBBON is an advanced trend indicator that combines two ribbon systems to accurately identify market direction: • MaxRib2 (Fast Ribbon): Responsive to short-term movements, ideal for capturing rapid reversals and
Capital Smart
Yvan Musatov
Innovative trading robot Smart Capital: Your reliable partner in the Forex market Smart Capital is an advanced trading robot created for deep analysis of financial markets using specialized algorithms. This robot is designed to evaluate complex market data, which allows it to accurately predict trend changes and make optimal trading decisions. With its help, you can significantly increase the efficiency of your investments. Advantages of Smart Capital Unique analysis system: Smart Capital app
Expert. Automatic and manual trading. Ready-made trading system based on Elliott waves and Fibonacci retracement levels . It is simple and affordable. Display of the marking of Elliott waves (main or alternative option) on the chart. Construction of horizontal levels, support and resistance lines, a channel. Superposition of Fibonacci levels on waves 1, 3, 5, A Alert system (on-screen, E-Mail, Push notifications).    visual panel for opening orders in manual trading. visual panel for setting up
Introduction to Harmonic Pattern Scenario Planner The present state of Forex market can go through many different possible price paths to reach its future destination. Future is dynamic. Therefore, planning your trade with possible future scenario is an important step for your success. To meet such a powerful concept, we introduce the Harmonic Pattern Scenario Planner, the first predictive Harmonic Pattern Tool in the world among its kind. Main Features Predicting future patterns for scenario
Gartley Projections D
Oleksandr Medviediev
3 (2)
具有经过验证的概念和盈利能力的最佳、最有效、可靠的产品。感谢您的考虑。  该指标根据H.M.Gartley的发展(《股票市场利润》,1935年)识别和确认谐波模式(XABCD)。 它将D点投影为透视投影中的一个点(在设置中指定ProjectionD_Mode = true)。 不会重绘。当工作时间段的柱形图关闭时,如果已识别的模式点在Patterns_Fractal_Bars柱中未移动,则在图表上出现一个箭头(指向预期价格运动的方向)。从此刻起,箭头将永久保留在图表上。 注意:连续出现2-3个或更多箭头 - 这是市场条件的变化,而不是重绘。 总共有85种模式(包括Gartley-222和Gartley-222WS,完整列表可在评论部分的Google Drive链接中找到)。在所有已识别的模式中,只有最新识别的模式填充了单一颜色。 参数 DrawPatterns(true/false)- 以实心颜色绘制模式 ProjectionD_Mode(true/false)- 定义D点作为透视投影模式 Patterns_Fractal_Bars - 在认定为形成分形的情况下,最新识
Overview Harmonic Patterns MT5 is a technical analysis indicator designed for the MetaTrader 5 platform. It identifies and displays harmonic price patterns, such as Butterfly, Cypher, Crab, Bat, Shark, and Gartley, in both bullish and bearish directions. The indicator calculates key price levels, including entry, stop loss, and three take-profit levels, to assist traders in analyzing market movements. Visual elements and customizable alerts enhance usability on the chart. Features Detects six ha
SPECIAL LAUNCH OFFER: $30 (1-Month Rent) Limited time offer to build our community and gather feedback! AmbM GOLD Institutional Scalper A high-precision M5 algorithm for XAUUSD (Gold) , engineered to trade exclusively at Institutional Liquidity Levels ($5/$10 psychological marks). PERFORMANCE DATA (BUY ONLY) • Win Rate: 87.09%. • Safe Growth: +$4,113 profit on $10k (13.75% Max Drawdown). • Extreme Stress Test: Successfully generated +$22,997 in a 5-year stress test (2020-2026), proving
M & W Pattern Pro is an advanced scanner for M and W patters , it uses extra filters to ensure scanned patterns are profitable. The indicator can be used with all symbols and time frames. The indicator is a non repaint indicator with accurate statistics calculations. To use , simply scan the most profitable pair using the statistics dashboard accuracy , then enter trades on signal arrow and exit at the TP and SL levels. STATISTICS : Accuracy 1 : This is the percentage of the times price hits TP
SMC Market Structure PRO — 订单块、FVG、流动性与汇合区指标 不再靠猜测。开始像大资金那样解读市场。 SMC Market Structure PRO 自动在图表上识别聪明钱的关注区域——订单块(Order Blocks)、公允价值缺口(FVG)以及时间失衡区,并高亮显示三种结构相互重叠的汇合区(Confluence Zones)。价格恰恰最常在这些区域产生反应。 这是一款基于聪明钱概念(Smart Money Concepts / ICT)方法论的完整市场结构分析工具。它适用于任意品种和任意周期,启动时自动处理历史数据,并在每根新K线上更新——已形成的区域不会重绘。无需堆叠十几个零散指标,您即可在图表上获得一张完整的机构意图地图。 核心功能 自动订单块(看涨与看跌) 指标不只是简单地标出一根大K线。它会验证真正的 SMC 条件:实体至少占整根K线幅度的 60%、流动性抓取(liquidity grab)以及随后的价格位移(displacement)。只有经过确认的订单块才会显示在图表上。 公允价值缺口(FVG / 失衡区) 精确识别三K线价格缺口,并带有最
FVG Sessions
Thi Thanh Huong Vo
The FVG Sessions indicator highlights the first fair value gap of the trading session as well as the session range. Detected fair value gaps extend to the end of the trading session. Alerts are included on the formation of a session fair value gap, price being within a session fair value gap, mitigations, and price crossing session fair value gaps average. Trader ICT states that the first fair value gap of the trading session can attract the most significant reaction. Having only one FVG per
WanaScalper
Isaac Wanasolo
1 (1)
A scalping indicator based on mathematical patterns, which on average gives signals with relatively small SL, and also occasionally helps to catch big moves in the markets (more information in the video) This indicator has three main types of notifications: The first type warns of a possible/upcoming signal on the next bar The second type indicates the presence of a ready signal to enter the market/open a position The third type is for SL and TP levels - you will be notified every time price re
This indicator is, without a doubt, the best variation of the Gann Angles among others. It allows traders using Gann methods to automatically calculate the Gann angles for the traded instrument. The scale is automatically calculated when the indicator is attached to the chart. When switching timeframes, the indicator recalculates the scale for the current timeframe. Additionally, you can enter your own scales for the Gann angles. You can enter your own scales either for both vectors or for each
ENGLISH DESCRIPTION (MQL5 Standard Optimized) Product Name: Obsidian Forest Automaton AI (MT5) [Subtitle: Forest Structure | Obsidian Blade TEMA | Shield Safety] Introduction Obsidian Forest Automaton AI is a structural trend-following construct designed to navigate the market with the cold precision of an automaton. It builds a "Forest Structure" using Ichimoku Cloud , cuts through noise with the Obsidian Blade (TEMA) , and validates density with Standard Deviation . This creates a system that
Uno Quant Trader
Mark Joseph Borromeo Juan
UNO Quant Trader UNO Quant Trader is a premium market-bias and trade-planning indicator built for traders who want cleaner decisions, faster chart reading, and a professional dashboard view. This indicator uses a multi-layer mathematical market model designed to analyze price behavior, momentum pressure, imbalance zones, trend strength, market exhaustion, and high-probability trade areas. Instead of relying on emotion or random entries, UNO Quant Trader helps you read the market using structured
Meravith MT5
Ivan Stefanov
5 (3)
做市商工具。 Meravith 将: 分析所有时间周期并显示当前正在运行的趋势。 标注流动性区域(成交量均衡区),即多头与空头成交量相等的位置。 在您的图表上直接显示来自不同时间周期的所有流动性水平。 生成并展示基于文本的市场分析供您参考。 根据当前趋势计算目标位、支撑位和止损位。 计算交易的风险回报比。 根据您的账户余额计算仓位大小,并估算潜在利润。 在市场出现重大变化时,Meravith 还会发出警告。 指标的主要线条: 多头/空头成交量衰竭线 —— 作为目标位使用。 趋势线 —— 指示市场趋势方向。根据市场是多头还是空头而改变颜色,并作为趋势支撑。其颜色主要反映市场情绪。 成交量均衡线(Eq)—— Eq(Volume Equilibrium)是系统的核心。它表示买卖双方成交量的平衡点,即市场流动性所在位置。向上突破 Eq 表示多头倾向,向下突破 Eq 表示空头倾向。突破后,应等待回调——当价格回到相反趋势的偏离线或衰竭线附近时。 使用方法:只需将其添加到图表中。 Meravith 可以分析一切——趋势和回调。 趋势线与某条成交量衰竭线之间的距离越大,说明该方向的成交量越高。 趋势
SURMAchannelPRO
Roman Surmanidze
SURMAchannelPRO 是一款高级多用途指标,可生成动态价格通道和清晰的趋势跟踪信号。它以平滑的赫尔移动平均线(HMA)为核心,围绕其构建多条通道线(内轨、中间轨、外轨),这些线充当动态支撑和阻力。该指标在通道突破/重新入场时提供直观的买入/卖出箭头信号,并根据用户定义的通道宽度百分比自动绘制水平止盈(TP)和止损(SL)线。其关键特点是集成的统计面板,可跟踪设定历史周期内所有过去信号的表现(总数、T/P、S/L、利润、亏损)。它还包含一个实时显示下一根K线倒计时的计时器。 主要特点: 动态多线通道:   生成主要上下轨以及基于斐波那契的中间轨线,用于精确分析市场结构。 自动信号与回测:   根据价格与通道的交互绘制买入(绿色)和卖出(粉色)箭头。完整记录所有历史信号的表现。 自动止盈止损投影:   为每个交易信号绘制水平止盈和止损线,距离根据当前通道宽度的百分比计算。 表现统计面板:   直接在图表上显示所有过去信号的详细摘要(总数、T/P命中、S/L命中、以点数为单位的利润/亏损)。 完全可定制:   可调整通道周期、各时间框架下的宽度、线型、颜色和信号逻辑参数。 集成计时
Aurex Fibo Scalper
Cristofher Robles
Aurex Fibo Scalper is a premium precious metal (Gold, Silver) and forex scalping system. By focusing on the Golden Ratio of Fibonacci projections and incorporating specialized trend filter channels, it identifies strategic daily turning points. Key Features: Golden Ratio Projections: Levels calculated using precise Fibonacci coefficients. Metal Optimization: Tuned for volatile assets like XAUUSD (Gold) and XAGUSD (Silver). Synergy Crossover: Double MA filter to block counter-trend signals. Tradi
Chronos Auto-Adaptive Matrix - Pure Mathematical Precision Tired of fake "AI", "Deep Learning", and "ChatGPT" buzzwords? So are we. Welcome to Chronos Auto-Adaptive Matrix — an honest, transparent, and mathematically rigorous trading system.  === GOD-TIER PRESETS === [SETUP 1] SCALPING MATRIX (Best Overall / Default) Maximum trade frequency and highest profit yield. Very active breakout hunting. - **Breakout Period:** 12 - **Risk per Trade:** 2.0% - **SL / TP Multiplier:** 1.0 ATR / 1.5 ATR
Rocket Trend
Andriy Sydoruk
The Rocket Trend indicator is trending. The indicator draws two-color points connected by lines along the chart. This is a trend indicator, it is an algorithmic indicator. It is easy to work and understand when a blue circle appears, you need to buy, when a red one appears, sell. The indicator is used for scalping and pipsing, and has proven itself well. Rocket Trend is available for analyzing the direction of the trend for a specific period of time. Ideal for novice traders learning the laws o
UZFX-Alpha Strike Signals v2.0是一款专业级市场分析工具,旨在精准清晰地识别高概率交易机会。该先进指标融合了精密的价格行为识别与动态风险管理可视化功能,直接在图表上呈现清晰的买入与卖出信号。 注意:结合使用 { LTL 164343 } 指标,可提高获胜信号的准确率。 利用 LTL 信号判断趋势,并以 Alpha 信号作为入场信号。 这种方法将最大限度地提高您的胜率,并有助于避免误判信号。 工作原理 该指标通过识别特定K线形态来分析市场结构,这些形态预示着潜在趋势反转或延续。当这些形态符合专有算法条件时,指标将生成清晰视觉信号: • 买入信号(蓝色箭头)出现在市场底部,表明看涨动能显现 • 卖出信号(红色箭头)出现在市场顶部,确认看跌压力形成 交易者核心优势 1. 清晰可执行的信号 无需解读猜测——信号位置直接在图表上显示箭头 色彩编码信号(买入蓝标/卖出红标)实现即时识别 可配置信号灵敏度以匹配您的交易风格 2. 完整交易管理可视化 信号出现时,指标自动绘制: 入场点位——最佳建仓价格 止损位——基于近期价格走势的保护性位 多级止盈位(1
Seasonal Pattern Trader
Dominik Patrick Doser
Disclaimer : Keep in mind that seasonal patterns are not always reliable. Therefore, thoughtful risk management is crucial to minimize losses.  Seasonal patterns in the financial world are like a well-guarded secret that successful investors use to their advantage. These patterns are recurring price movements that occur during specific periods or around special events. Additionally, there are also intraday patterns that repeat. For example, Uncle Ted from Forex Family suggests examining previou
Insight Investor: Advanced Multi-Currency Forex Trading Bot Introduction In the fast-paced world of Forex trading, having the right tools can significantly enhance your trading experience. Insight Investor is an advanced multi-currency trading bot designed to automate and optimize your trading operations. This expert advisor employs modern algorithms to analyze market conditions and execute trades, aiming to deliver consistent results while maintaining controlled risk levels. Key Features of Ins
Volume flow Profile
Israr Hussain Shah
大师版是一款专业级的分析工具,旨在通过成交量和资金流向的视角来可视化市场结构。与标准的成交量指标不同,该工具直接在图表上显示每日成交量分布,让您准确看到价格发现发生的位置以及“聪明钱”的定位。 此大师版专为清晰度和速度而设计,具有独特的自动主题同步系统,加载后即刻美化您的图表布局。 主要特点: 真实资金流向计算: 超越标准的跳动量。启用“Use Money Flow”时,成交量按价格加权,揭示了特定价格水平的实际资金投入。 价值区域 (VA) 可视化: 自动计算价值区域(默认为成交量的70%)。 VA填充: 为价值区域背景着色,以便即时识别控制区域。 关键水平: 清晰标记控制点 (POC)、价值区域高点 (VAH) 和价值区域低点 (VAL)。 专业标记系统: 扫描概况结构以识别关键交易区域: HVN (高成交量节点): 接受和盘整区域(支撑/阻力)。 LVN (低成交量节点): 拒绝区域或“快速通过”区域。 所有标记均向右绘制延长线,便于监控。 Delta 背离(左侧直方图): 左侧直方图可视化每个级别的买卖压力对比。这有助于识别隐藏的背离——即价格可能上涨,但卖家在这些水平上激进打
Sonic R Pro Enhanced
Huu Thuong Nguyen
Sonic R Pro Enhanced EA - 2025 版本 $249 仅限前5名购买者! 实时信号 查看 Sonic R Pro Enhanced 的实时表现: 交易策略 Sonic R Pro Enhanced 是经典 Sonic R 策略的升级版,通过 Dragon Band(EMA 34 和 EMA 89)进行自动化交易,并结合先进算法以提高盈利能力。 时间周期:M15, M30 支持货币对:XAUUSD, BTCUSD, AUDJPY, USDJPY 交易风格:回调交易 & 反趋势交易 最低资金要求:500 USD 杠杆比例:1:200 起 用户指南 设置:只需配置一个参数 - RiskAmount 如果 RiskAmount < 0:按账户余额的百分比计算风险 如果 RiskAmount > 0:每笔交易的固定风险金额 (USD) 示例: RiskAmount = -1 : 风险为账户余额的 1% RiskAmount = -2.5 : 风险为账户余额的 2.5% RiskAmount = 50 : 每笔交易固定风险 50 USD RiskAmou
该产品的买家也购买
ARIPoint
Temirlan Kdyrkhan
1 (1)
ARIPoint is a powerful trading companion designed to generate high-probability entry signals with dynamic TP/SL/DP levels based on volatility. Built-in performance tracking shows win/loss stats, PP1/PP2 hits, and success rates all updated live. Key Features: Buy/Sell signals with adaptive volatility bands Real-time TP/SL/DP levels based on ATR Built-in MA Filter with optional ATR/StdDev volatility Performance stats panel (Success, Profit/Loss, PP1/PP2) Alerts via popup, sound, push, or email Cu
PrimeScalping
Temirlan Kdyrkhan
PrimeScalping is a powerful trading companion designed to generate high-probability entry signals with dynamic TP/SL/DP levels based on volatility. Built-in performance tracking shows win/loss stats, PP1/PP2 hits, and success rates — all updated live. Key Features: Buy/Sell signals with adaptive volatility bands Real-time TP/SL/DP levels based on ATR Built-in MA Filter with optional ATR/StdDev volatility Performance stats panel (Success, Profit/Loss, PP1/PP2) Alerts via popup, sound, push, or e
SmartScalping
Temirlan Kdyrkhan
SmartScalping is a powerful trading companion designed to generate high-probability entry signals with dynamic TP/SL/DP levels based on volatility. Built-in performance tracking shows win/loss stats, PP1/PP2 hits, and success rates — all updated live. Key Features: Buy/Sell signals with adaptive volatility bands Real-time TP/SL/DP levels based on ATR Built-in MA Filter with optional ATR/StdDev volatility Performance stats panel (Success, Profit/Loss, PP1/PP2) Alerts via popup, sound, push, or e
ScalpPoint
Temirlan Kdyrkhan
ScalpPoint is a powerful trading companion designed to generate high-probability entry signals with dynamic TP/SL/DP levels based on volatility. Built-in performance tracking shows win/loss stats, PP1/PP2 hits, and success rates — all updated live. Key Features: Buy/Sell signals with adaptive volatility bands Real-time TP/SL/DP levels based on ATR Built-in MA Filter with optional ATR/StdDev volatility Performance stats panel (Success, Profit/Loss, PP1/PP2) Alerts via popup, sound, push, or emai
TrendProMaster
Temirlan Kdyrkhan
MasterTrend Indicator for MT5 A powerful trend-following and signal-evaluation tool MasterTrend   is a custom MT5 indicator that combines Moving Averages and ATR-based risk/reward logic to generate clear buy/sell signals. It visualizes dynamic SL/TP levels, evaluates past trade outcomes, and displays win/loss statistics in a clean on-chart panel. Key features include: Buy/Sell signals based on MA crossovers ATR-based SL/TP1/TP2/TP3 levels with visual lines and labels Signal outcome tracking wit
MasterTrend
Temirlan Kdyrkhan
MasterTrend Indicator for MT5 A powerful trend-following and signal-evaluation tool MasterTrend   is a custom MT5 indicator that combines Moving Averages and ATR-based risk/reward logic to generate clear buy/sell signals. It visualizes dynamic SL/TP levels, evaluates past trade outcomes, and displays win/loss statistics in a clean on-chart panel. Key features include: Buy/Sell signals based on MA crossovers ATR-based SL/TP1/TP2/TP3 levels with visual lines and labels Signal outcome tracking wit
ARICoins
Temirlan Kdyrkhan
ARICoin is a powerful trading companion designed to generate high-probability entry signals with dynamic TP/SL/DP levels based on volatility. Built-in performance tracking shows win/loss stats, PP1/PP2 hits, and success rates all updated live. Key Features: Buy/Sell signals with adaptive volatility bands Real-time TP/SL/DP levels based on ATR Built-in MA Filter with optional ATR/StdDev volatility Performance stats panel (Success, Profit/Loss, PP1/PP2) Alerts via popup, sound, push, or email Cust
Euro Escalper
Cristofher Robles
Euro Escalper— Zhuan Ye Ji Gou Ji Tou Pi Zhi Biao Euro Escalper shi yi kuan gao xing neng jiao yi zhi biao, zhuan wei xu yao ji gou ji jing zhun ru chang de jiao yi zhe she ji. Shi yong yu he cheng zhi shu (Deriv), wai hui ji MetaTrader 5 shang de ren he zi chan. Jie he le ji yu Fibonacci de liu dong xing qu yu, nei zhi SuperTrend yin qing he shi shi zhuan ye kong zhi mian ban. Zhu Yao You Shi Wu Chong Hui: Xin hao jian tou jin zai K xian shou pan shi chu xian, yong yuan bu hui yi dong huo xiao
Классификатор силы тренда. Показания на истории не меняет. Изменяется классификация только незакрытого бара. По идее подобен полной системе ASCTrend, сигнальный модуль которой, точнее его аппроксимация в несколько "урезанном" виде, есть в свободном доступе, а также в терминале как сигнальный индикатор SilverTrend . Точной копией системы ASCTrend не является. Работает на всех инструментах и всех временных диапазонах. Индикатор использует несколько некоррелируемых между собой алгоритмов для класси
FFx Universal Strength Meter PRO is more than a basic strength meter. Instead of limiting the calculation to price, it can be based on any of the 19 integrated strength modes + 9 timeframes. With the FFx USM, you are able to define any period for any combination of timeframes. For example, you can set the dashboard for the last 10 candles for M15-H1-H4… Full flexibility! Very easy to interpret... It gives a great idea about which currency is weak and which is strong, so you can find the best pai
The FFx Universal MTF alerter shows on a single chart all the timeframes (M1 to Monthly) with their own status for the chosen indicator. 9 indicators mode (MACD-RSI-Stochastic-MA-ADX-Ichimoku-Candles-CCI-PSAR). Each can be applied multiple times on the same chart with different settings. Very easy to interpret. Confirm your BUY entries when most of the timeframes are showing green color. And confirm your SELL entries when most of the timeframes are showing red color. 2 Alert Options : input to s
FFx Watcher Pro MT5
Eric Venturi-Bloxs
The FFx Watcher PRO is a dashboard displaying on a single chart the current direction of up to 15 standard indicators and up to 21 timeframes. It has 2 different modes: Watcher mode: Multi Indicators User is able to select up to 15 indicators to be displayed User is able to select up to 21 timeframes to be displayed Watcher mode: Multi Pairs User is able to select any number of pairs/symbols User is able to select up to 21 timeframes to be displayed This mode uses one of the standard indicators
FFx Patterns Alerter gives trade suggestions with Entry, Target 1, Target 2 and StopLoss .... for any of the selected patterns (PinBar, Engulfing, InsideBar, OutsideBar) Below are the different options available: Multiple instances can be applied on the same chart to monitor different patterns Entry suggestion - pips to be added over the break for the entry 3 different options to calculate the SL - by pips, by ATR multiplier or at the pattern High/Low 3 different options to calculate the 2 TPs -
FFx Basket Scanner MT5
Eric Venturi-Bloxs
MetaTrader 4 version available here : https://www.mql5.com/en/market/product/24881 FFx Basket Scanner is a global tool scanning all pairs and all timeframes over up to five indicators among the 16 available. You will clearly see which currencies to avoid trading and which ones to focus on. Once a currency goes into an extreme zone (e.g. 20/80%), you can trade the whole basket with great confidence. Another way to use it is to look at two currencies (weak vs strong) to find the best single pairs
MetaTrader 4 version available here: https://www.mql5.com/en/market/product/25793 FFx Pivot SR Suite PRO is a complete suite for support and resistance levels. Support and Resistance are the most used levels in all kinds of trading. Can be used to find reversal trend, to set targets and stop, etc. The indicator is fully flexible directly from the chart 4 periods to choose for the calculation: 4Hours, Daily, Weekly and Monthly 4 formulas to choose for the calculation: Classic, Camarilla, Fibonac
Recommended TimeFrame >= H1. 100% Non Repainted at any moment.  Use it carefully, only with Trend Direction. Trading Usage: 2 Variants: as Range System or as BreakOut System (Both Only With Trend Direction)::: (Always use StopLoss for minimise Risk); [1] as Range System: (Recommended) in UP TREND:  - BUY in Blue Line , then if price goes down by 50 points (on H1) open Second BUY.   Close in any Profit you wish: TrailingStop(45 points) or Close when Price touches upper Gold Line. in DOWN TREND
BC Scalper Aroow
Tete Adate Adjete
This indicator is based on the crossing of two Moving Average with the RSI It is intended for scalpers Specially designed for Boom and Crash syhtetic indices from Binary.com/Deriv.com It is easy to use and intuitive. We recommend its use on M1 and is equipped with three types of notification Email alert Sound notification Push notification these parameters can be activated and deactivated.
Magicx
Hasan Abdulhussein
The indicator places a buy or sell signal when the conditions of the strategy it was designed with are met. The strategy is guaranteed, strong, and has been tested for 9 years. The indicator is for binary options and can be converted into a bot by linking it to MT2Trading, where it sends the signal to this platform. This platform automatically opens a trade on the trading platform you are using, whether it is Pocket Option, IQ Option, or any other binary options platforms. The entry is on the n
CBT Quantum Maverick
Arpit Sharma
1 (1)
CBT Quantum Maverick 高效的二元期权交易系统 CBT Quantum Maverick 是一款精心设计的高性能二元期权交易系统,专为追求精准、简单和纪律的交易者打造。无需自定义,该系统经过优化,可直接使用并产生高效结果。只需遵循信号操作,稍加练习即可掌握。 主要特点: 信号精准度: 基于当前K线生成下根K线交易信号,无频繁重绘。 市场多样性: 专为二元期权交易设计,兼容多种经纪商和资产类别,适应不同交易偏好。 兼容性: Deriv Synthetic Charts :适用于任何时间框架。 OTC Charts :来自如 Quotex、PocketOption、Binomo、Stockity、IQOption、Exnova、OlympTrade、Deriv、Binolla 和 Homebroker 的经纪商,可导入 MT5(一周内提供免费导入支持,之后需支付服务费用)。 外汇、加密货币和商品市场 :扩展资产利用。 高收益二元资产 :建议使用90%以上的高回报率资产。 额外优势: 全面的交易计划: 提供系统化和纪律性交易的分步支持计划。 高效时间利用: 每天仅需一
ITF Trend Filter
Mayowa Daniel Sonaike
This strategy focuses on identifying and following clear market trends by filtering out noise and short-term fluctuations. Using advanced algorithms, it highlights significant upward and downward movements, enabling traders to make data-driven decisions. The indicator is designed for simplicity and precision, ideal for traders who prefer a systematic approach to trend trading. Whether you're a beginner or an experienced trader, this tool helps you stay aligned with the dominant market direction
Paradigm Shift
Oliver John Vella
PRICE WILL BE INCREASED TO £4999 SOON! 5 or 15 MINUTE CHART ONLY: A state-of-the-art trading indicator, designed with advanced analytical and mathematical programming, delivers top-tier buy and sell signals. Simply enter a small buy position when a green arrow appears and a small sell position when a red arrow is shown. While signals from this indicator are infrequent, they boast exceptional accuracy when generated. Please apply your own stop-loss and take-profit levels as needed.
In sadiq100
Xssadq Alseydy
مؤشر Smart Trend Candles هو أداة فعّالة في منصة MetaTrader 4، تجمع بين عناصر تحليل فني متعددة لتحديد اتجاهات السوق وقياس قوة المشترين والبائعين. يوفر هذا المؤشر متعدد الاستخدامات إشارات مرئية واضحة تُحسّن قرارات التداول الخاصة بك. الميزات الرئيسية 1. تحديد الاتجاه يستخدم شموع Heikin-Ashi المعدلة (اختياري) لتصفية ضوضاء السوق يتضمن متوسطًا متحركًا (فترة قابلة للتكوين) لتأكيد الاتجاه تنفيذ مؤشر القوة النسبية لقياس الزخم 2. قياس القوة تشير الشموع المرمزة بالألوان إلى شدة ضغط الشراء/البيع تحليل الحج
Trend Frequency Market MT5 Carry out analysis and backtest even before opening your orders, check the strategy's Winrate and stay in favor of the Trend and the strength of the movement. The TFM indicator is specialized in providing you with the strength points of the movement, painting the candles GREEN or RED to report price aggression from the Players who are acting at the exact moment. Taking advantage of this detection, the indicator plots Arrow and Entry, Stop Loss and Take Profit levels
Knight Rider FX
Oliver John Vella
PRICE WILL BE INCREASED TO £4999 SOON! Knight Rider FX is a precision-engineered trading indicator that delivers highly accurate, non-repainting signals without flooding your chart. It filters out noise and selectively highlights only the highest probability trade setups. On higher timeframes, it anticipates major market reversals, while on intraday charts it pinpoints mini reversals with tactical clarity. By focusing on quality over quantity, Knight Rider FX equips traders with disciplined ent
AriX
Temirlan Kdyrkhan
1 (4)
AriX Indicator for MT5 A powerful trend-following and signal-evaluation tool AriX is a custom MT5 indicator that combines Moving Averages and ATR-based risk/reward logic to generate clear buy/sell signals. It visualizes dynamic SL/TP levels, evaluates past trade outcomes, and displays win/loss statistics in a clean on-chart panel. Key features include: Buy/Sell signals based on MA crossovers ATR-based SL/TP1/TP2/TP3 levels with visual lines and labels Signal outcome tracking with real-time stat
VI Comparison
Ivan Andrescov
Screens realtime-  https://t.me/ +rEuJQo8zHLllMzgy Signals.Metals.etc This tool is designed to detect anomalies in market trading activity. It analyzes price movements and volumes to identify moments of unusually strong buying or selling pressure. Such periods are often followed by a cooling phase or consolidation, providing traders with valuable reference points for decision-making.  The indicator requires no complex setup and is suitable for both experienced traders and beginners. Screensho
VI Calculator
Ivan Andrescov
Screens realtime-  https://t.me/ +rEuJQo8zHLllMzgy in Signals.Metals.etc VI Calculator  is a professional MetaTrader 5 indicator that analyzing volume at the moment. This synergy allows traders to evaluate both the strength of market movements and overbought/oversold conditions at the same time. The indicator automatically processes market data and provides clear trading signals directly on the chart in the form of arrows and text recommendations. It is ideal for identifying entry and exit p
TrendFlow Tracker
David Macharia Kamau
TrendCatcherBot: Find Your Edge in the Market Don't guess the trend—catch it. The TrendCatcherBot is an Expert Advisor designed for MetaTrader 5 that simplifies your trading strategy. By leveraging the power of moving average crossovers, this bot provides clear, visual signals directly on your chart, so you always know when to act. Watch for the unmistakable green, red, and black dots in the corner of your screen to instantly see if the market is signaling a buy, sell, or hold. It's the perfect
AlphaSeekingBull5
Thendo Evans Sithagu
Introducing the Ultimate Trend-Following Indicator: Precision Signals at Your Fingertips In a market saturated with "black-box" systems and cluttered, confusing charts, clarity is the ultimate advantage. Alpha Seeking Bull strips away the noise, distilling complex market analysis into a single, high-fidelity visual cue. Whether you are a seasoned day trader or just starting your journey, this indicator is engineered to provide the confidence you need to execute trades with surgical precision. Th
Dubai Sniper Ultra V6
Mohammed Khalid M Almatrudi
WELCOME TO THE ULTIMATE TRADING REVOLUTION!   Are you tired of lagging indicators, fakeouts, and leaving massive profits on the table? It’s time to stop guessing and start sniping! Introducing Dubai Sniper Ultra Strategy, the most powerful, highly-optimized trend-following and reversal indicator meticulously engineered for MetaTrader 5. This isn't just another indicator—this is your ultimate weapon to dominate the markets, especially built to crush indices like SPX500, Gold, and Major Forex pair
作者的更多信息
KAMA Confluence Engine 顺势交易——在趋势反转的那一刻立即知道你的入场、止损和目标位。 KAMA Confluence Engine 是一款基于考夫曼自适应移动平均线(KAMA)的全能趋势指标,并结合了成交量加权、多周期共振确认以及自动交易水平。它会根据市场环境自动调整:在趋势行情中快速敏捷,在震荡行情中平稳过滤噪音——让你始终站在正确的一侧。 它的独特之处 成交量加权自适应引擎 ——当真实的成交量进入市场时,KAMA 线会加速;当成交量减弱时,它会放缓,让你留在强势行情中,避开假突破。 醒目的霓虹趋势带 ——亮丽、流畅的线条,底部带有深色阴影。绿色 = 上升趋势,红色 = 下降趋势,灰色 = 横盘/无交易。趋势一眼即可识别,即使远距离也清晰可见。 趋势颜色蜡烛图 ——蜡烛本身会根据趋势着色,让整个图表呈现统一的趋势故事。 自动 Entry / SL / TP 水平(新功能) 当新趋势出现时,指标会自动在图表上绘制可直接使用的交易水平: 入场线位于信号价格 止损由 ATR 计算(根据品种波动性自动调整) TP1 / TP2 / TP3 按你设定的风险回报比(默认
Transaction Speed MT5
Ivan Stefanov
5 (4)
当然,以下是翻译成中文(简体)的版本: 该指标标出市场中显现出 交易兴趣 的区域,并随后显示 订单积累区域 。它的工作方式类似于大规模的订单簿。 这是为 大资金 打造的指标,性能卓越。市场中有任何兴趣,你都能通过它清晰看到。 (这是一个 完全重写的自动化版本 —— 不再需要手动分析。) 交易速度 是一个全新的概念指标,它显示了市场上大订单 何时 、 何地 聚集,并揭示了其背后的意义。它可以在 非常早期 就检测到趋势的变化。 在外汇市场,所谓的“交易量”实际上是误导性的,因为那指的是价格在单位时间内的变化,因此真正的名称应是“交易速度”。 一切都取决于我们如何思考、如何行动、如何分析。 改变分析范式至关重要。 该指标完全重构了外汇市场上“交易量”的概念,用逻辑方式重新定义并应用,从而成为一个 独特而精准的工具 。 使用方法: 默认情况下,指标处于 自动模式 ,可独立用于任何时间周期。如果你希望切换到手动模式,只需点击 Auto / Manual Mode 按钮即可。 在 手动模式 下,所有计算从 2025年1月1日 开始。你可以根据需要更改该日期,以查看不同的分析结果。 最优数据周期
Imbalance Pro
Ivan Stefanov
5 (4)
该指标测量所选时段内牛市和熊市之间的不平衡,并在两点之间显示一条直线。 如果牛市的成交量大于熊市,则该线变为绿色。 如果熊市成交量更大,则为红色。 直线还显示成交量的百分比差异。 该指标在单独的窗口中显示相同的数据。您还可以看到分割后的成交量。 该指标有两种模式。 为此,左上方有一个按钮、  - 如果不按下,它将测量市场任意点与当前价格之间的不平衡。 - 如果按下按钮,则可以测量市场任意两点之间的平衡。 该指标测量所选时段内牛市和熊市之间的不平衡,并在两点之间显示一条直线。 如果牛市的成交量大于熊市,则该线变为绿色。 如果熊市成交量更大,则为红色。 直线还显示成交量的百分比差异。 该指标在单独的窗口中显示相同的数据。您还可以看到分割后的成交量。 该指标有两种模式。 为此,左上方有一个按钮、  - 如果不按下,它将测量市场任意点与当前价格之间的不平衡。 - 如果按下按钮,则可以测量市场任意两点之间的平衡。
MACD divergency
Ivan Stefanov
4.63 (8)
该指标准确地识别出价格走势与MACD柱状图之间的牛市和熊市背离,使用的指数移动平均线(EMA)周期为5(快速),34(慢速),信号线周期为5。该指标突出显示了动能减弱的点,提示可能的趋势反转。 正确识别背离的规则: 当价格形成更低的低点,而MACD柱状图同时在零线之上形成更高的低点时,牛市背离有效。 当价格形成更高的高点,而MACD柱状图同时在零线以下形成更低的高点时,熊市背离有效。 如果柱状图的极值和价格的极值没有位于零线的同一侧,则背离信号无效,因为这可能导致假信号。 这种方法代表了应用MACD背离分析最准确和可靠的方法。 指标特点: 清晰地标记已确认的牛市和熊市背离。 严格遵守MACD背离验证规则,提高可靠性。 其他信息:该指标作为MetaTrader 5的EX5编译文件提供。它不需要外部库或DLL文件。建议交易者将此工具与整体交易策略一起使用。在进行真实交易前,请务必在模拟账户中充分测试。该指标不保证盈利,仅作为帮助识别真实MACD背离的分析工具。
FREE
Meravith MT5
Ivan Stefanov
5 (3)
做市商工具。 Meravith 将: 分析所有时间周期并显示当前正在运行的趋势。 标注流动性区域(成交量均衡区),即多头与空头成交量相等的位置。 在您的图表上直接显示来自不同时间周期的所有流动性水平。 生成并展示基于文本的市场分析供您参考。 根据当前趋势计算目标位、支撑位和止损位。 计算交易的风险回报比。 根据您的账户余额计算仓位大小,并估算潜在利润。 在市场出现重大变化时,Meravith 还会发出警告。 指标的主要线条: 多头/空头成交量衰竭线 —— 作为目标位使用。 趋势线 —— 指示市场趋势方向。根据市场是多头还是空头而改变颜色,并作为趋势支撑。其颜色主要反映市场情绪。 成交量均衡线(Eq)—— Eq(Volume Equilibrium)是系统的核心。它表示买卖双方成交量的平衡点,即市场流动性所在位置。向上突破 Eq 表示多头倾向,向下突破 Eq 表示空头倾向。突破后,应等待回调——当价格回到相反趋势的偏离线或衰竭线附近时。 使用方法:只需将其添加到图表中。 Meravith 可以分析一切——趋势和回调。 趋势线与某条成交量衰竭线之间的距离越大,说明该方向的成交量越高。 趋势
KAMA Confluence Engine 顺势交易——在趋势反转的那一刻立即知道你的入场、止损和目标位。 KAMA Confluence Engine 是一款基于考夫曼自适应移动平均线(KAMA)的全能趋势指标,并结合了成交量加权、多周期共振确认以及自动交易水平。它会根据市场环境自动调整:在趋势行情中快速敏捷,在震荡行情中平稳过滤噪音——让你始终站在正确的一侧。 它的独特之处 成交量加权自适应引擎 ——当真实的成交量进入市场时,KAMA 线会加速;当成交量减弱时,它会放缓,让你留在强势行情中,避开假突破。 醒目的霓虹趋势带 ——亮丽、流畅的线条,底部带有深色阴影。绿色 = 上升趋势,红色 = 下降趋势,灰色 = 横盘/无交易。趋势一眼即可识别,即使远距离也清晰可见。 趋势颜色蜡烛图 ——蜡烛本身会根据趋势着色,让整个图表呈现统一的趋势故事。 自动 Entry / SL / TP 水平(新功能) 当新趋势出现时,指标会自动在图表上绘制可直接使用的交易水平: 入场线位于信号价格 止损由 ATR 计算(根据品种波动性自动调整) TP1 / TP2 / TP3 按你设定的风险回报比(默认
FREE
RSI Divergence Pulse 是一个全面的 RSI 指标,结合了背离检测、多时间框架分析和可视化工具于一身,轻量级应用。它自动识别常规和隐藏背离,显示实时多时间框架 RSI 面板,填充 OB/OS 区域以便视觉识别,在价格图表和 RSI 子窗口上绘制背离线,放置买卖箭头,并提供实时警报。 Features Color-Coded RSI Line RSI 线根据当前区域改变颜色。蓝色表示中性区域(30 到 70 之间)。绿色标记超买区域(高于 70)。红色标记超卖区域(低于 30)。 RSI Signal Line RSI 的 SMA(默认周期 9)作为信号线。RSI 和信号线的交叉提供额外的时机信息。差值(Diff)显示在仪表板中。 Automatic Divergence Detection 基于分形的枢轴算法扫描最多 500 根 K 线,检测两种类型的背离。常规(实际)背离识别经典反转信号,即价格创出新极值而 RSI 不认可。隐藏背离识别趋势延续信号,在回调期间。 Dual Divergence Lines 实线代表常规背离,虚线代表隐藏背离。线条同时绘制在价格图表
Enigmera
Ivan Stefanov
5 (9)
ENIGMERA: 市场的核心 重要提示:MQL5.com 演示版本在策略测试器中运行,可能无法完全反映 Enigmera 的功能。请查看描述、截图和视频了解详细信息。如有任何问题,请随时联系我! 该指标的代码已完全重写。版本 3.0 增加了新功能并修复了自指标发布以来积累的错误。 简介 这个指标和交易系统是金融市场的一种独特方法。ENIGMERA 使用分形周期来精确计算支撑和阻力水平。它展示了真实的积累阶段,并提供了方向和目标。无论是在趋势中还是在修正中,这个系统都能工作。 它是如何工作的 指标的大部分功能通过图表左侧的按钮控制,使得能够快速响应不同的市场情况。 按钮 ON/OFF – 显示或隐藏整个指标。 Channel – 激活支撑通道,显示可接受的偏差范围。 Dev1 (第一偏差) – 指示价格在支撑偏差内的波动,信号表示市场正在整合或积累力量。 Dev2 (第二偏差) – 显示价格在偏差之间的波动,表示趋势形成和方向。 Dev3 (第三偏差) – 表示趋势的显著加速和高波动性。 45deg (45度) – 显示市场的节奏和相对于 45 度线的运动稳定性。 Tgt1/2
该指标准确地识别出价格走势与MACD柱状图之间的牛市和熊市背离,使用的指数移动平均线(EMA)周期为5(快速),34(慢速),信号线周期为5。该指标突出显示了动能减弱的点,提示可能的趋势反转。 正确识别背离的规则: 当价格形成更低的低点,而MACD柱状图同时在零线之上形成更高的低点时,牛市背离有效。 当价格形成更高的高点,而MACD柱状图同时在零线以下形成更低的高点时,熊市背离有效。 如果柱状图的极值和价格的极值没有位于零线的同一侧,则背离信号无效,因为这可能导致假信号。 这种方法代表了应用MACD背离分析最准确和可靠的方法。 指标特点: 清晰地标记已确认的牛市和熊市背离。 严格遵守MACD背离验证规则,提高可靠性。 其他信息:该指标作为MetaTrader 5的EX5编译文件提供。它不需要外部库或DLL文件。建议交易者将此工具与整体交易策略一起使用。在进行真实交易前,请务必在模拟账户中充分测试。该指标不保证盈利,仅作为帮助识别真实MACD背离的分析工具。
FREE
Times MT5
Ivan Stefanov
TIMES 为你的分析加入时间维度。它是交易“三位一体”的第三个组成部分:Meravith 显示公平价格,TransactionSpeed 显示公平成交量,而 TIMES 显示交易活动在时间上的集中位置——揭示动能是在累积还是在减弱。 它绘制的内容:区域(矩形) 为了避免图表被线条弄得杂乱,TIMES 将分析浓缩为直接绘制在价格图上的彩色矩形。每个矩形标记由指标内部时间结构生成的重要价值区域——一个活动聚集的价格带,也是市场可能产生反应的地方。 颜色含义: 绿色 / 青绿色矩形 → 多头区域(动能在此累积——作为支撑 / 延续区域)。 红色 / 深红色矩形 → 空头区域(动能在此减弱——作为阻力 / 延续区域)。 区域的行为方式: 确认突破后的颜色翻转——如果价格完全穿过区域的一侧边界并收盘,矩形会切换颜色以反映新的市场状态(被向上突破的空头区域会变成多头区域,反之亦然)。这是一个实时信号,表示市场控制权已发生变化。 自动清理——当价格干净地穿过区域的两侧并收盘后,该区域不再具有意义,矩形会自动删除,使图表保持整洁。 区域来源选择——Rectangle source line 输入允
Two Snakes
Ivan Stefanov
5 (1)
Levelss
Ivan Stefanov
5 (1)
LEVELSS 指标显示 - 每日看涨和看跌区域。每天从 00:00 至 23:59 都可以看到。 - 周线看涨和看跌区域。每周从周一 0:00 至周五 23:59。 - 从特定时间框架特别计算的通道,显示在所有其他时间框架上。默认情况下,这是 4 小时时间框架,您可以将其更改为您希望交易的任何其他时间框架。它是不间断计算的。 屏幕左上方显示区域和通道是看涨、看跌还是中性。当三个区域都看涨时,当前蜡烛上会出现一个绿点。当三个区域都看跌时,则出现粉红色。 该指标没有任何限制。 LEVELSS 指标显示 - 每日看涨和看跌区域。每天从 00:00 至 23:59 都可以看到。 - 周线看涨和看跌区域。每周从周一 0:00 至周五 23:59。 - 从特定时间框架特别计算的通道,显示在所有其他时间框架上。默认情况下,这是 4 小时时间框架,您可以将其更改为您希望交易的任何其他时间框架。它是不间断计算的。 屏幕左上方显示区域和通道是看涨、看跌还是中性。当三个区域都看涨时,当前蜡烛上会出现一个绿点。当三个区域都看跌时,则出现粉红色。 该指标没有任何限制。
GANN Master
Ivan Stefanov
5 (1)
基于甘氏久经考验的方法,甘氏的精确目标呈现在您面前。该工具旨在使交易更加顺畅和直观。通过向上拖动白线或向下拖动绿线,您将立即明白为什么甘氏的技术在交易世界中仍然具有影响力。 甘氏策略围绕着高度准确地预测市场走势,而该工具将这种力量带到了您的指尖。无论您是经验丰富的交易员还是新手,操作这些线条将为您提供深入的见解,了解为什么他的方法经得起时间的考验。 基于甘氏久经考验的方法,甘氏的精确目标呈现在您面前。该工具旨在使交易更加顺畅和直观。通过向上拖动白线或向下拖动绿线,您将立即明白为什么甘氏的技术在交易世界中仍然具有影响力。 甘氏策略围绕着高度准确地预测市场走势,而该工具将这种力量带到了您的指尖。无论您是经验丰富的交易员还是新手,操作这些线条将为您提供深入的见解,了解为什么他的方法经得起时间的考验。
Sense
Ivan Stefanov
5 (2)
SENSE 是一个自动系统,它将选定的 GANN 方法与分形计算相结合。系统会告诉我们在哪里开仓,在哪里平仓。无需再将时间浪费在复杂的计算上 - SENSE 会为您完成一切。只需安装指标即可。 基本原则: 当价格高于白线时,市场看涨 在白线上方买入,在白线下方止损 绿线为上涨目标 当价格低于白线时,市场看跌。 在白线下方卖出,在白线上方止损 红线为下行目标 双绿线或红线表示较强的区域。 为什么是 SENSE? 获利目标: SENSE 自动设置获利目标,帮助您最大限度地提高交易成功率。 自动适应: 该指标可自动重新计算任何时间框架,提供准确可靠的信号,无需手动调整。 非常适合剥头皮交易。 查看演示版! SENSE 是一个自动系统,它将选定的 GANN 方法与分形计算相结合。系统会告诉我们在哪里开仓,在哪里平仓。无需再将时间浪费在复杂的计算上 - SENSE 会为您完成一切。只需安装指标即可。 基本原则: 当价格高于白线时,市场看涨 在白线上方买入,在白线下方止损 绿线为上涨目标 当价格低于白线时,市场看跌。 在白线下方卖出,在白线上方止损 红线为下行目标
Meravith
Ivan Stefanov
5 (3)
做市商工具。 Meravith 将: 分析所有时间周期并显示当前正在运行的趋势。 标注流动性区域(成交量均衡区),即多头与空头成交量相等的位置。 在您的图表上直接显示来自不同时间周期的所有流动性水平。 生成并展示基于文本的市场分析供您参考。 根据当前趋势计算目标位、支撑位和止损位。 计算交易的风险回报比。 根据您的账户余额计算仓位大小,并估算潜在利润。 在市场出现重大变化时,Meravith 还会发出警告。 指标的主要线条: 多头/空头成交量衰竭线 —— 作为目标位使用。 趋势线 —— 指示市场趋势方向。根据市场是多头还是空头而改变颜色,并作为趋势支撑。其颜色主要反映市场情绪。 成交量均衡线(Eq)—— Eq(Volume Equilibrium)是系统的核心。它表示买卖双方成交量的平衡点,即市场流动性所在位置。向上突破 Eq 表示多头倾向,向下突破 Eq 表示空头倾向。突破后,应等待回调——当价格回到相反趋势的偏离线或衰竭线附近时。 使用方法:只需将其添加到图表中。 Meravith 可以分析一切——趋势和回调。 趋势线与某条成交量衰竭线之间的距离越大,说明该方向的成交量越高。 趋
Stefanov
Ivan Stefanov
The indicator displays support and resistance zones defined logically using the MACD. The entire concept is explained in the video, with specific examples shown. The indicator works on any instruments and timeframes. It does not repaint. After placing it on the chart, please go through all the timeframes sequentially, from monthly to 1-minute, so that all lines load correctly. After that, you can start using it. The concept is unique and has not been seen in other systems or indicators.
Fifty Pro
Ivan Stefanov
5 (1)
FIFTY 指标现在提供自动化版本,无需手动绘制水平线。此版本可自动在图表上绘制每日、每周、每月和年度水平线,确保准确性并节省时间。此外,提供按钮以切换这些水平线的可见性,实现完全自定义。对于喜欢手动操作的用户,免费版本仍然可用且功能齐全,让交易者可以根据自己的需求选择手动或自动工具。 最符合逻辑的指标之一。 高度可靠。 FIFTY 指标现在提供自动化版本,无需手动绘制水平线。此版本可自动在图表上绘制每日、每周、每月和年度水平线,确保准确性并节省时间。此外,提供按钮以切换这些水平线的可见性,实现完全自定义。对于喜欢手动操作的用户,免费版本仍然可用且功能齐全,让交易者可以根据自己的需求选择手动或自动工具。 最符合逻辑的指标之一。 高度可靠。
Naturu MT4
Ivan Stefanov
“Naturu” 是一个使用大自然对称性作为算法的手动指标。 用简单策略和隐藏智慧,掌控市场! 加载指标后,您会看到两条线——上线(Top)和下线(Bottom)。 单击一次即可激活某条线。要移动,只需点击您想放置该线的那根K线。 您设定一个高点和一个低点,指标会自动计算: 洋红色区域,显示多空双方兴趣最接近之处,也就是最有可能成为支撑/阻力的区域。 灰色区域,标示下一层次的关注区。 青绿色线条,表示多方的目标价位。 金色线条,表示空方的目标价位。 手动指标赋予您完全的控制和灵活性,让您根据实时市场环境和个人直觉调整级别。它们迫使您更深入地亲自分析价格走势,帮助您真正理解支撑、阻力和形态是如何形成的。依靠人工判断,可以过滤掉自动系统常常误判的大量“噪音”,减少错误信号。而且,因您亲自设定每个级别,可在突发新闻或极端行情时立即调整,无需等候代码更新。 隐藏于简单游戏背后的神圣力量!
RSI Divergence Pulse — Smart Divergence Scanner with MTF Panel, Zone Fill, Alerts & Dashboard SHORT DESCRIPTION Professional RSI indicator with automatic Regular & Hidden divergence detection, color-coded RSI line, Multi-Timeframe panel, OB/OS zone fills, Buy/Sell arrows, signal labels, real-time dashboard, and multi-channel alerts. Works on any symbol and timeframe. FULL DESCRIPTION
TIMES 为你的分析加入时间维度。它是交易“三位一体”的第三个组成部分:Meravith 显示公平价格,TransactionSpeed 显示公平成交量,而 TIMES 显示交易活动在时间上的集中位置——揭示动能是在累积还是在减弱。 它绘制的内容:区域(矩形) 为了避免图表被线条弄得杂乱,TIMES 将分析浓缩为直接绘制在价格图上的彩色矩形。每个矩形标记由指标内部时间结构生成的重要价值区域——一个活动聚集的价格带,也是市场可能产生反应的地方。 颜色含义: 绿色 / 青绿色矩形 → 多头区域(动能在此累积——作为支撑 / 延续区域)。 红色 / 深红色矩形 → 空头区域(动能在此减弱——作为阻力 / 延续区域)。 区域的行为方式: 确认突破后的颜色翻转——如果价格完全穿过区域的一侧边界并收盘,矩形会切换颜色以反映新的市场状态(被向上突破的空头区域会变成多头区域,反之亦然)。这是一个实时信号,表示市场控制权已发生变化。 自动清理——当价格干净地穿过区域的两侧并收盘后,该区域不再具有意义,矩形会自动删除,使图表保持整洁。 区域来源选择——Rectangle source line 输入允
Enigmera MT5
Ivan Stefanov
3.67 (3)
ENIGMERA:市场的核心 (这是一个手动指标,包含的某些功能可能不被当前 MetaTrader 测试环境所支持) 简介 此指标和交易系统是一种对金融市场的独特方法。ENIGMERA 利用分形周期精确计算支撑和阻力水平。它揭示真实的积累阶段,并给出方向和目标。无论市场处于趋势还是调整阶段,该系统都能发挥作用。 工作原理 大多数功能通过图表左侧的按钮控制,使您能够快速应对不同的市场状况。 按钮说明 ON/OFF – 显示或隐藏整个指标。 Support – 趋势的主要支撑线。 Ch – 激活支撑通道,显示允许的偏差范围。 Dev1(第一偏差)– 表示价格在支撑偏差内的波动,提示市场盘整或能量积累。 Dev2(第二偏差)– 表示价格在偏差之间的波动,提示趋势的形成与方向。 Dev3(第三偏差)– 表示趋势显著加速和高波动性。 45deg(45 度)– 显示相对于 45 度线的市场节奏与稳定性。 Tgt(目标)– 趋势目标线,指示可能的平仓区域。 Tgt Dev – 目标价格的可能波动通道。 Vol(成交量)– 在蜡烛图上显示成交量点,以标识显著的市场成交变化。 X – 当市场达到目标线时
Fifty Pro MT5
Ivan Stefanov
这是为数不多仅基于价格计算水平的指标之一。该指标不受时间周期、趋势或市场周期的影响,是有史以来最具逻辑性的指标之一。 现在, FIFTY 指标推出了自动版本,无需手动绘制水平线。此版本会自动在图表上绘制每日、每周、每月和每年的水平线,确保精确并节省时间。此外,提供了按钮用于切换这些水平线的显示,方便用户完全自定义。对于喜欢手动方式的用户,免费版本仍然可用且功能齐全,可根据交易需求选择手动或自动工具。 非常可靠,强烈推荐!快来索取你的手动版 FIFTY 指标吧! 这是为数不多仅基于价格计算水平的指标之一。该指标不受时间周期、趋势或市场周期的影响,是有史以来最具逻辑性的指标之一。 现在, FIFTY 指标推出了自动版本,无需手动绘制水平线。此版本会自动在图表上绘制每日、每周、每月和每年的水平线,确保精确并节省时间。此外,提供了按钮用于切换这些水平线的显示,方便用户完全自定义。对于喜欢手动方式的用户,免费版本仍然可用且功能齐全,可根据交易需求选择手动或自动工具。 非常可靠,强烈推荐!快来索取你的手动版 FIFTY 指标吧!
传奇的威廉·甘氏(William Gann)水平,全自动 MT5 指标。GANN Master 基于每日、每周和每月数据,精准定位价格最可能反转或继续趋势的关键区域。 主要功能: 一键时间周期按钮:点击 “Daily”/“Weekly”/“Monthly”,即可即时绘制当日、当周或当月的关键区域 自动与手动模式 自动模式:GANN Master 自动为您计算所有水平,无需手动输入 手动模式:拖动 “Top” 和 “Bottom” 线来定义自选波段点;所有 Gann 水平即时重新计算 多头与空头水平:同时显示买入和卖出水平;线条汇聚时标志着强劲支撑或阻力区域 灵活的品种支持:适用于外汇、贵金属(如黄金)、指数、加密货币及任何高价值品种——只需在设置中切换类别,即可自动调整刻度和倍数 直观用户界面:清晰配色、简洁标签和直观按钮,实时调整水平毫不费力 即战准备区:任意时间框架下,为止盈和风险管理提供精确目标区域 使用方法: 选择时间框架:点击 “Daily”/“Weekly”/“Monthly” 生成支撑与阻力线 选择品种类别:在设置中选定 “Forex”/“Metals”/“Indices
Speculator MT5
Ivan Stefanov
SPEKULATOR 是一个手动交易系统和指标,帮助您识别关键支撑区域和市场方向。 用简单的策略和隐藏的智慧掌握市场。 您可以在图表上选择任意一个顶部(TOP)和底部(BOTTOM),指标将自动绘制: 您趋势方向的支撑区。 如果是多头趋势,将显示绿色区域;如果是空头趋势,将显示红色区域。该支撑区的灵敏度可以在设置中调整。该区域基于您选择的趋势,表示支撑最可能出现的位置。 高偏差线和低偏差线 根据甘氏九宫格(W.D. Gann’s Square of 9)计算的角度线 入场规则如下: 如果价格向上突破高偏差线,可以做多 如果价格向下突破低偏差线,可以做空 如果价格在偏差线之间震荡,可以在区间内高抛低吸,同时遵守支撑区的方向 甘氏角度线可用作止盈参考 关键水平是360度线: 如果价格高于该线,市场可能会上涨 如果价格低于该线,市场可能会继续下跌 加载指标后,它会出现在图表上的第20根到第50根K线之间。 点击该线即可激活,激活后可以将其移动到任意顶部或底部。 SPEKULATOR 是少数几个将清晰逻辑与优雅视觉效果结合在一起的指标之一。 您可以选择启用区域之间的颜色渐变,使图表显示更为平
Naturu
Ivan Stefanov
5 (1)
“Naturu” 是一个使用大自然对称性作为算法的手动指标。 用简单策略和隐藏智慧,掌控市场! 加载指标后,您会看到两条线——上线(Top)和下线(Bottom)。 单击一次即可激活某条线。要移动,只需点击您想放置该线的那根K线。 您设定一个高点和一个低点,指标会自动计算: 洋红色区域,显示多空双方兴趣最接近之处,也就是最有可能成为支撑/阻力的区域。 灰色区域,标示下一层次的关注区。 青绿色线条,表示多方的目标价位。 金色线条,表示空方的目标价位。 手动指标赋予您完全的控制和灵活性,让您根据实时市场环境和个人直觉调整级别。它们迫使您更深入地亲自分析价格走势,帮助您真正理解支撑、阻力和形态是如何形成的。依靠人工判断,可以过滤掉自动系统常常误判的大量“噪音”,减少错误信号。而且,因您亲自设定每个级别,可在突发新闻或极端行情时立即调整,无需等候代码更新。 隐藏于简单游戏背后的神圣力量!
一种先进的动量振荡器,可根据市场波动性自动调整计算周期,从而更准确地识别超买和超卖信号。 工作原理 该指标使用自适应周期计算方法:在高波动性情况下缩短周期,在低波动性情况下延长周期。这种动态调整在趋势市场中能够提供更快的信号,并在震荡行情中减少虚假信号。 RSI 数值基于这一可变周期进行计算,因此对当前市场状况更加敏感。仍然使用传统的 30(超卖)和 70(超买)水平,但由于其自适应特性,这些水平被触及时具有更高的参考价值。 主要特点: 根据市场波动性自动调整计算周期 在图表上显示买入 / 卖出箭头 彩色振荡器:高于 50 为绿色,低于 50 为红色 在趋势行情中反应更快 在震荡行情中减少虚假信号 无重绘指标——K 线收盘后数值保持不变 适用于所有时间周期和所有市场
SuperTrend Apex - Adaptive Multi-Feature SuperTrend with Market Scanner! Complete adaptive trend trading system built around the classic SuperTrend concept, upgraded with: volatility regime detection smart flip filtering a live multi-symbol market scanner multi-timeframe overlay a built-in performance dashboard full alert package. Everything runs inside a single MT5 indicator, ready to use on any symbol and any timeframe - Forex, indices, metals, crypto and stocks. Adaptive ATR and Regime De
筛选:
Mase
1794
Mase 2026.07.04 09:03 
 

like all of Ivans Indicators big value add. In this case its masterpiece, highly recommend it. As always Ivan is very supportive and steady improving, its big joy with him. Big thx Ivan

Valeriu-alexandru Petrache
183
Valeriu-alexandru Petrache 2026.03.24 21:53 
 

The best system on the market. I recommend it with pleasure. Ivan has the best indicators and the most profitable systems. He is a wonderful man, who is happy to help you and who works on improvements every day.

回复评论