19
261
MERAVITH
An Institutional-Grade Market Analysis System for Advanced Traders
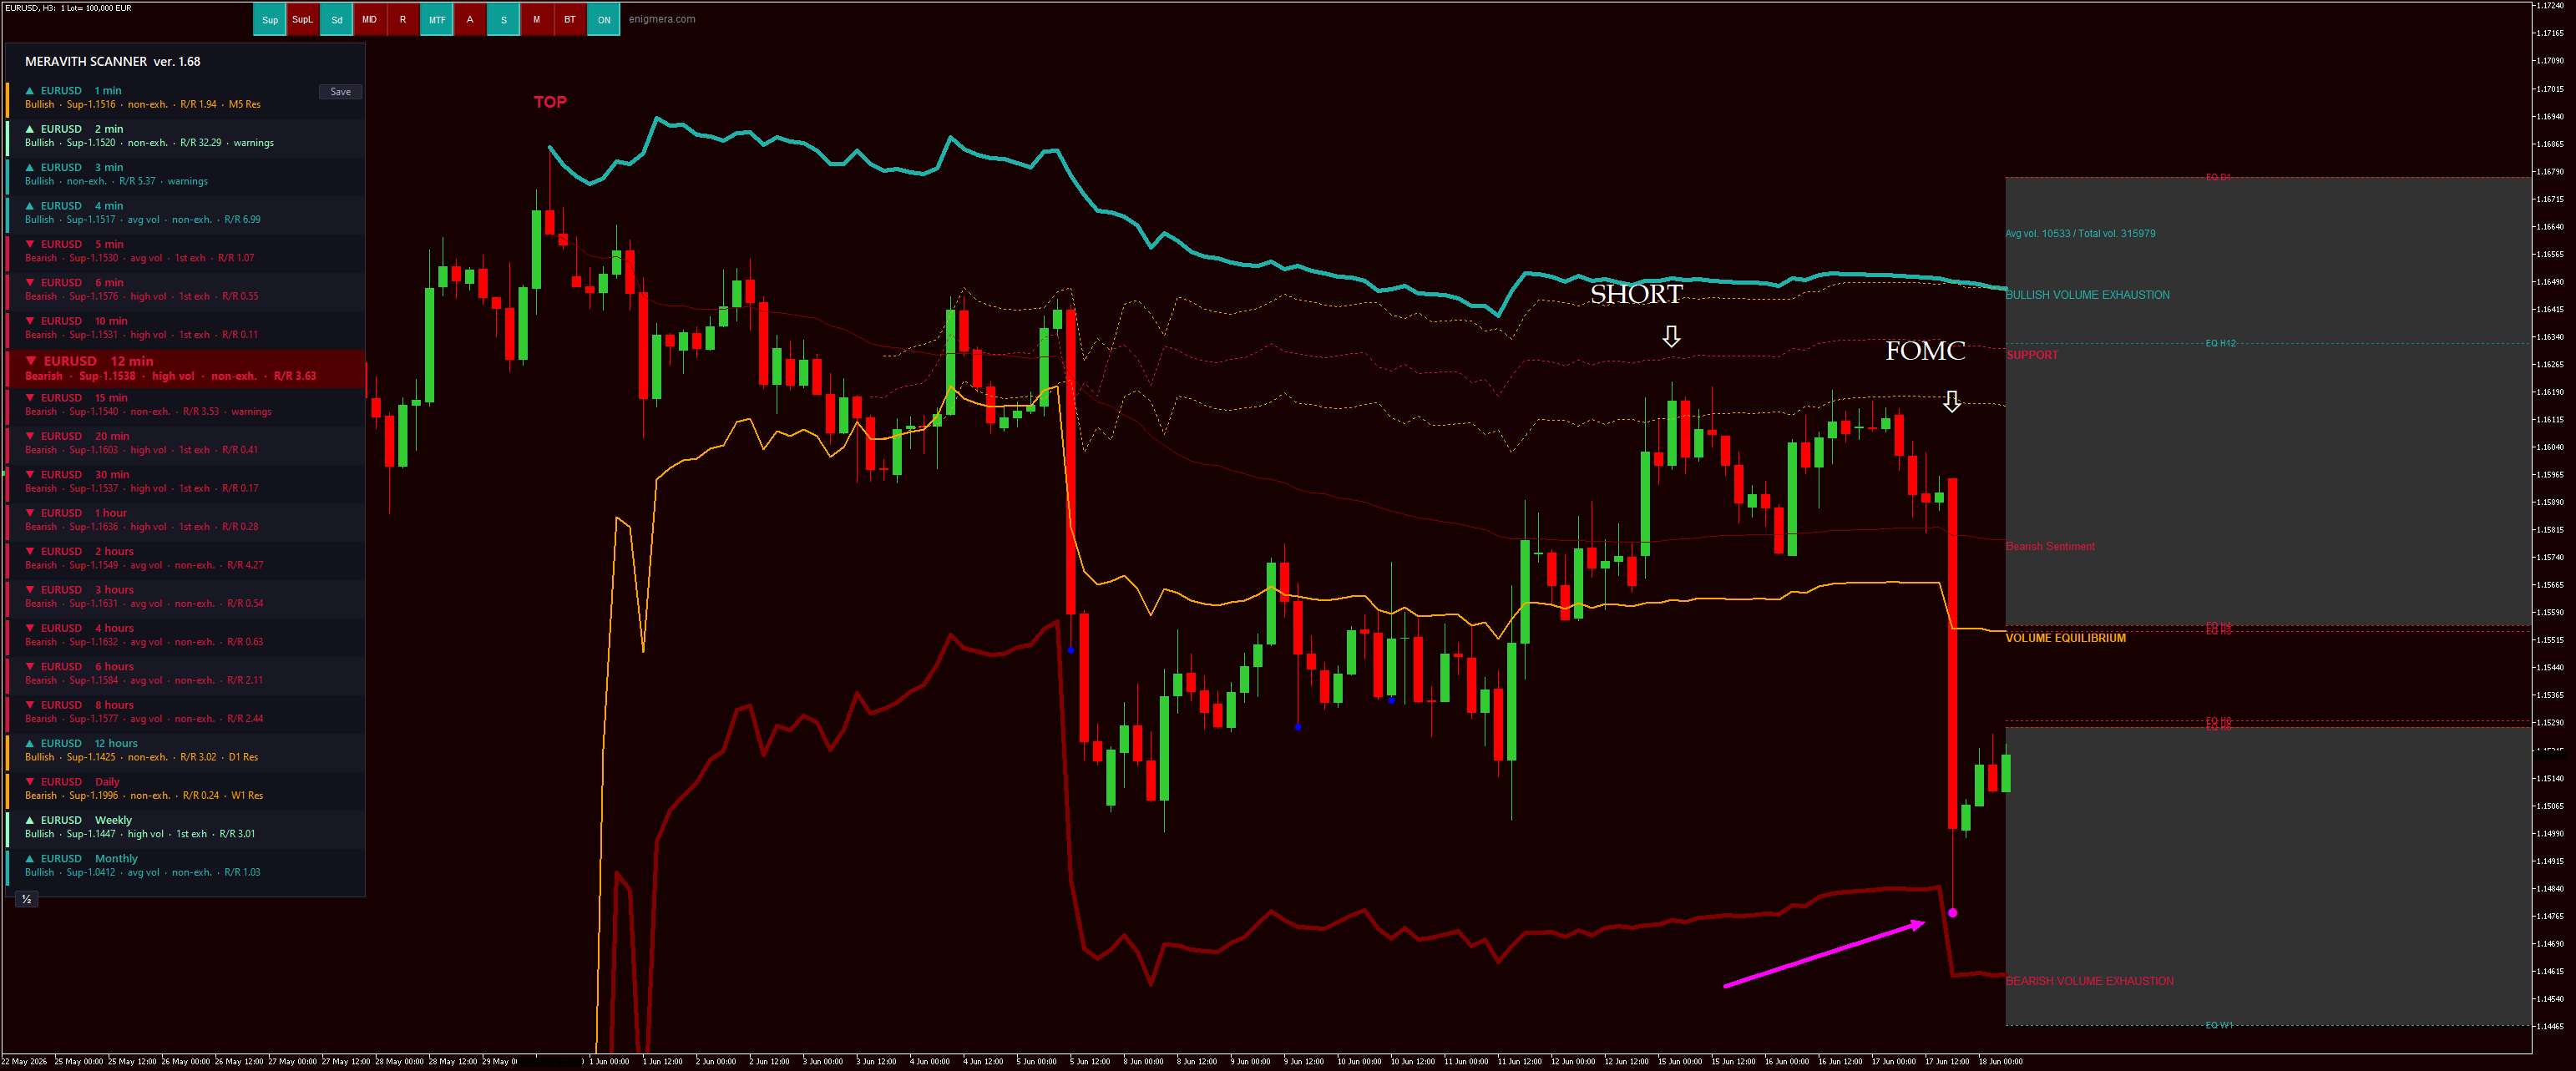
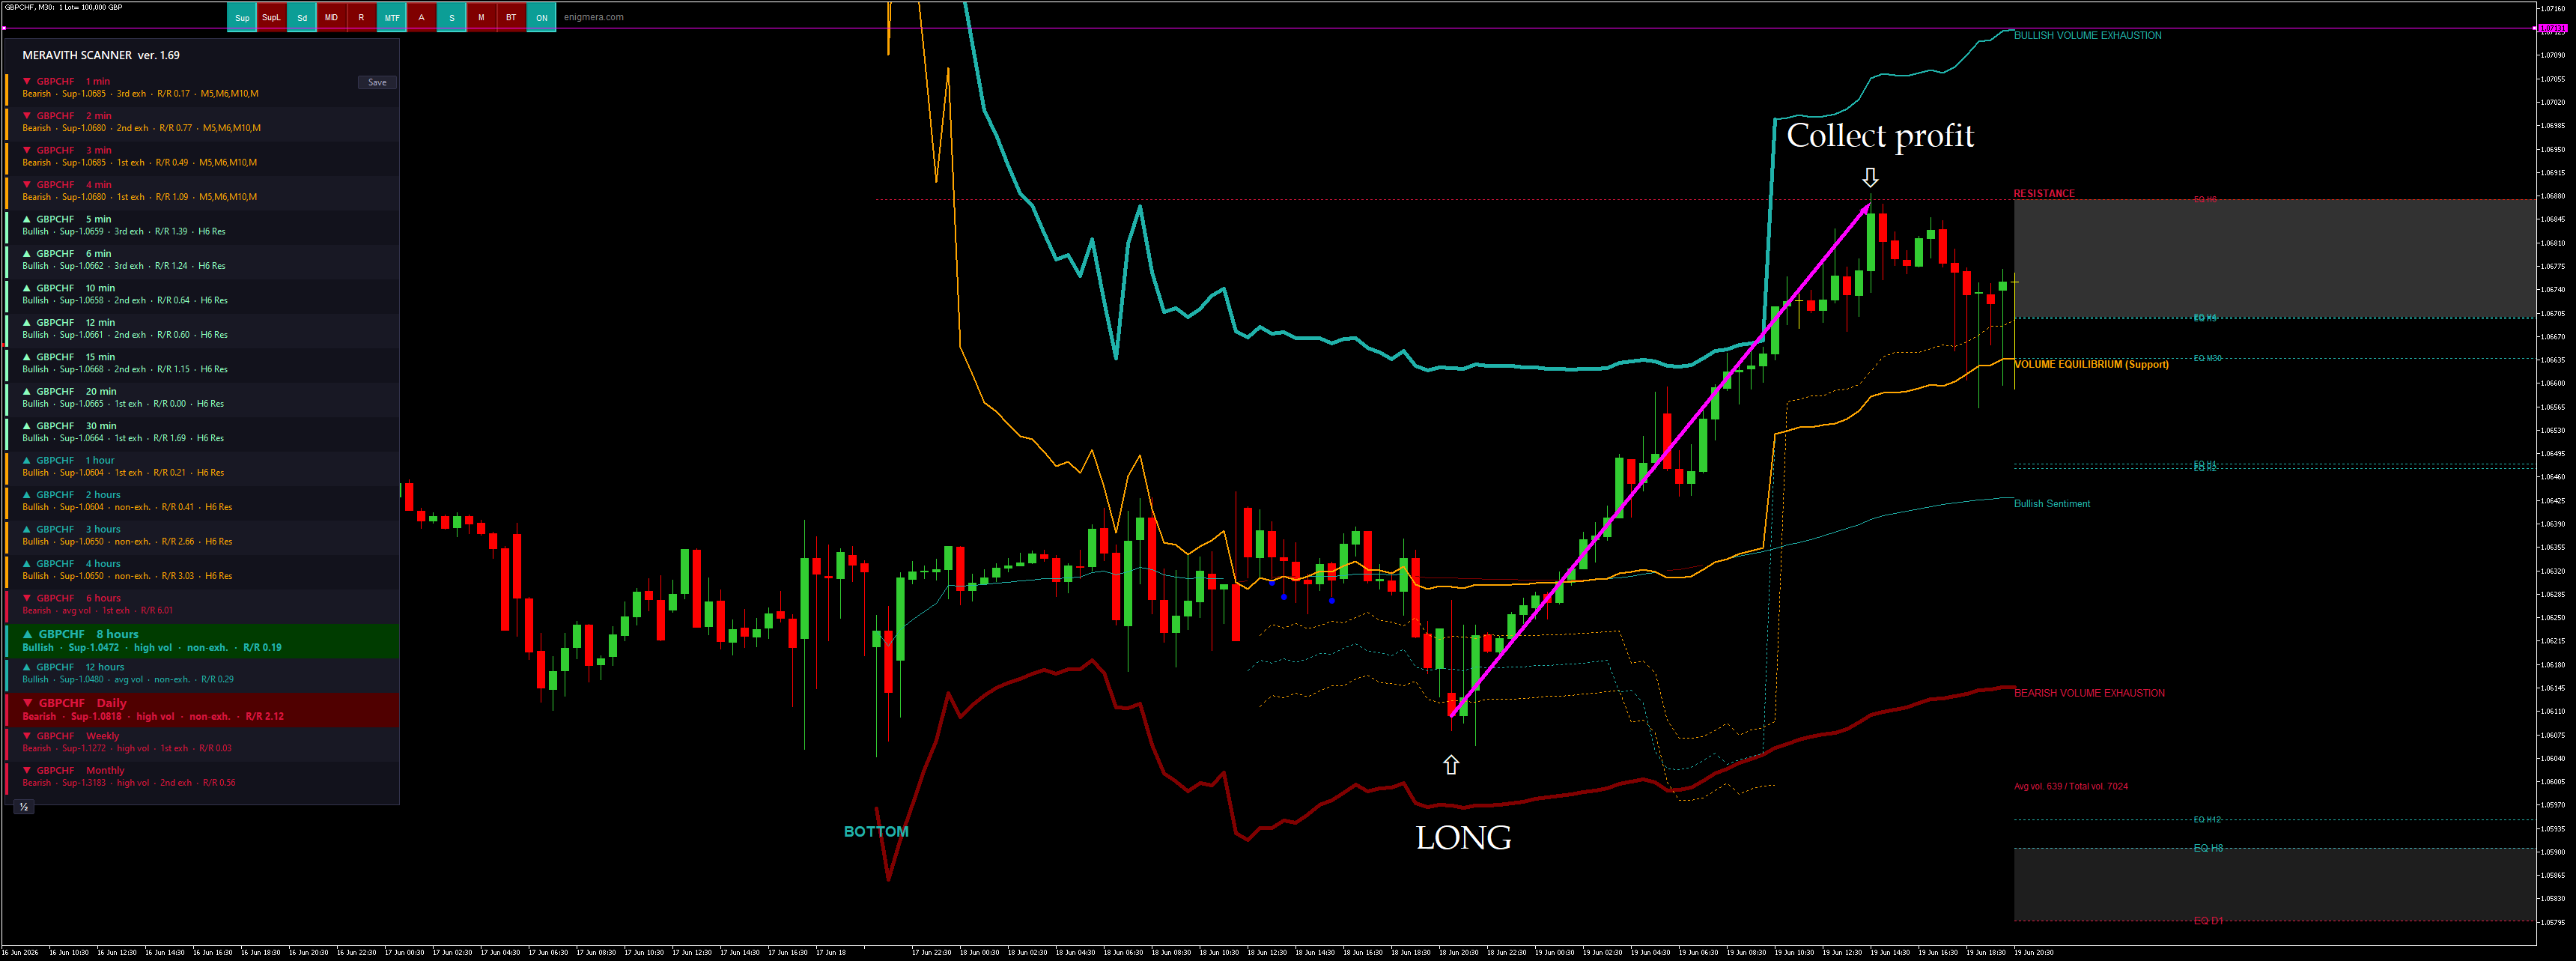
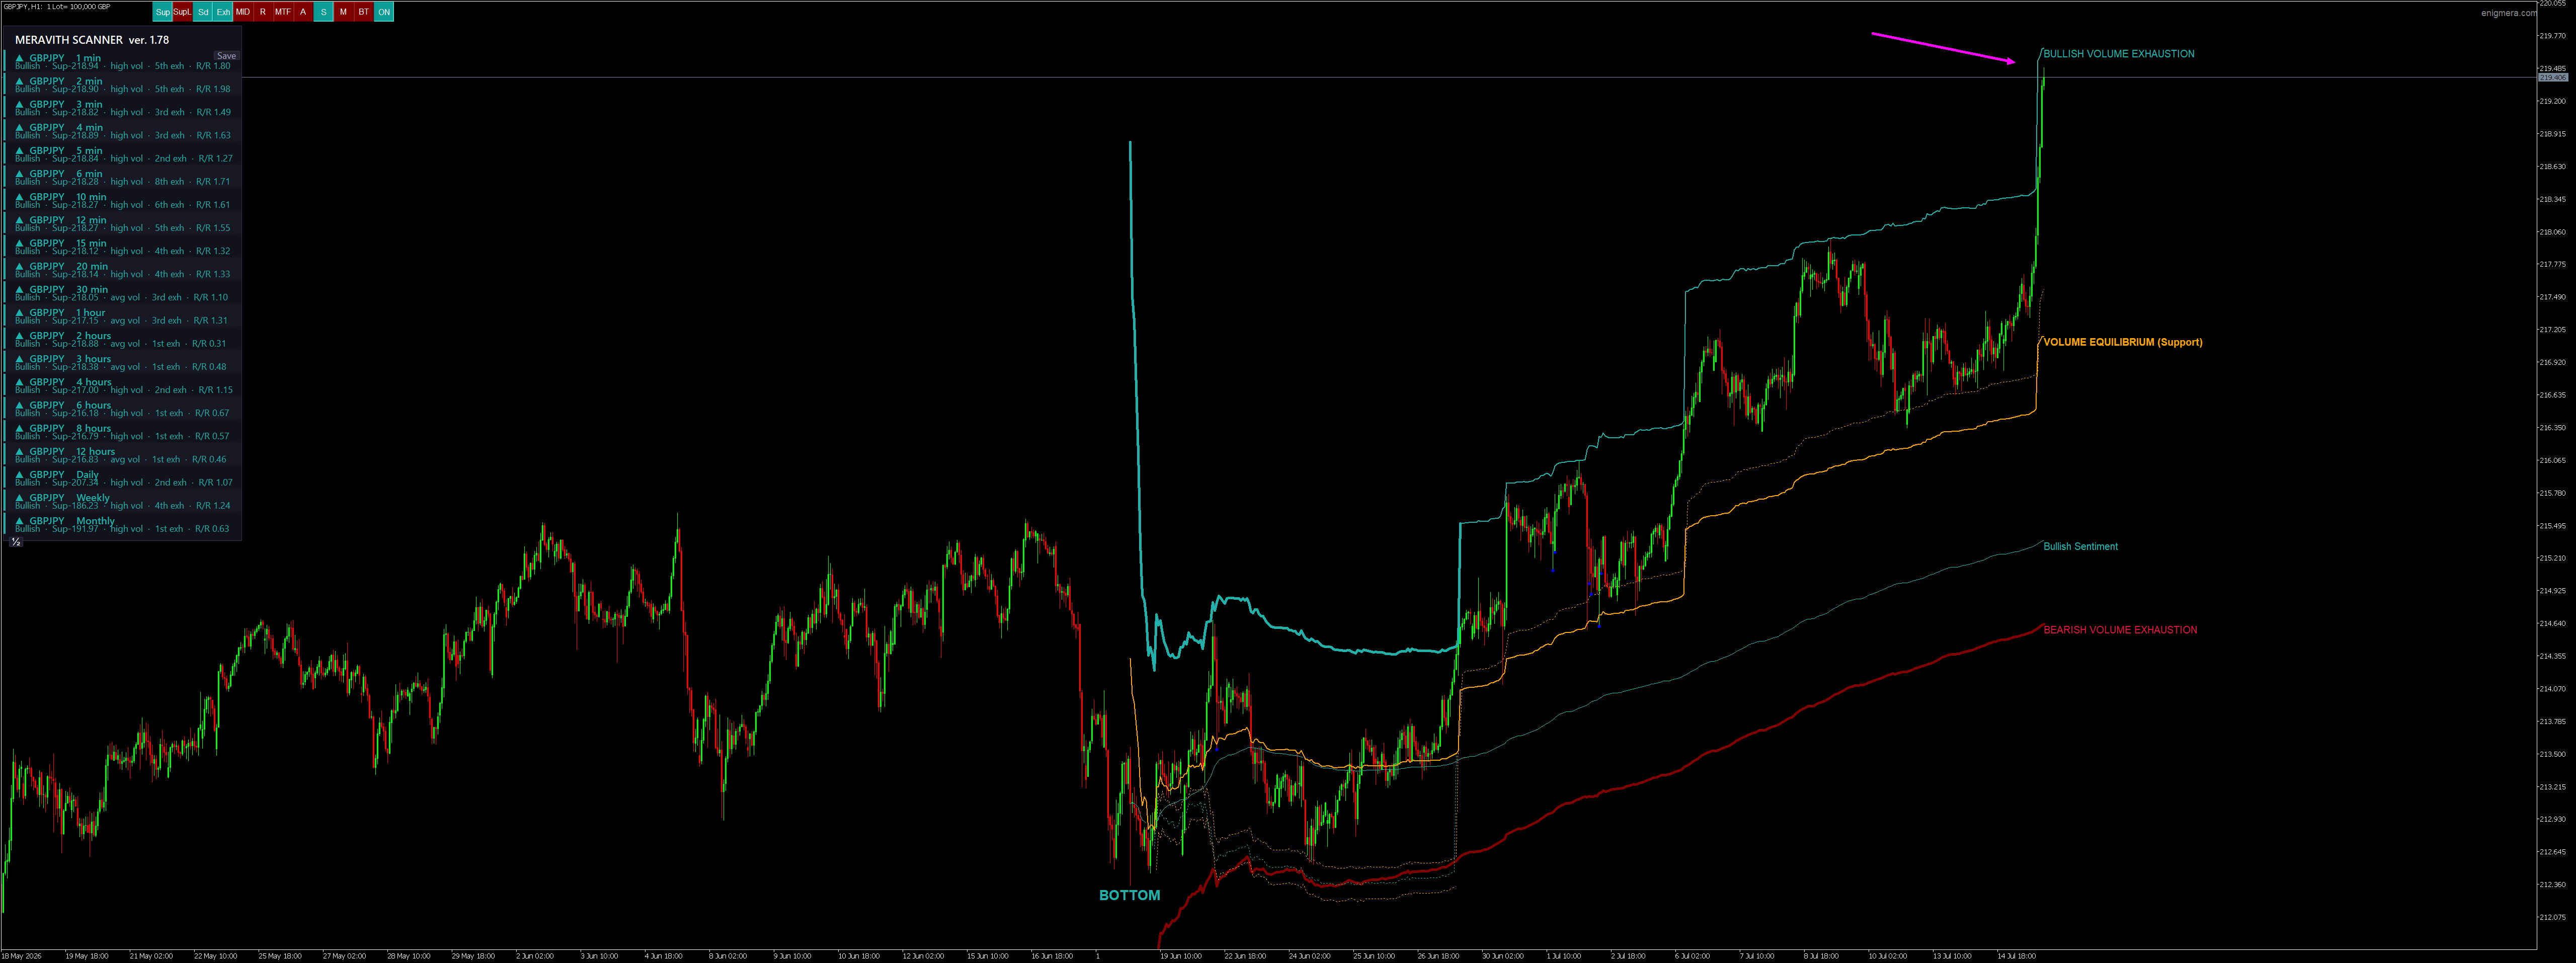
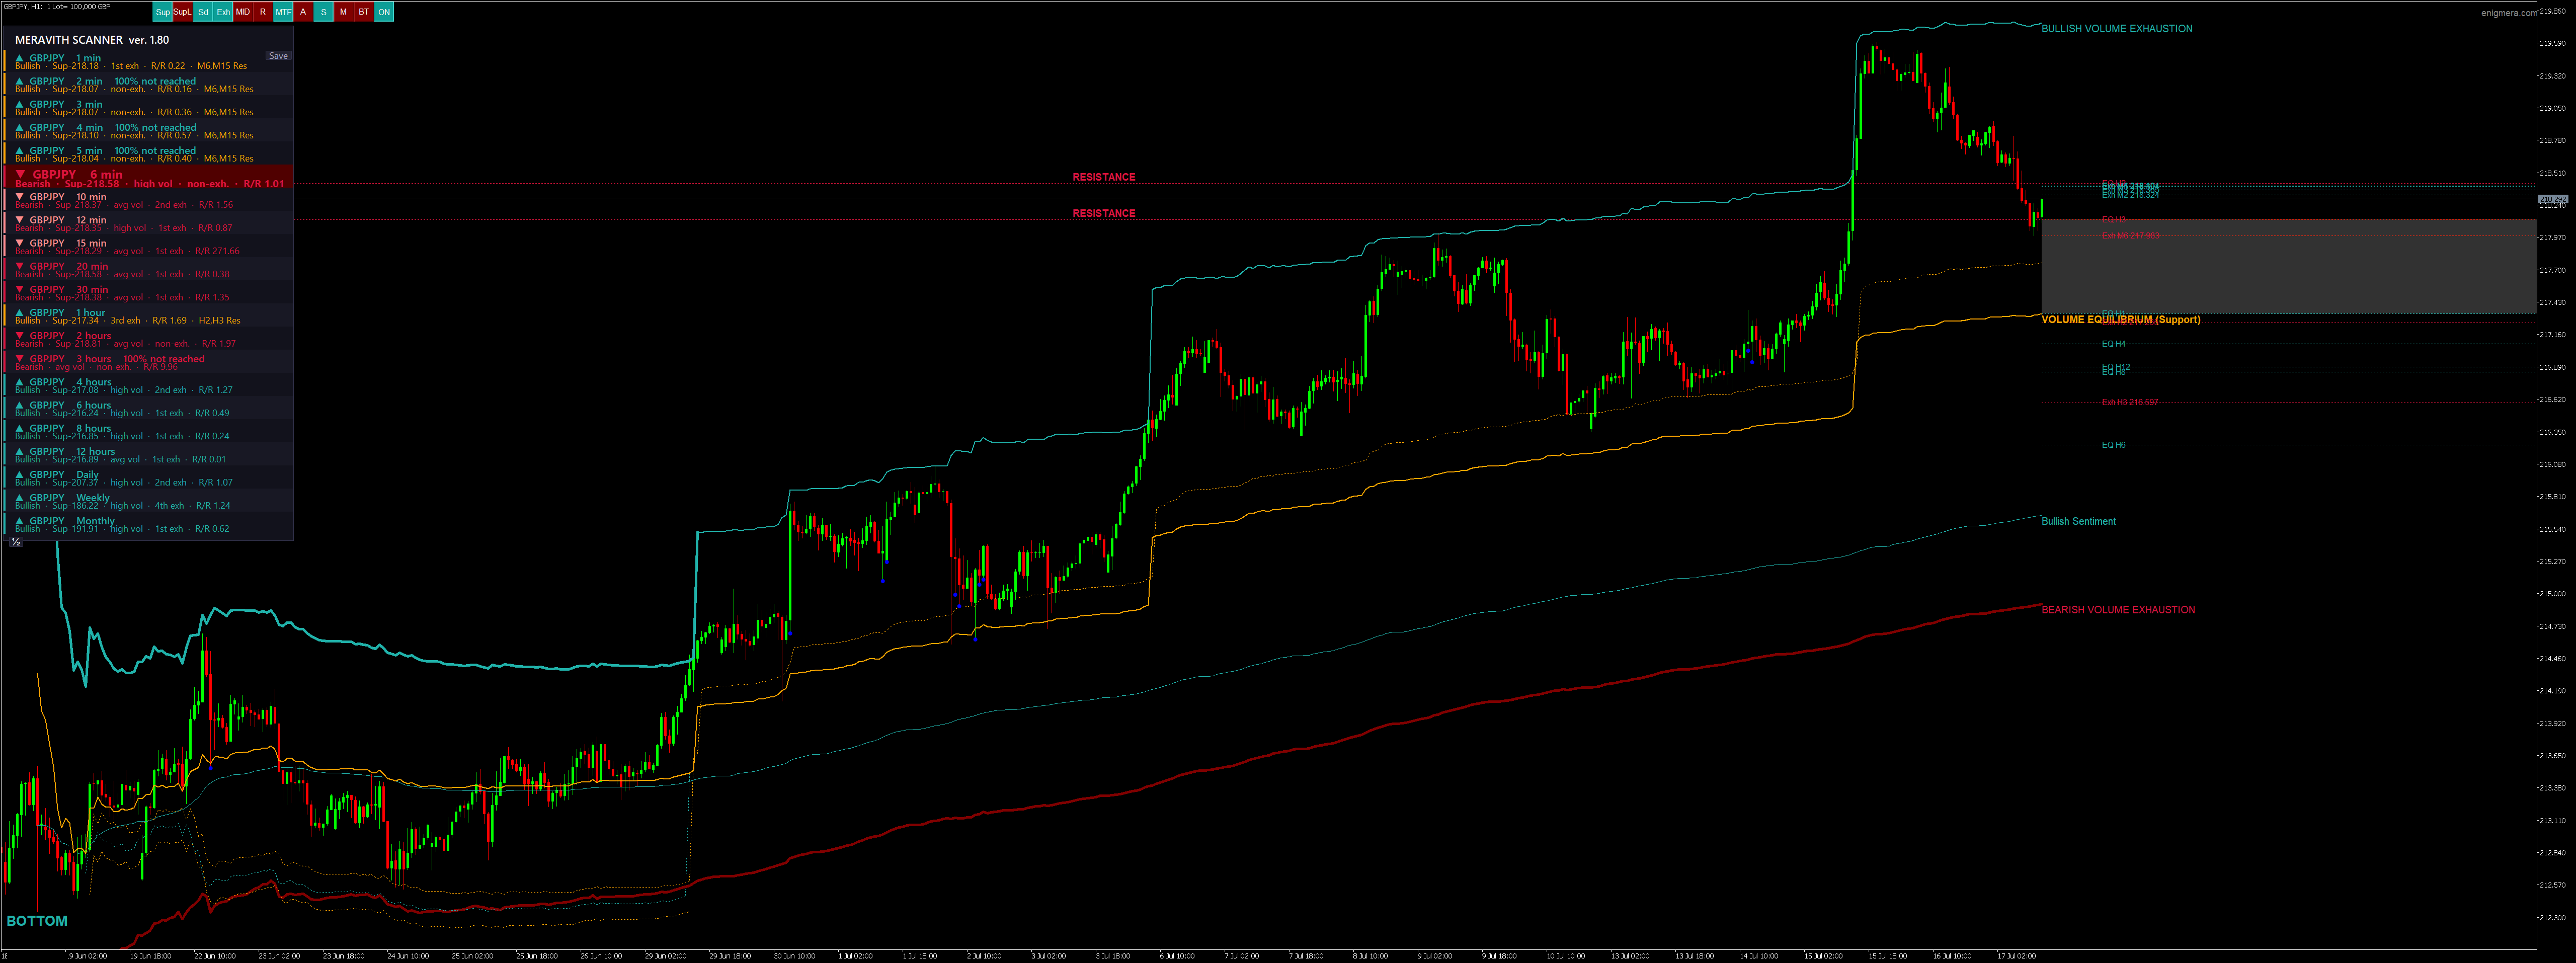
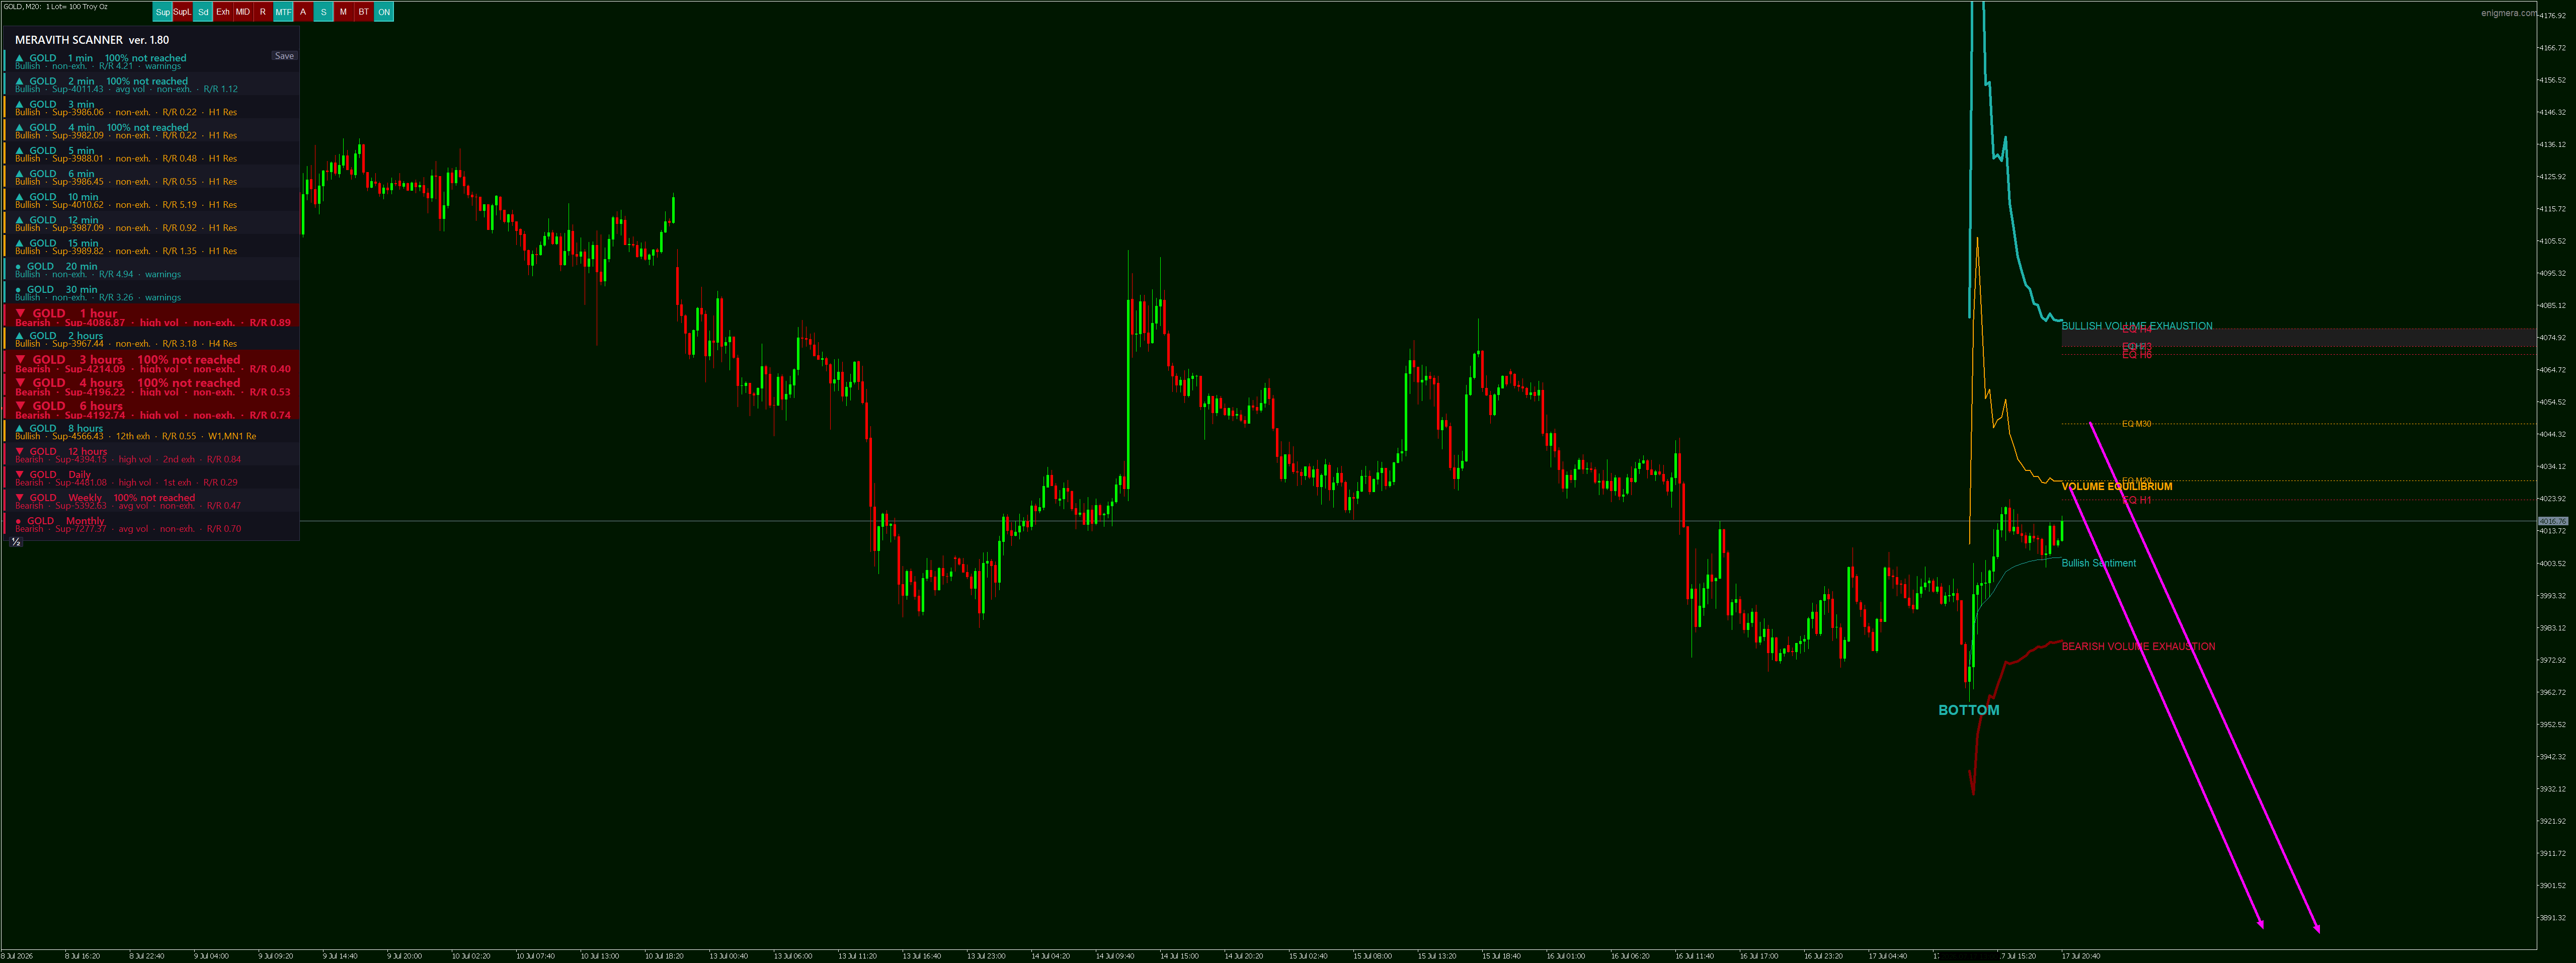
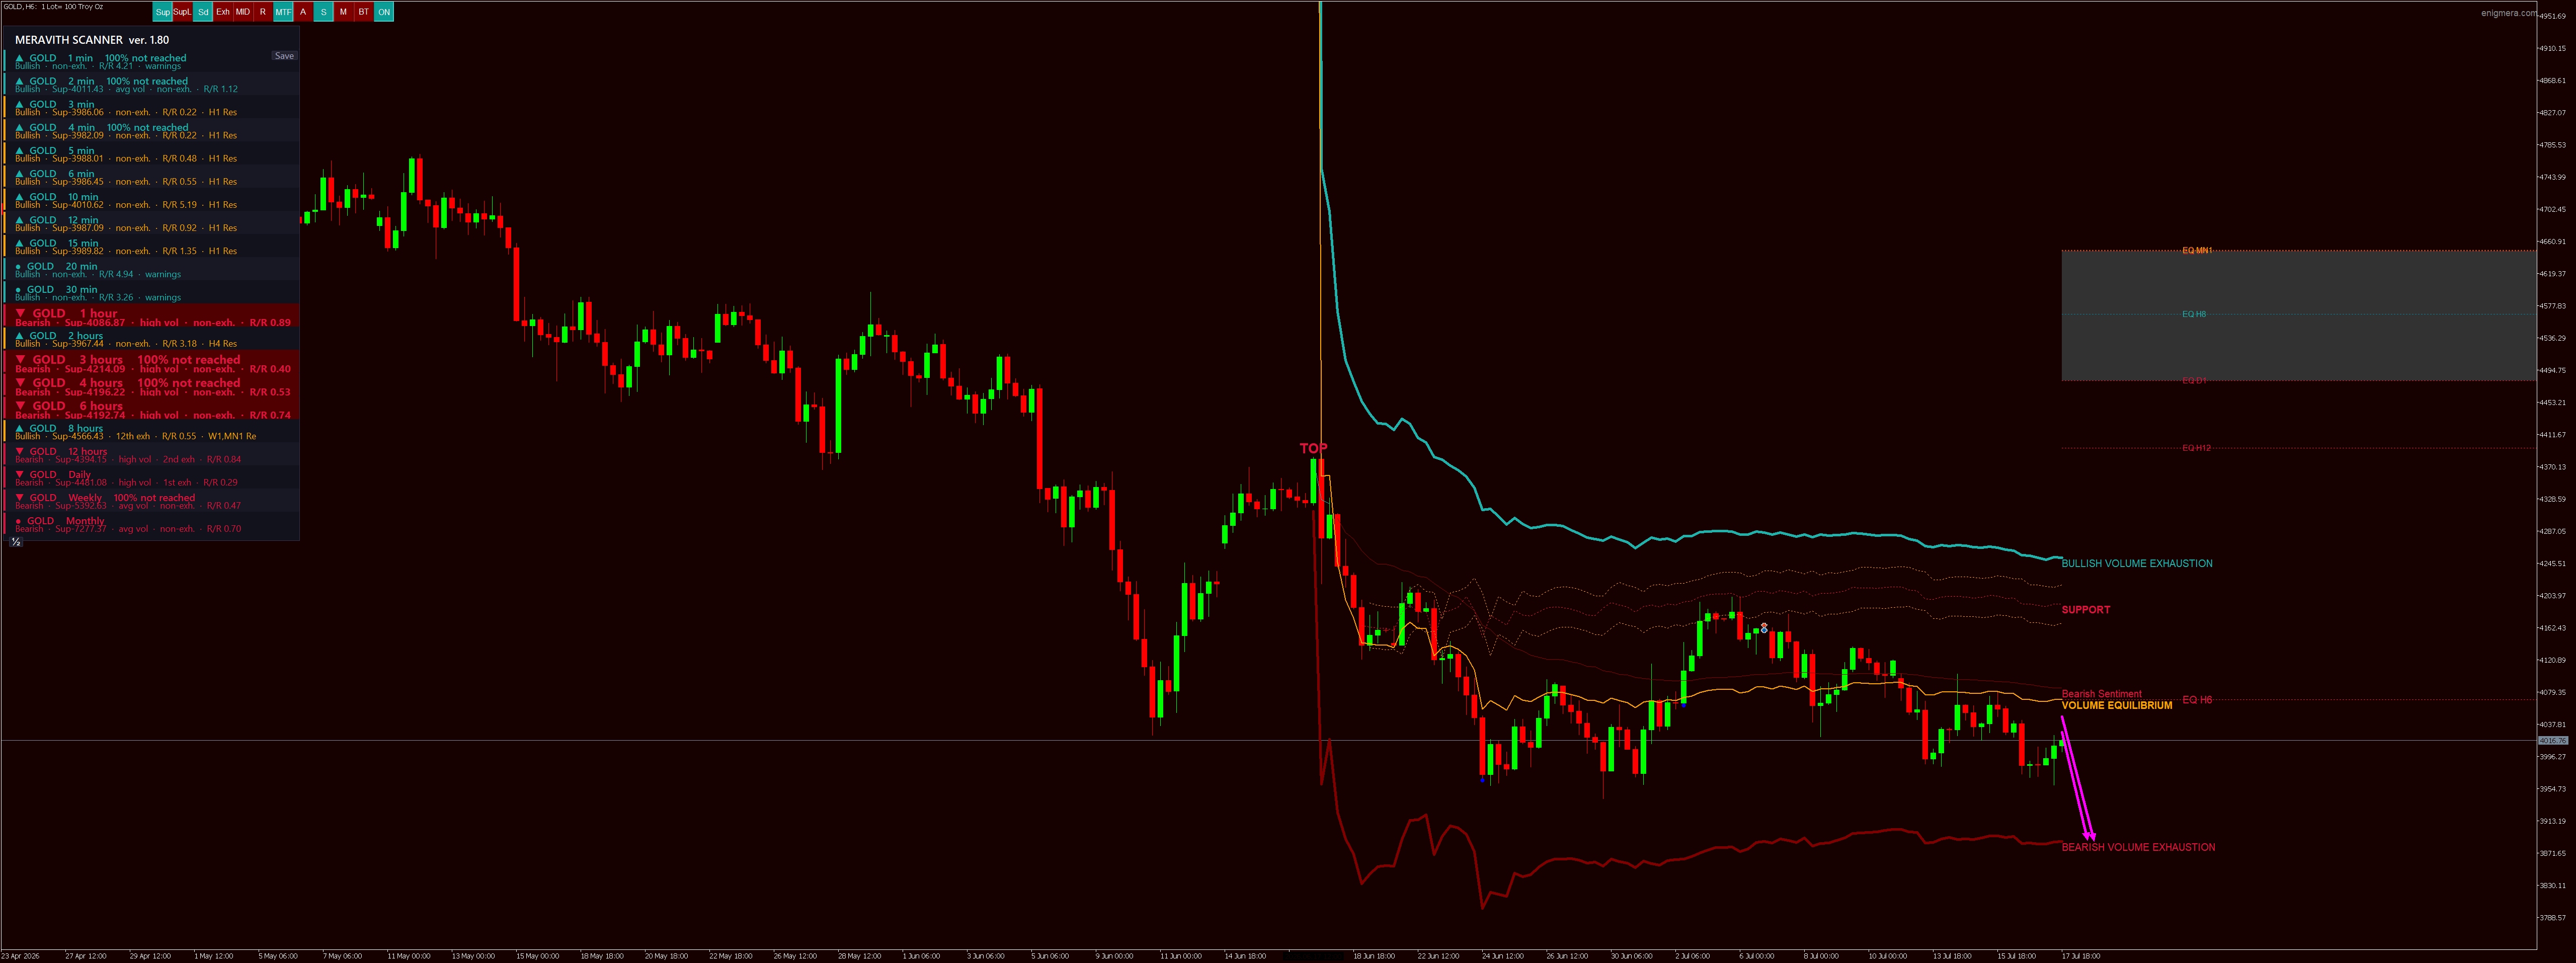
MERAVITH is a comprehensive trading framework engineered for traders who operate beyond conventional indicator workflows — those who base their decisions on market structure, order flow, and liquidity mechanics rather than lagging signals.
A Complete Trading System
MERAVITH is not a single-purpose indicator. It is a fully integrated decision-support system that consolidates structural analysis, equilibrium mapping, volume diagnostics, exhaustion detection, multi-timeframe confirmation, and precision entry, target, and stop-loss projection into one coherent workflow.
Every component is designed to operate in concert, providing the trader with a unified analytical environment from initial market reading to trade execution.
Liquidity Mapping Beyond Standard Tooling
The central capability of MERAVITH is its proprietary liquidity analysis layer. Rather than illustrating price action through conventional overlays, the system identifies and displays the precise zones where institutional liquidity is concentrated — the levels that frequently anchor reversals, drive directional shifts, and define meaningful market response.
Key analytical outputs include:
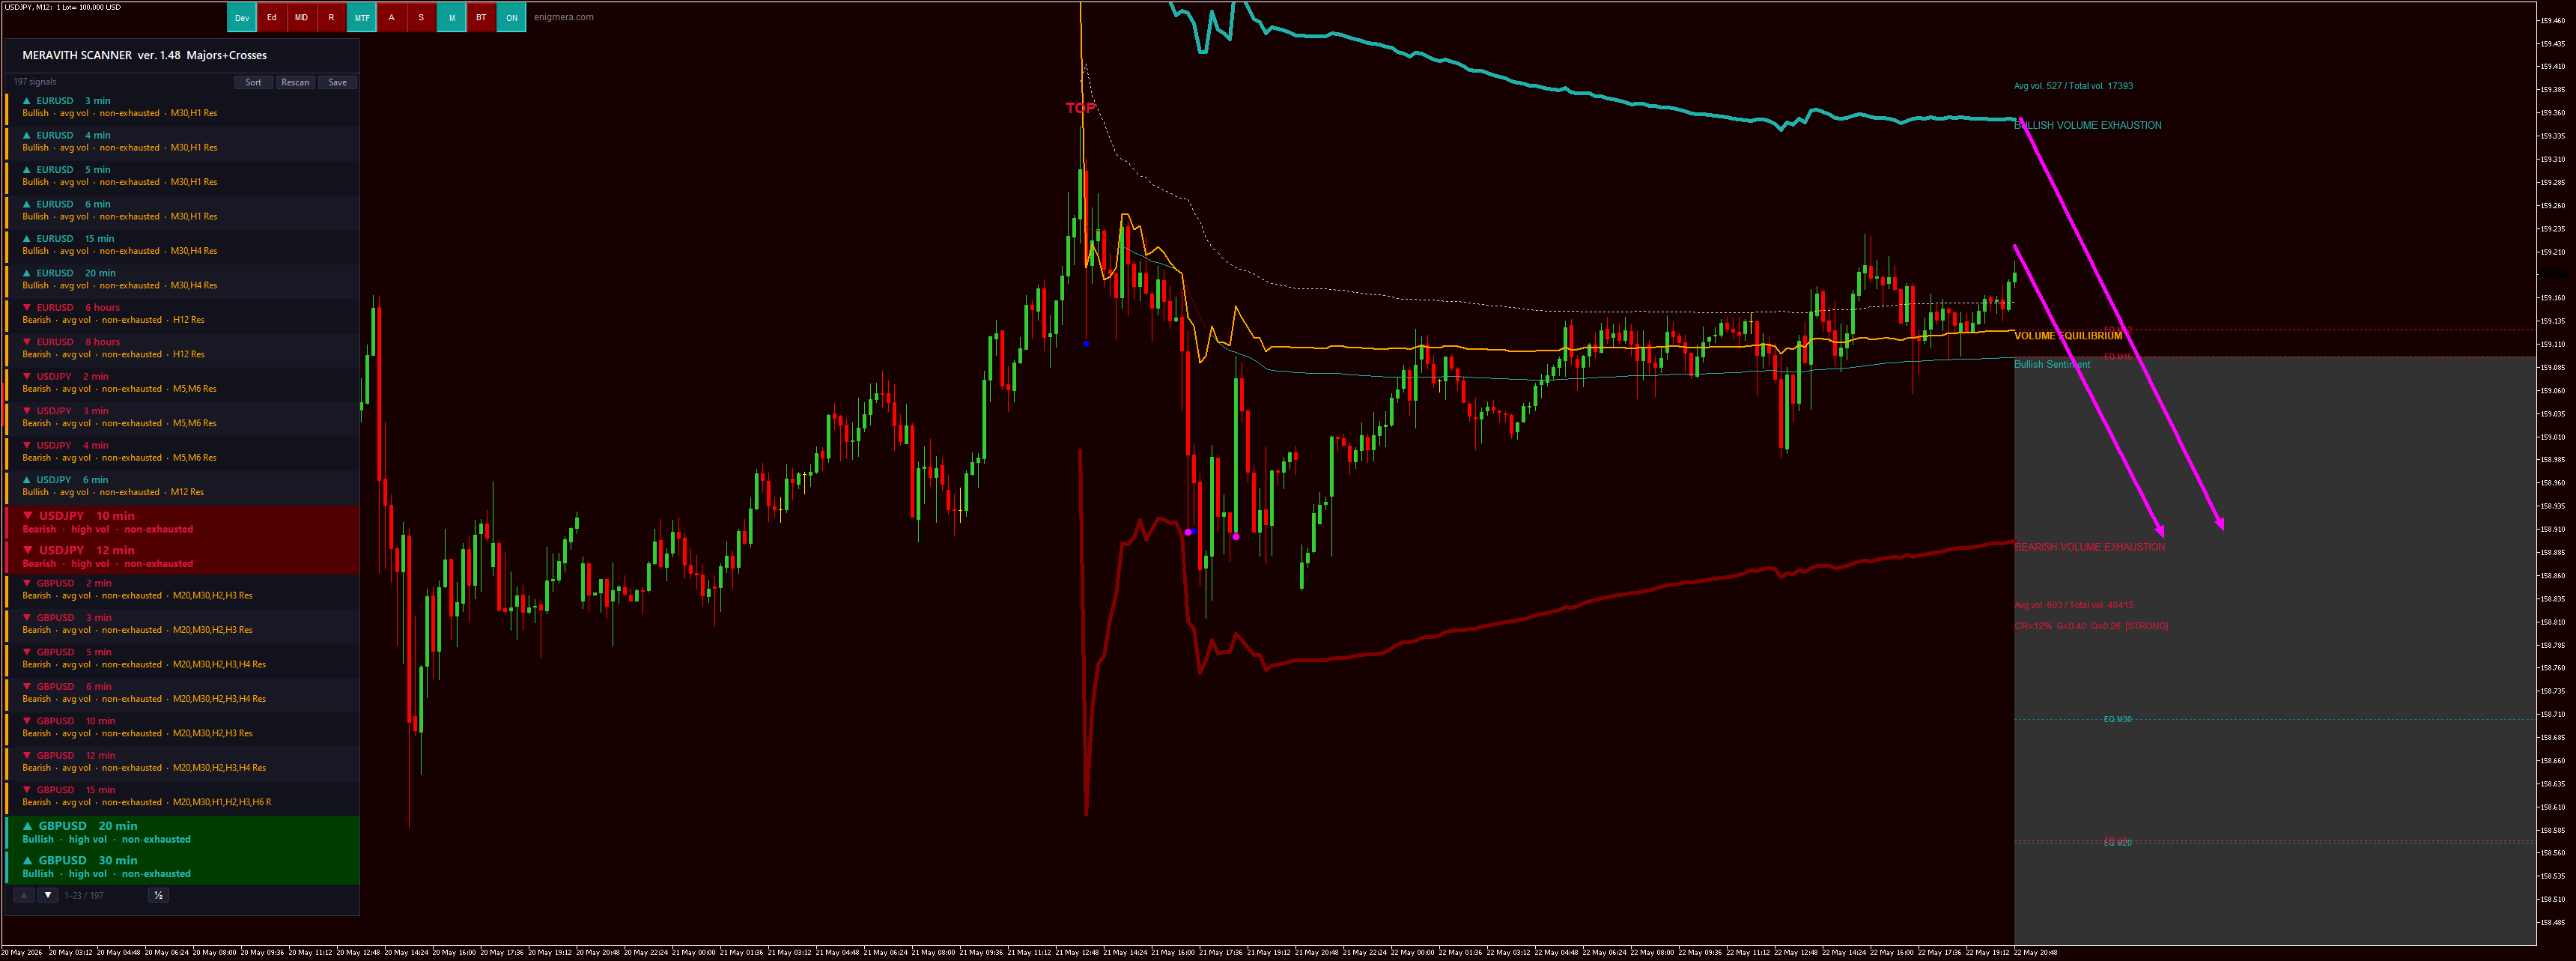
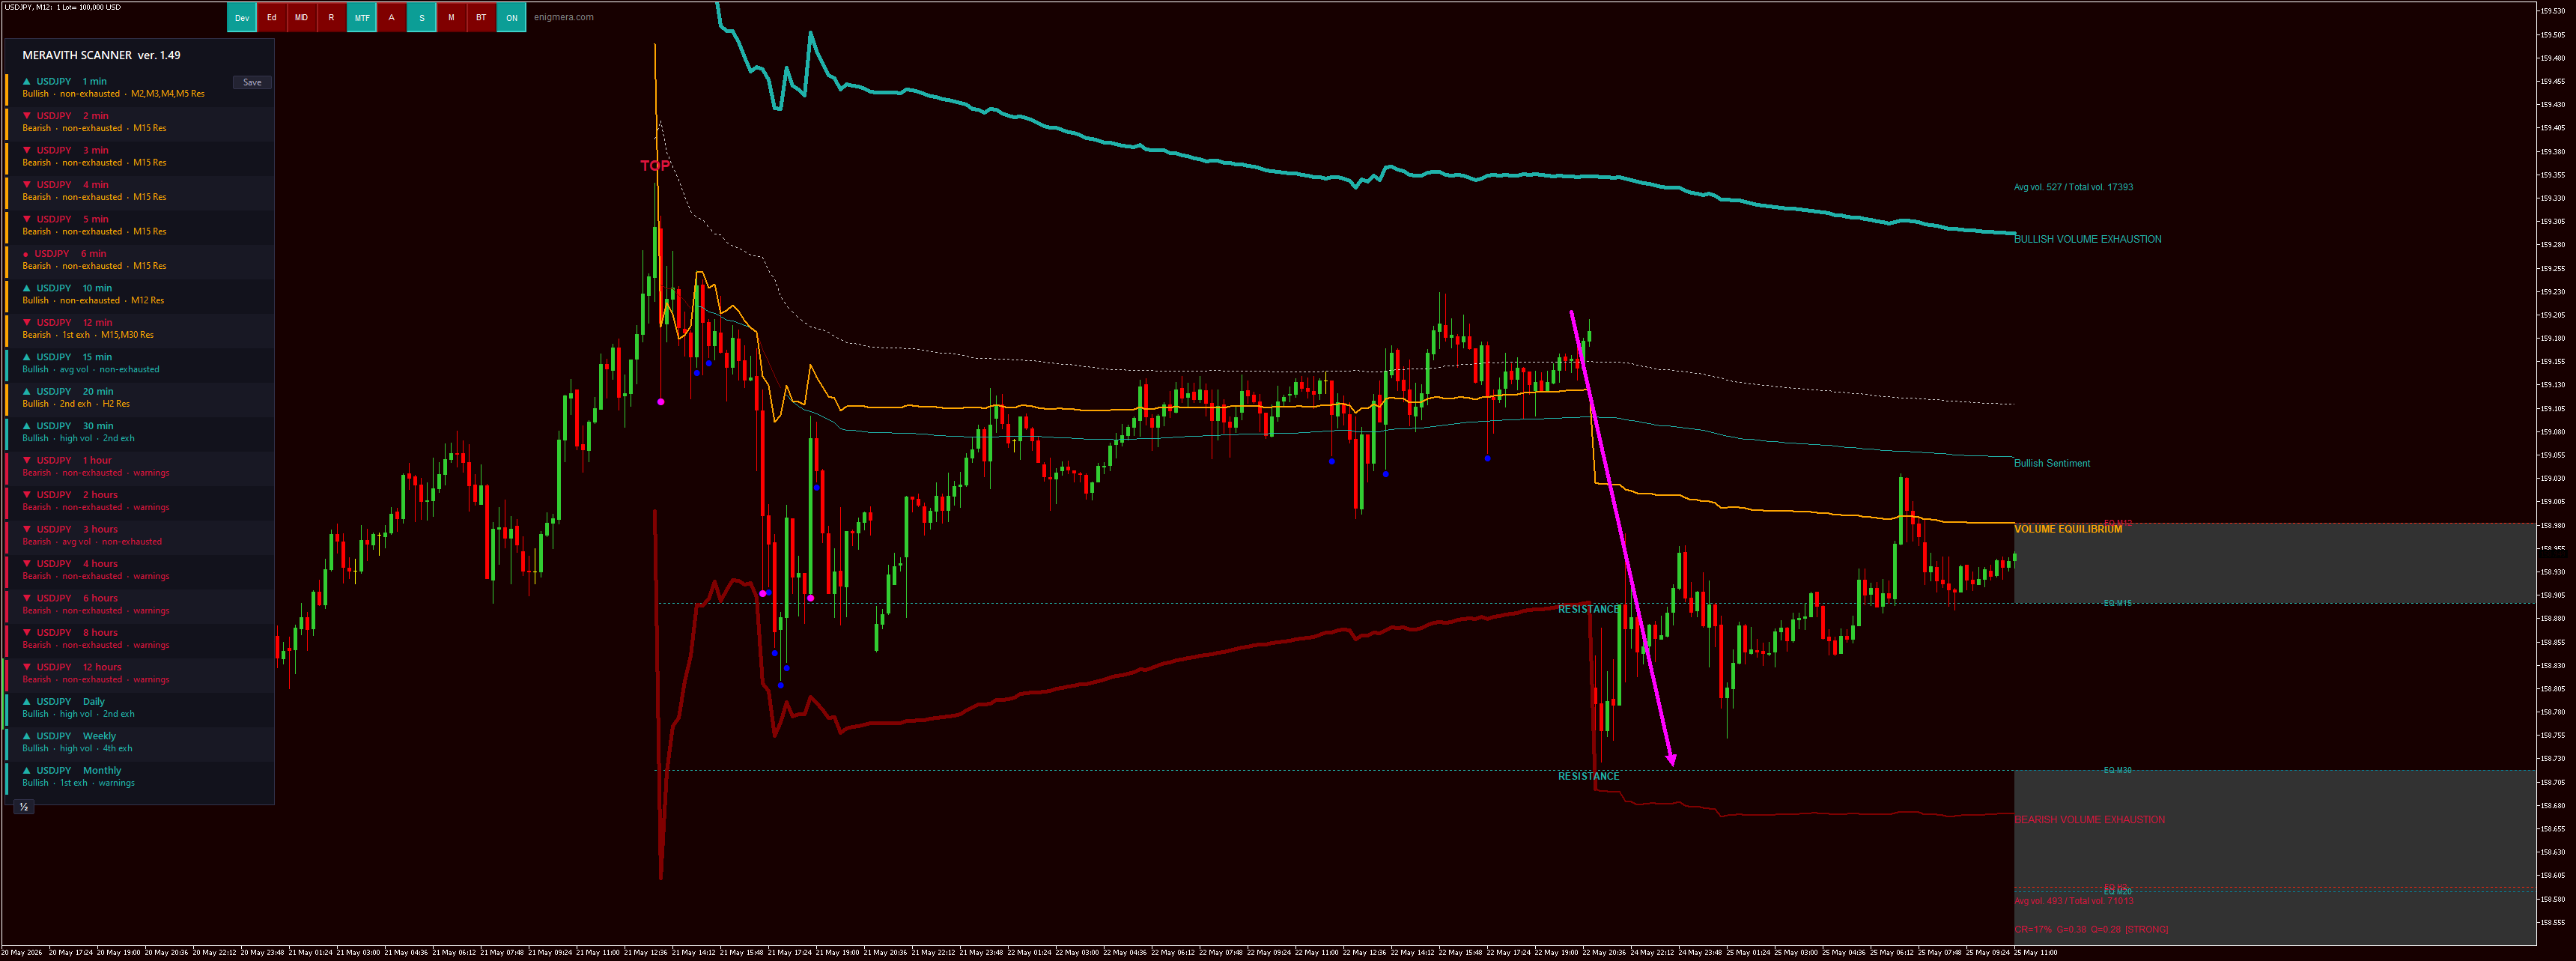
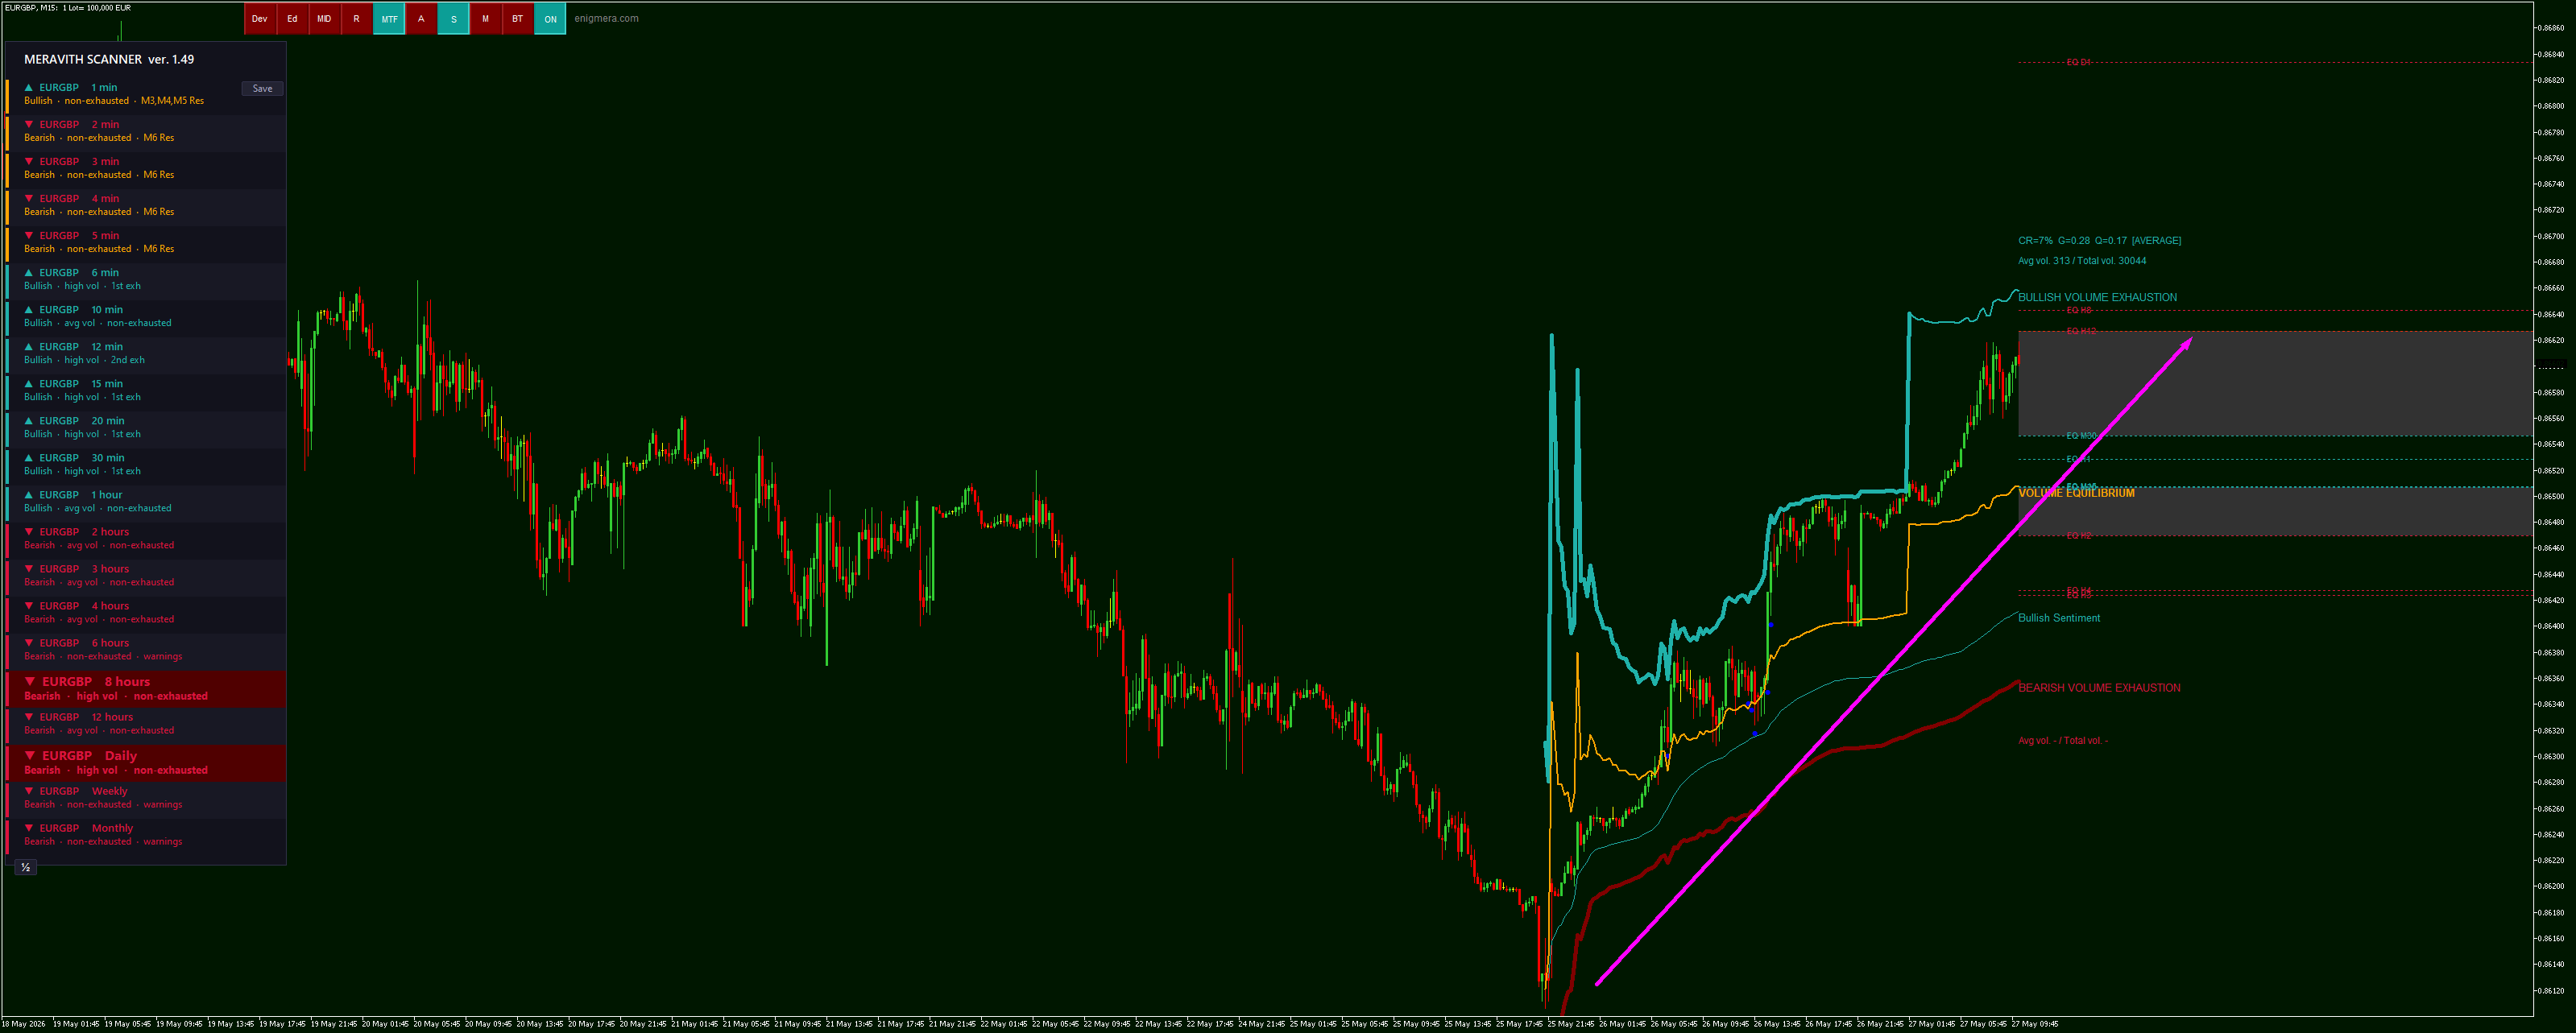
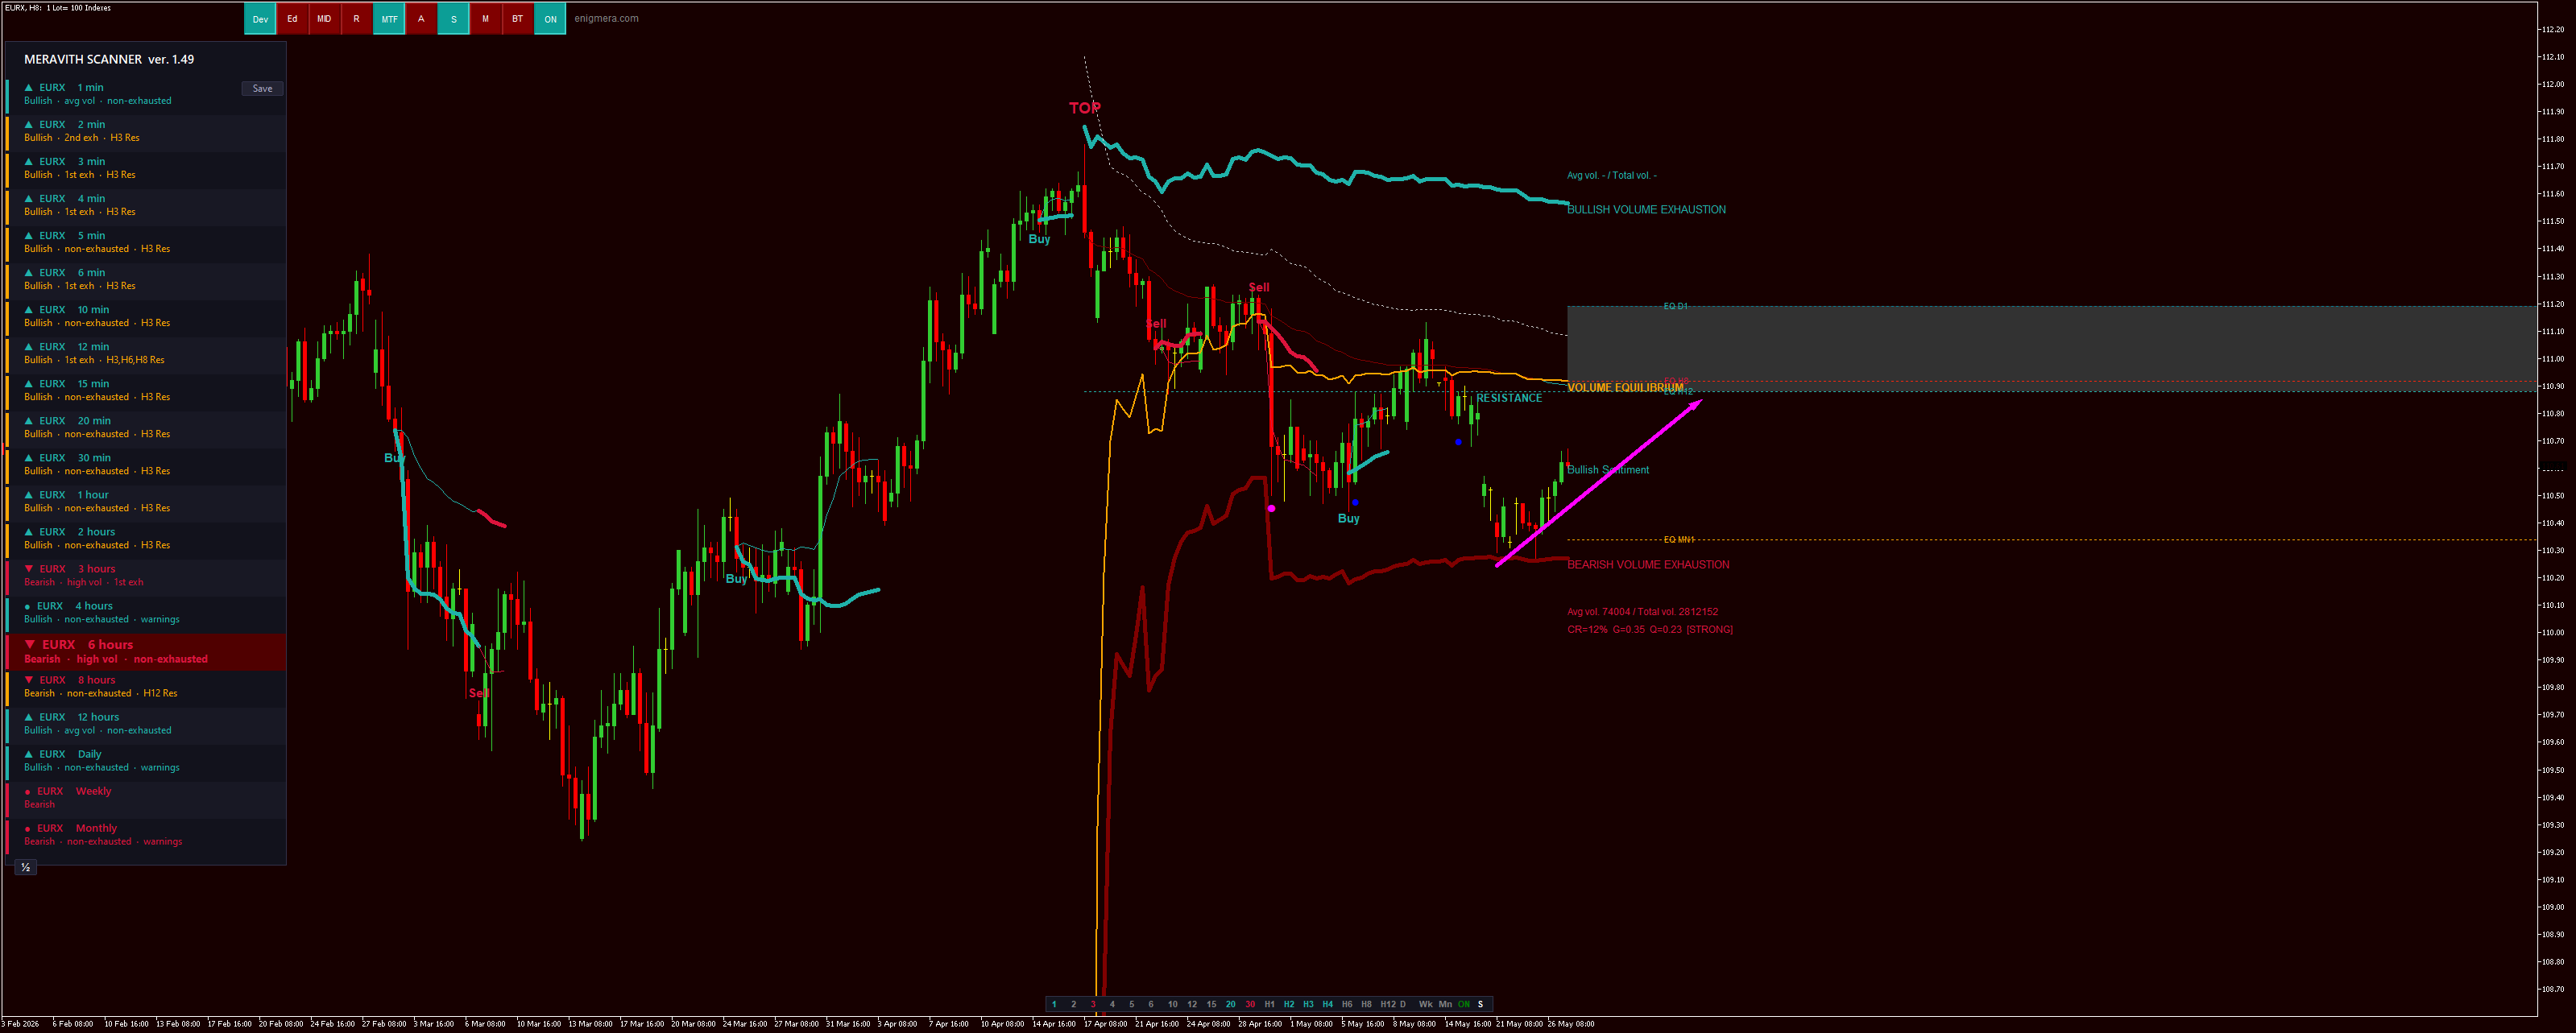
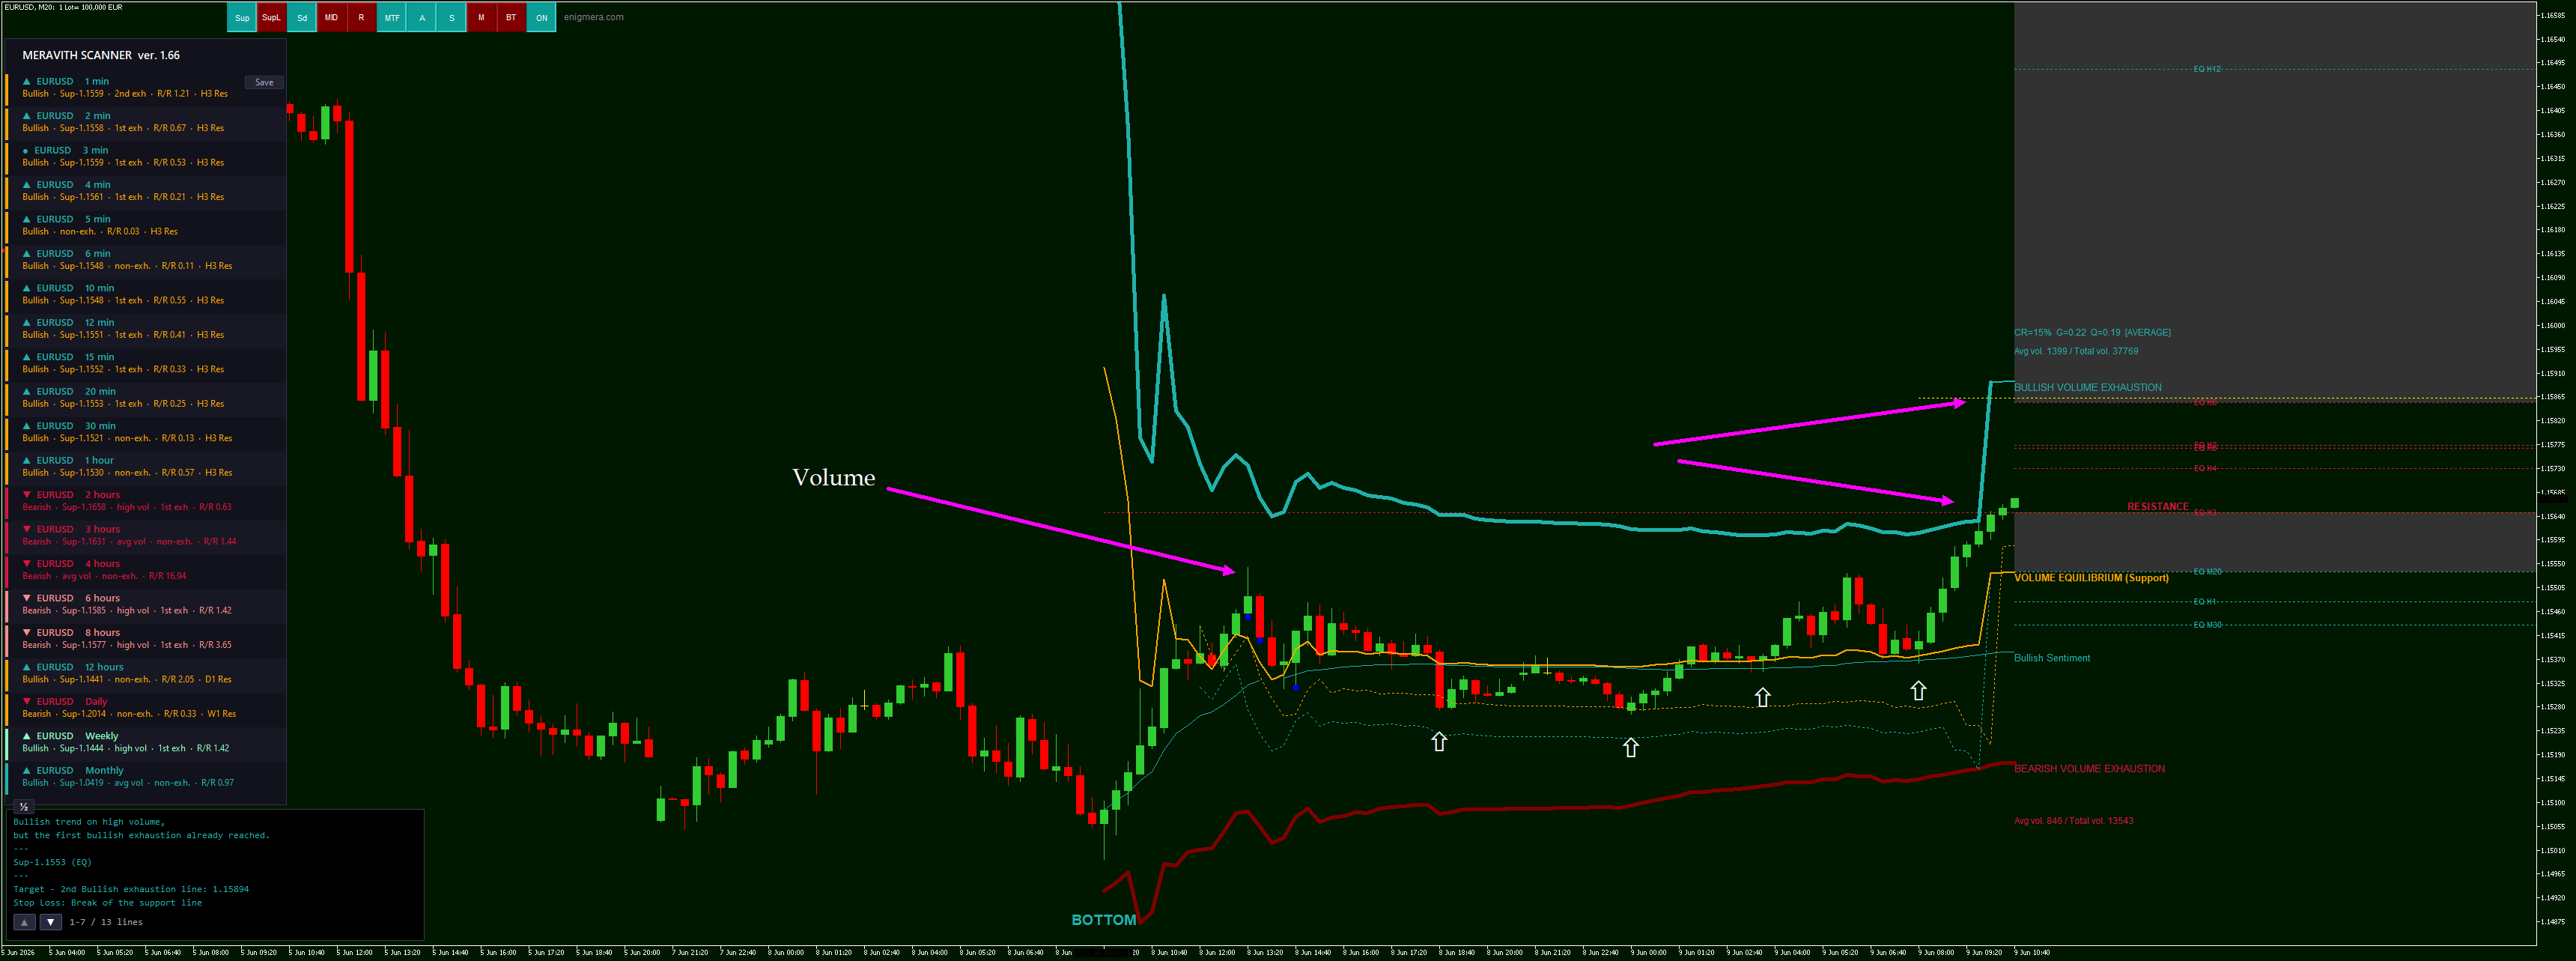
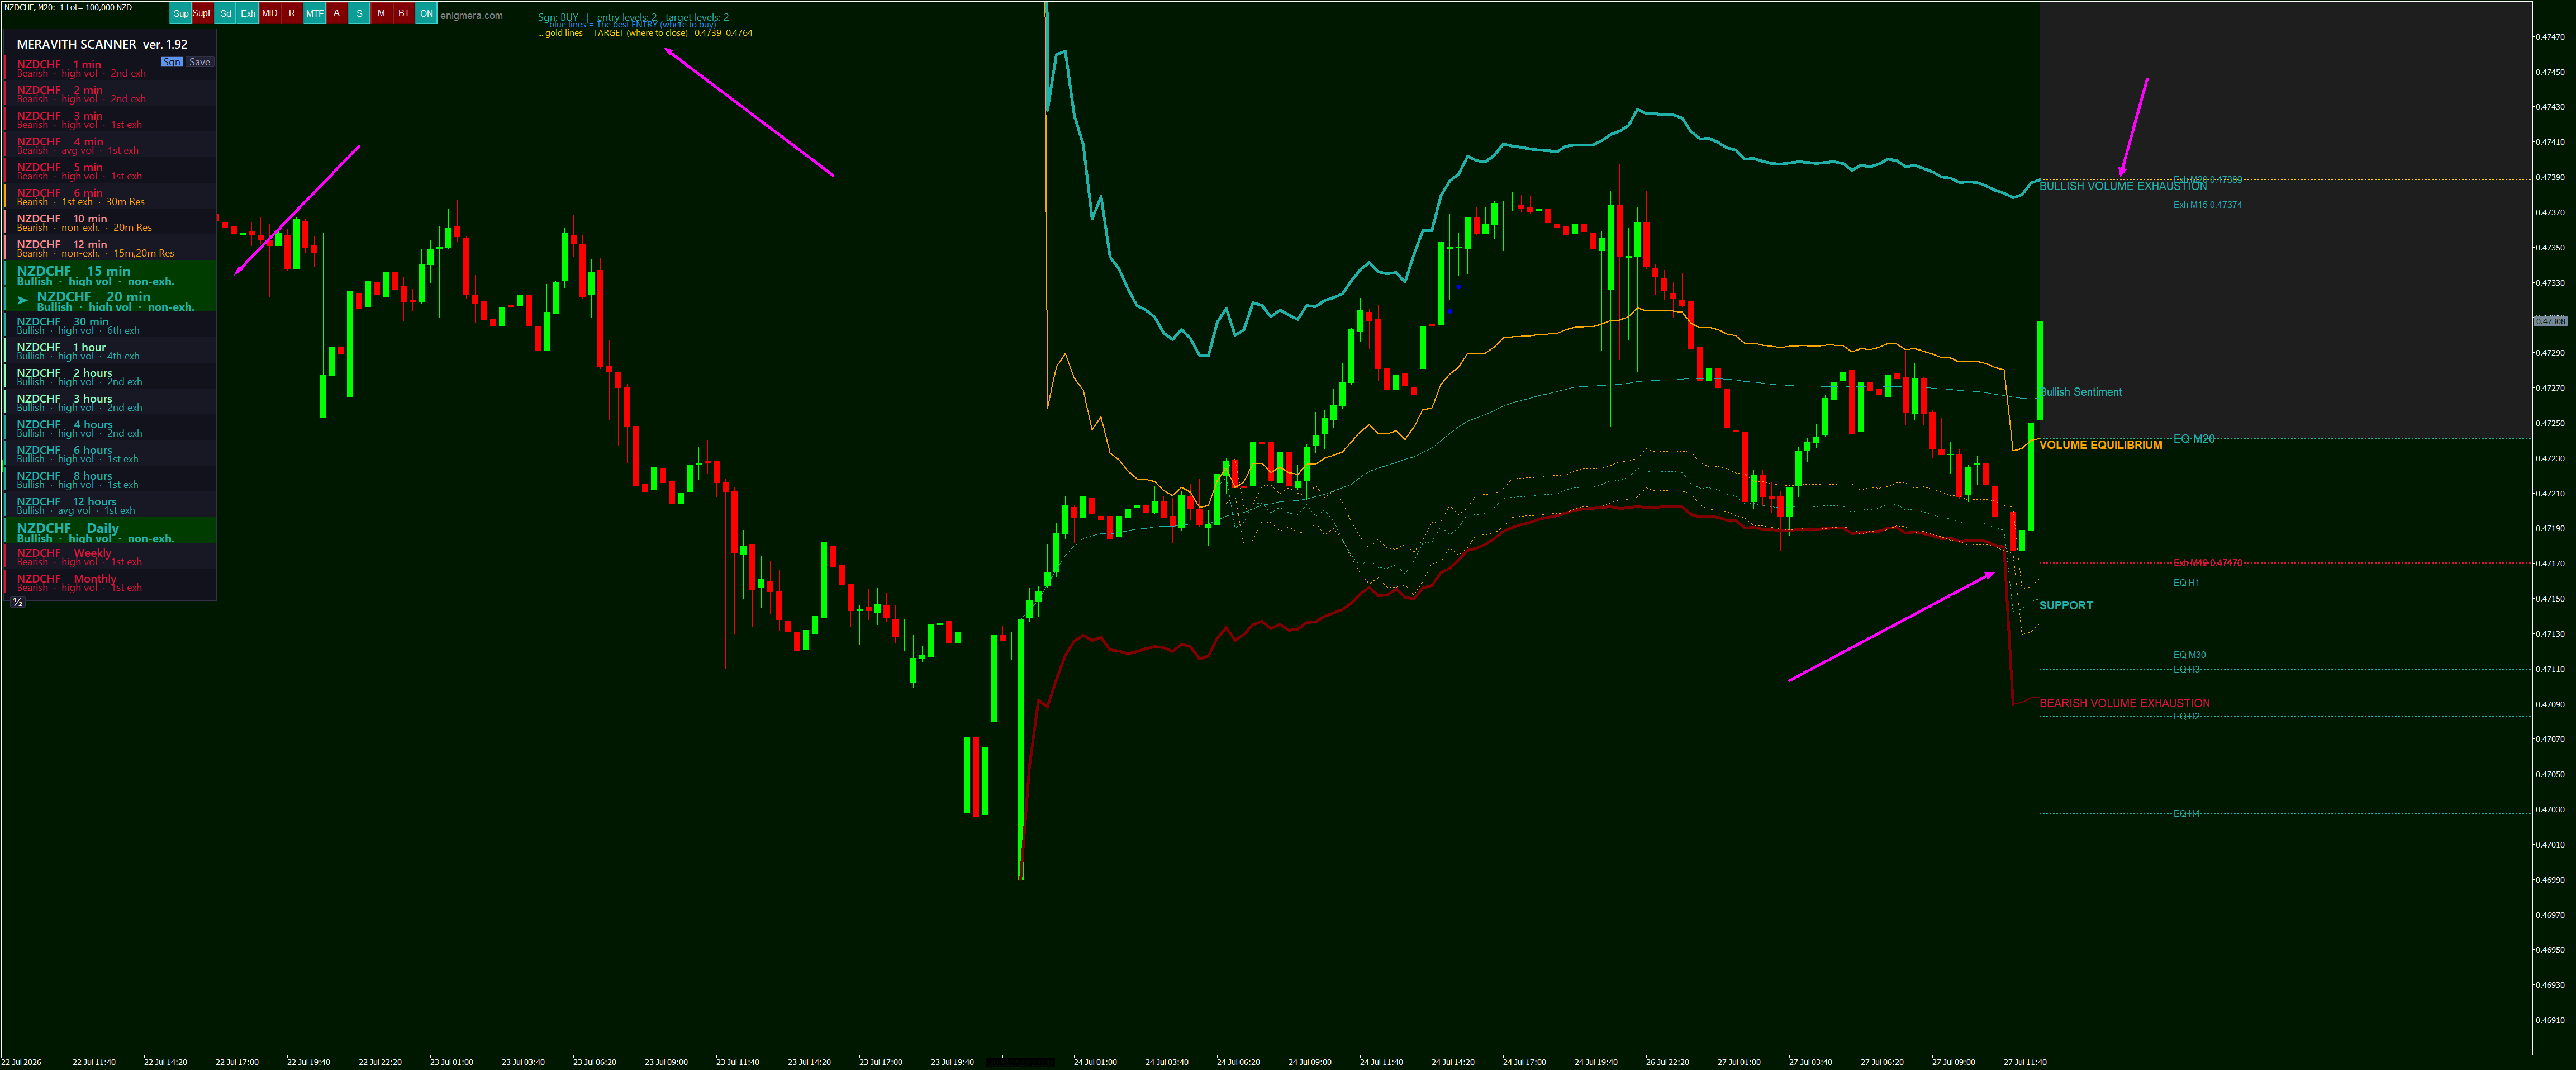
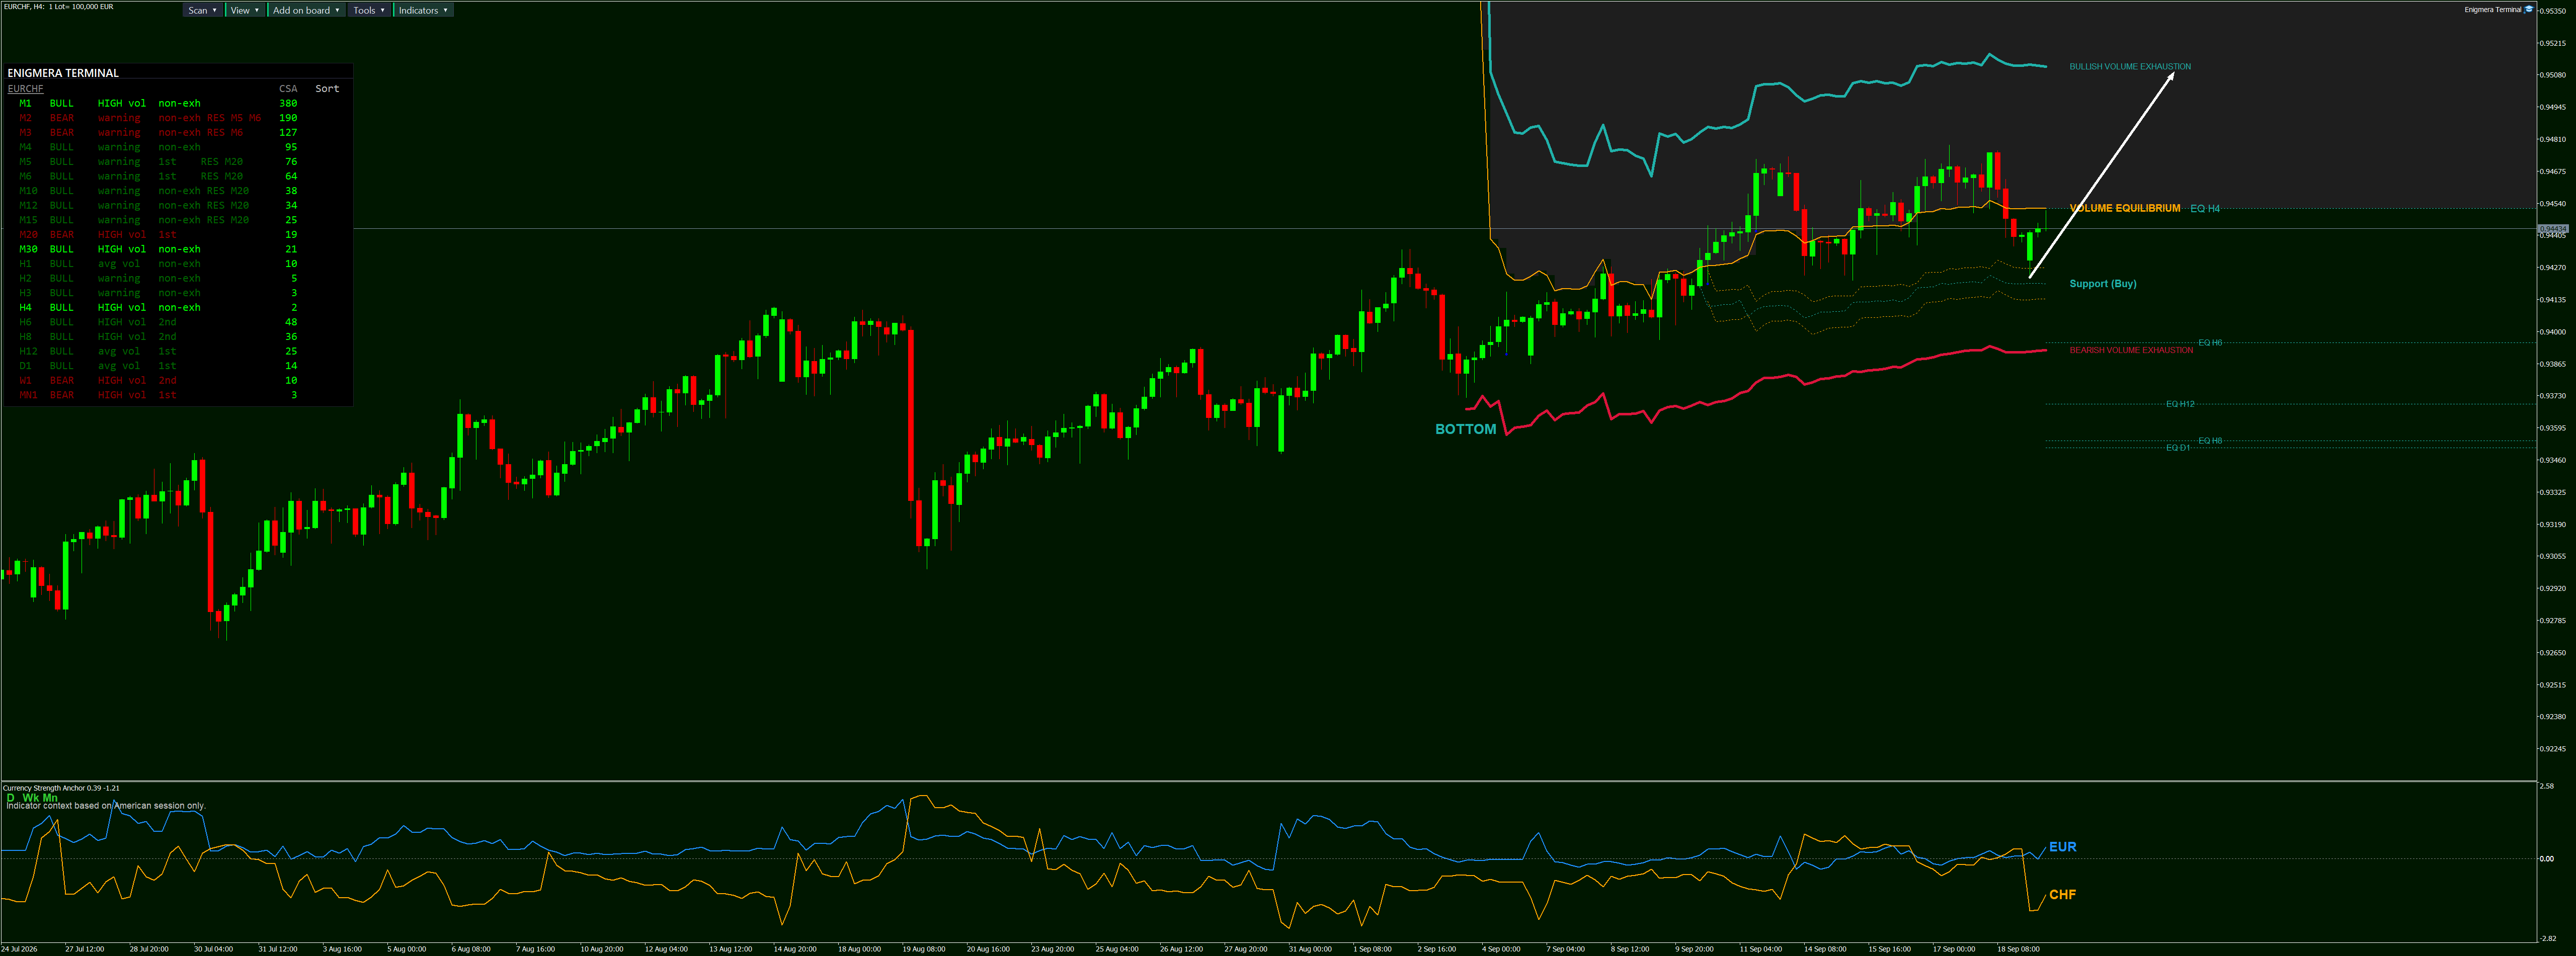
Multi-timeframe equilibrium levels, mapped with quantitative precision across every active timeframe.
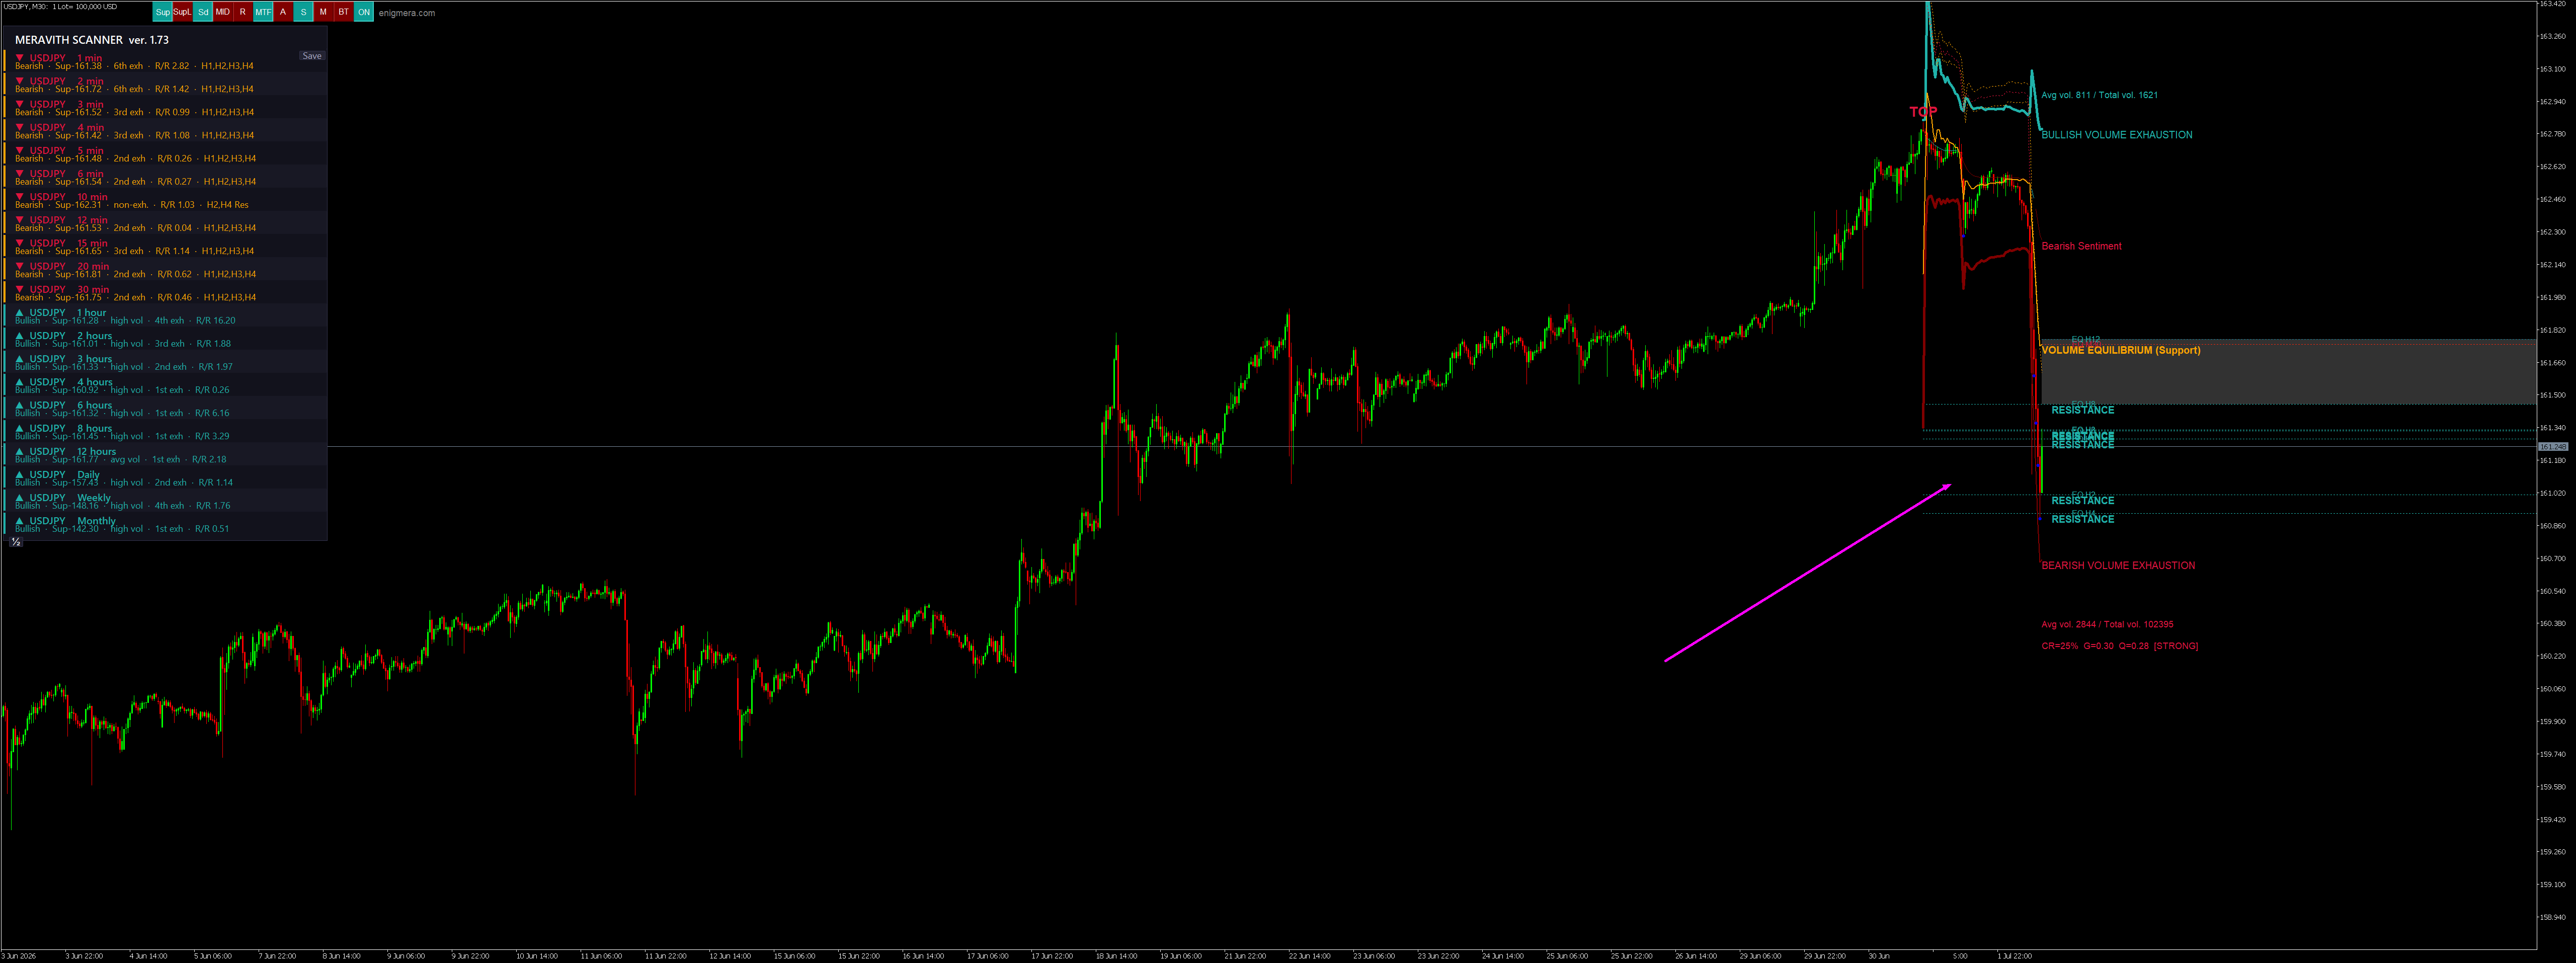
Higher-timeframe liquidity warnings, signalling when lower-timeframe momentum is approaching consequential resistance or support structures.
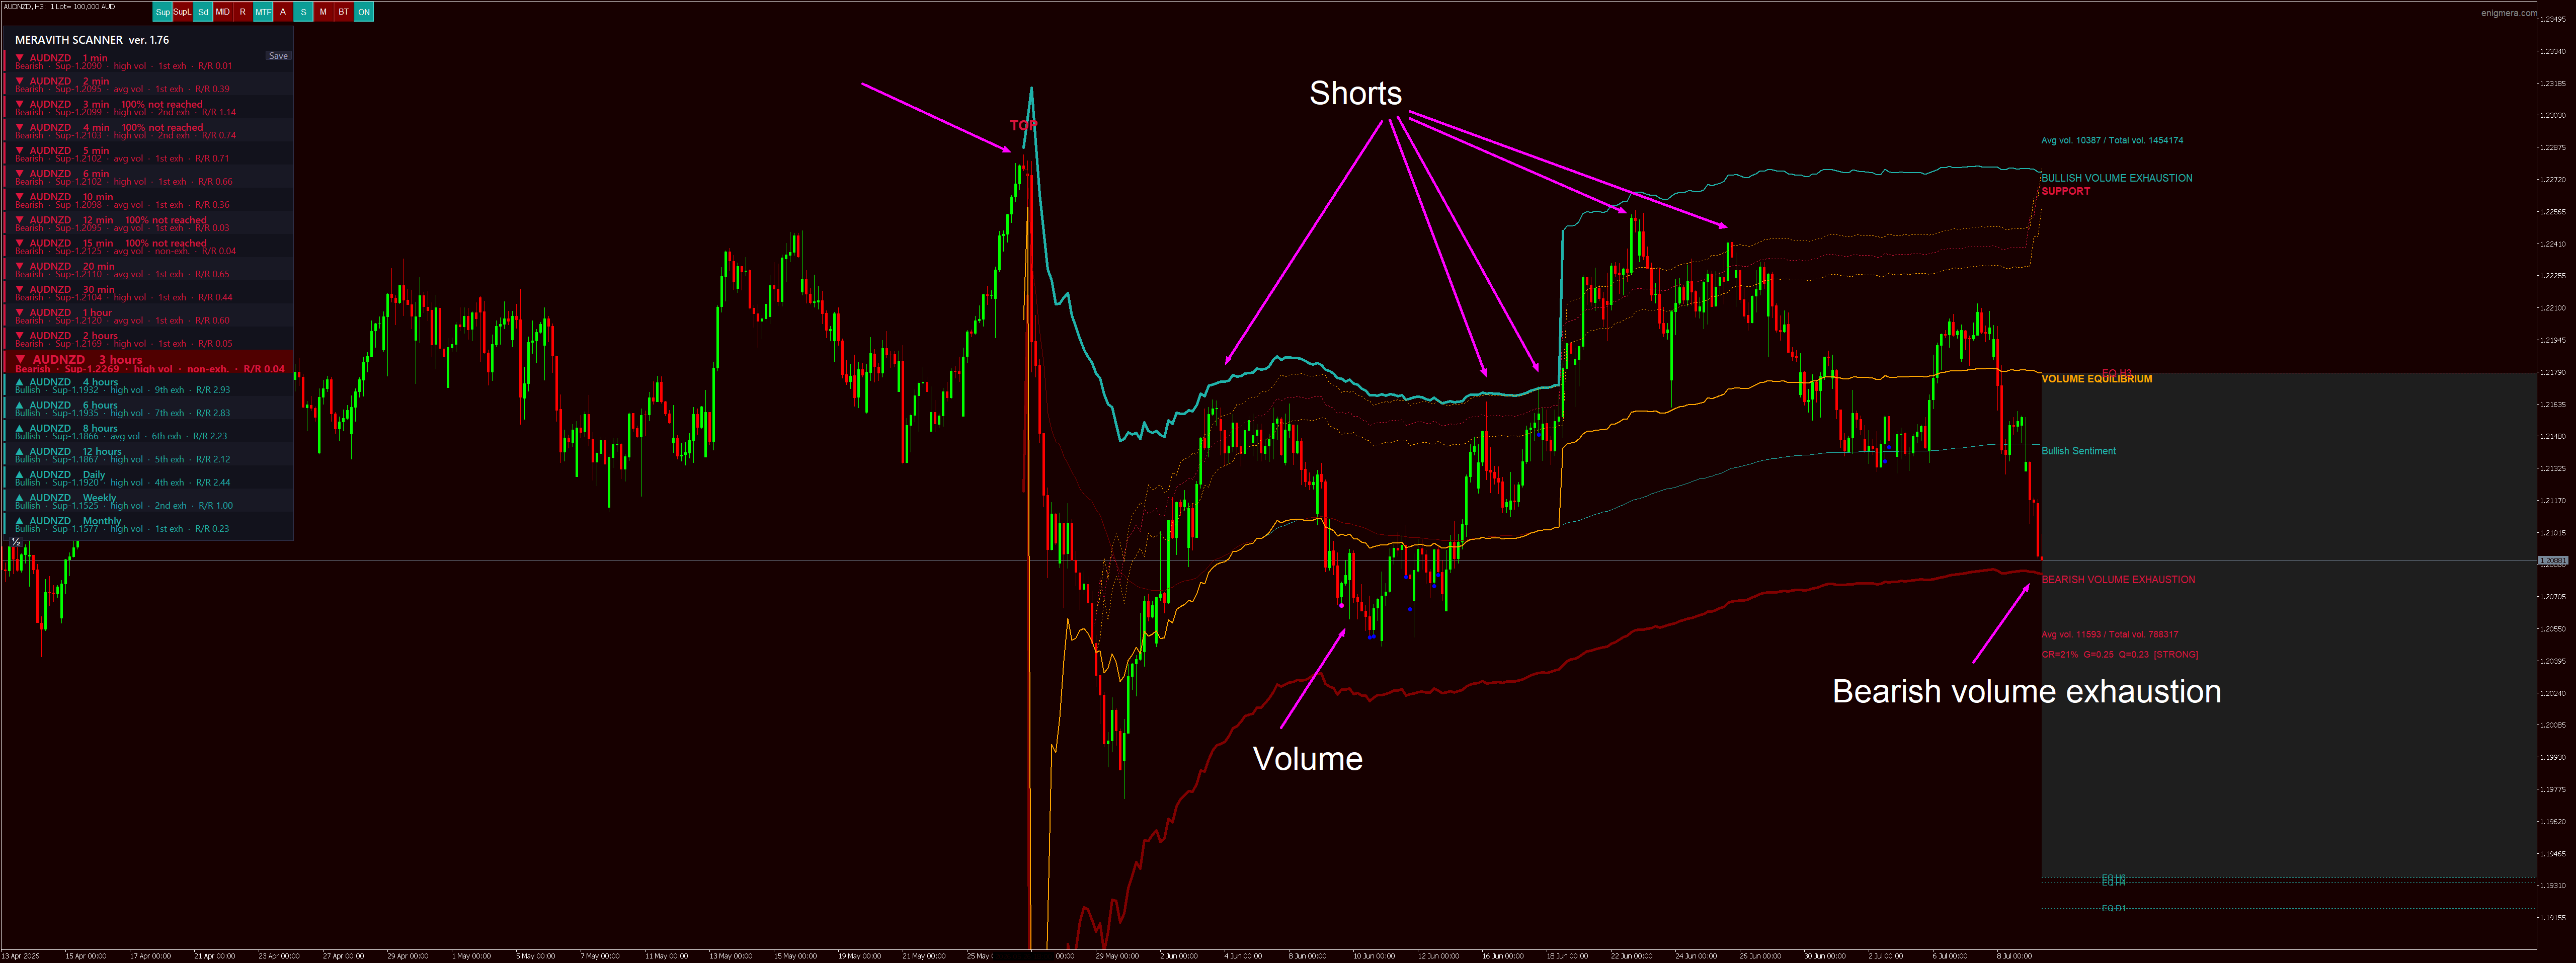
Exhaustion indicators, identifying late-stage trend conditions before structural shifts occur.
Volume diagnostics with two-sided pressure detection, distinguishing genuine participation from misleading volume profiles.
This depth of liquidity insight is not available in standard charting environments and forms the analytical core of every MERAVITH workflow.
Full-Market Scanning Capability
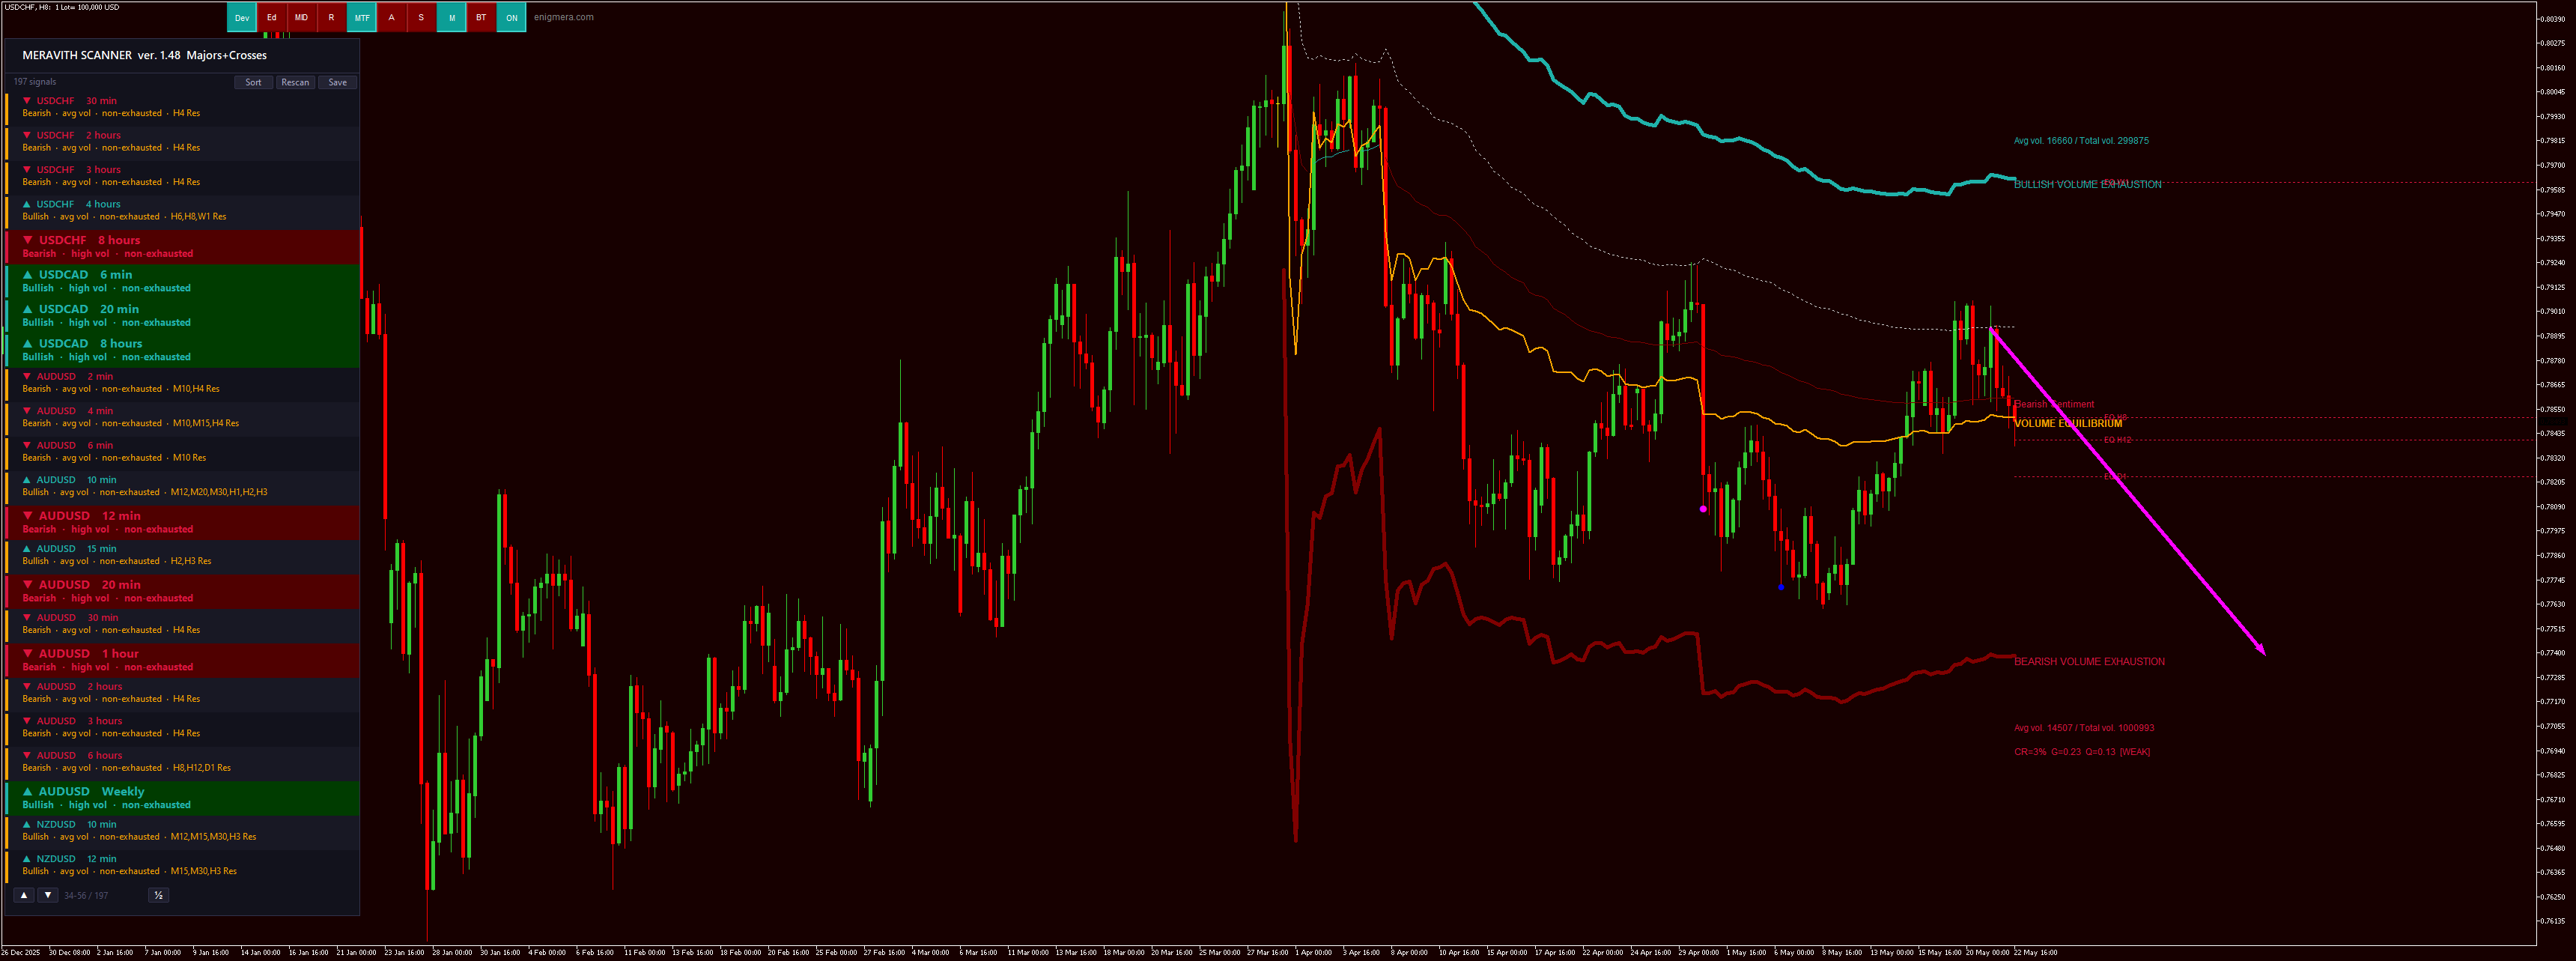
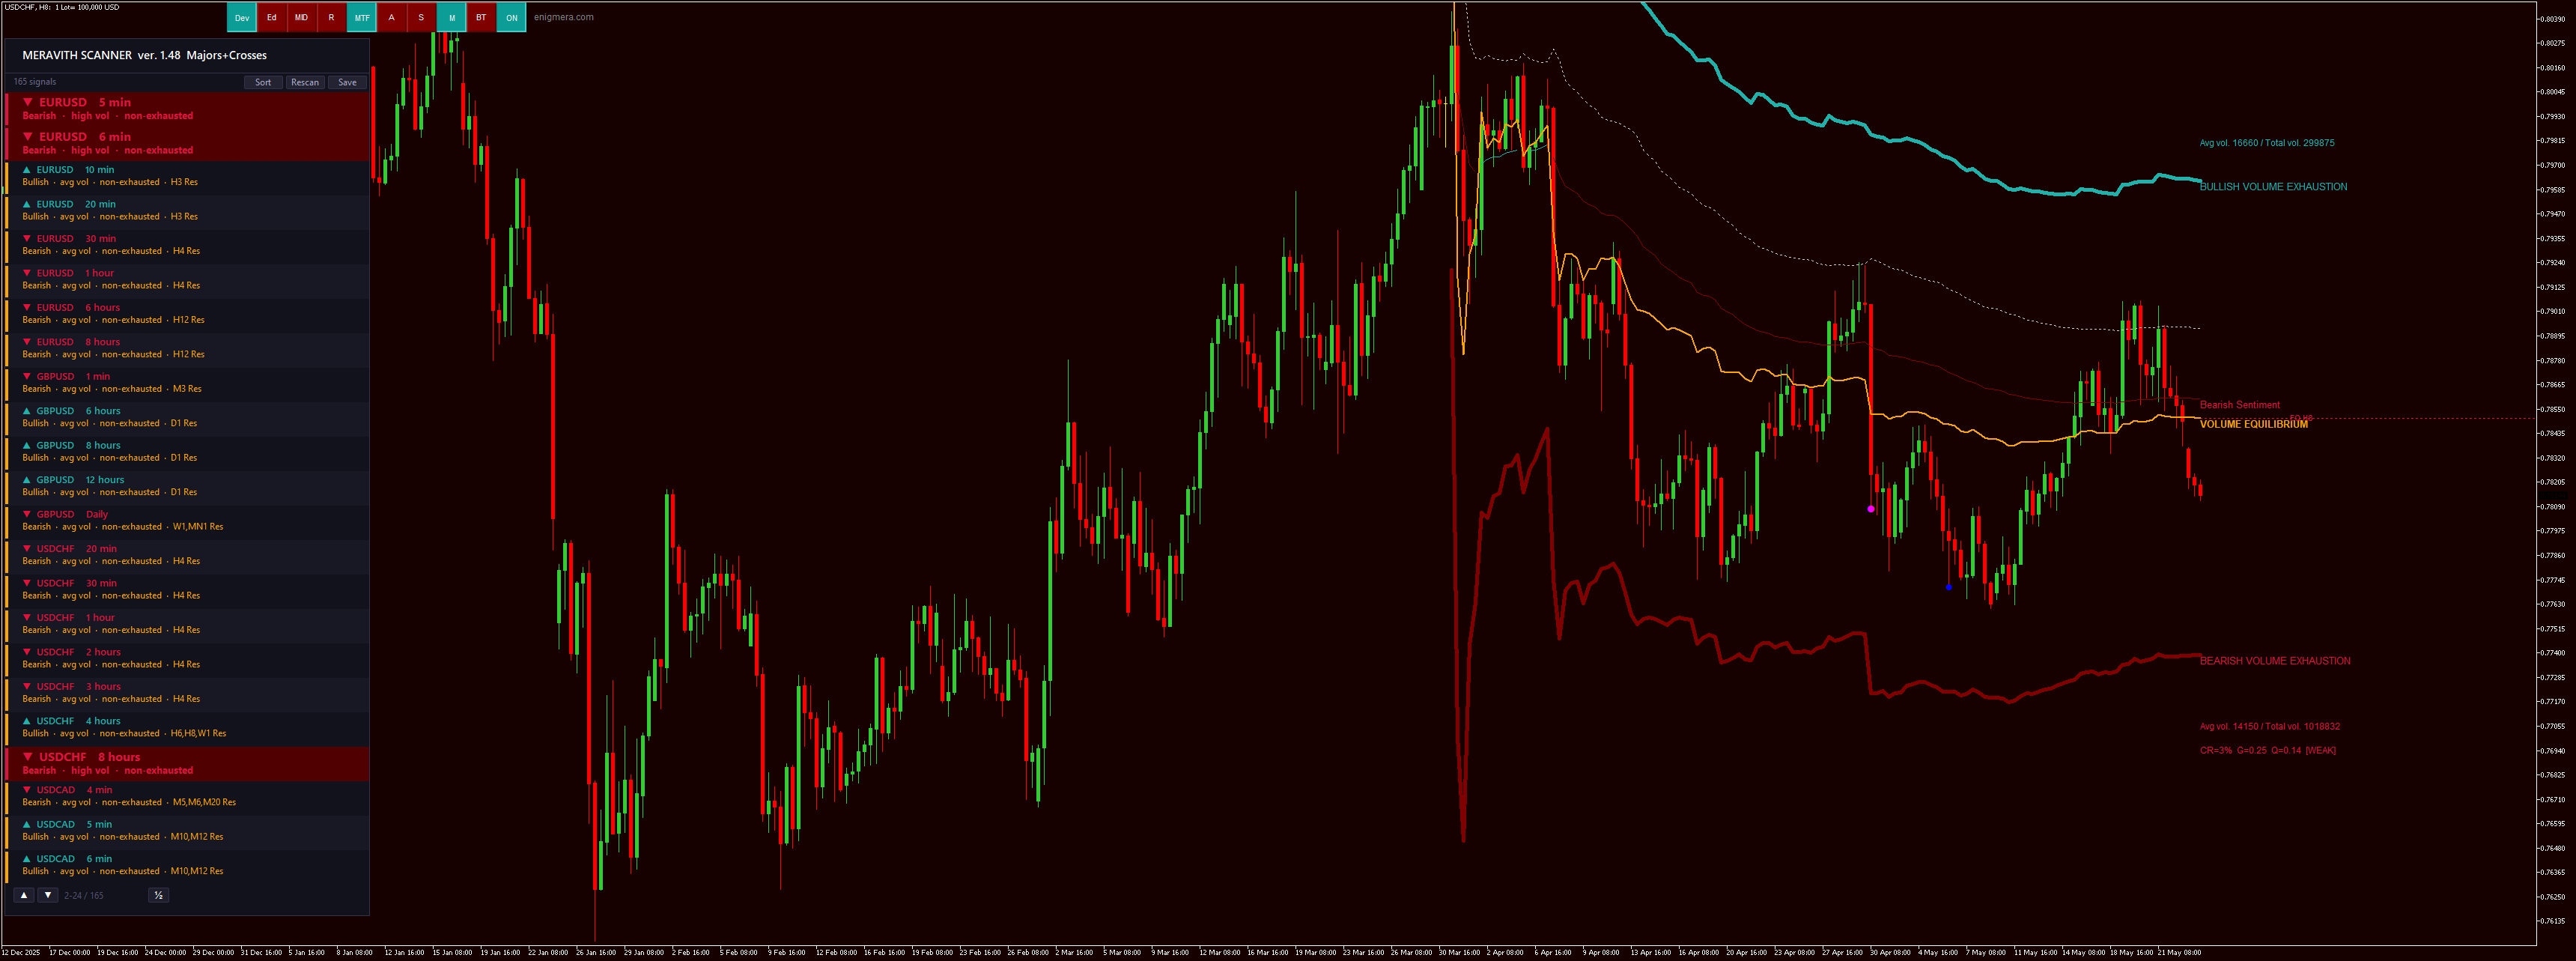
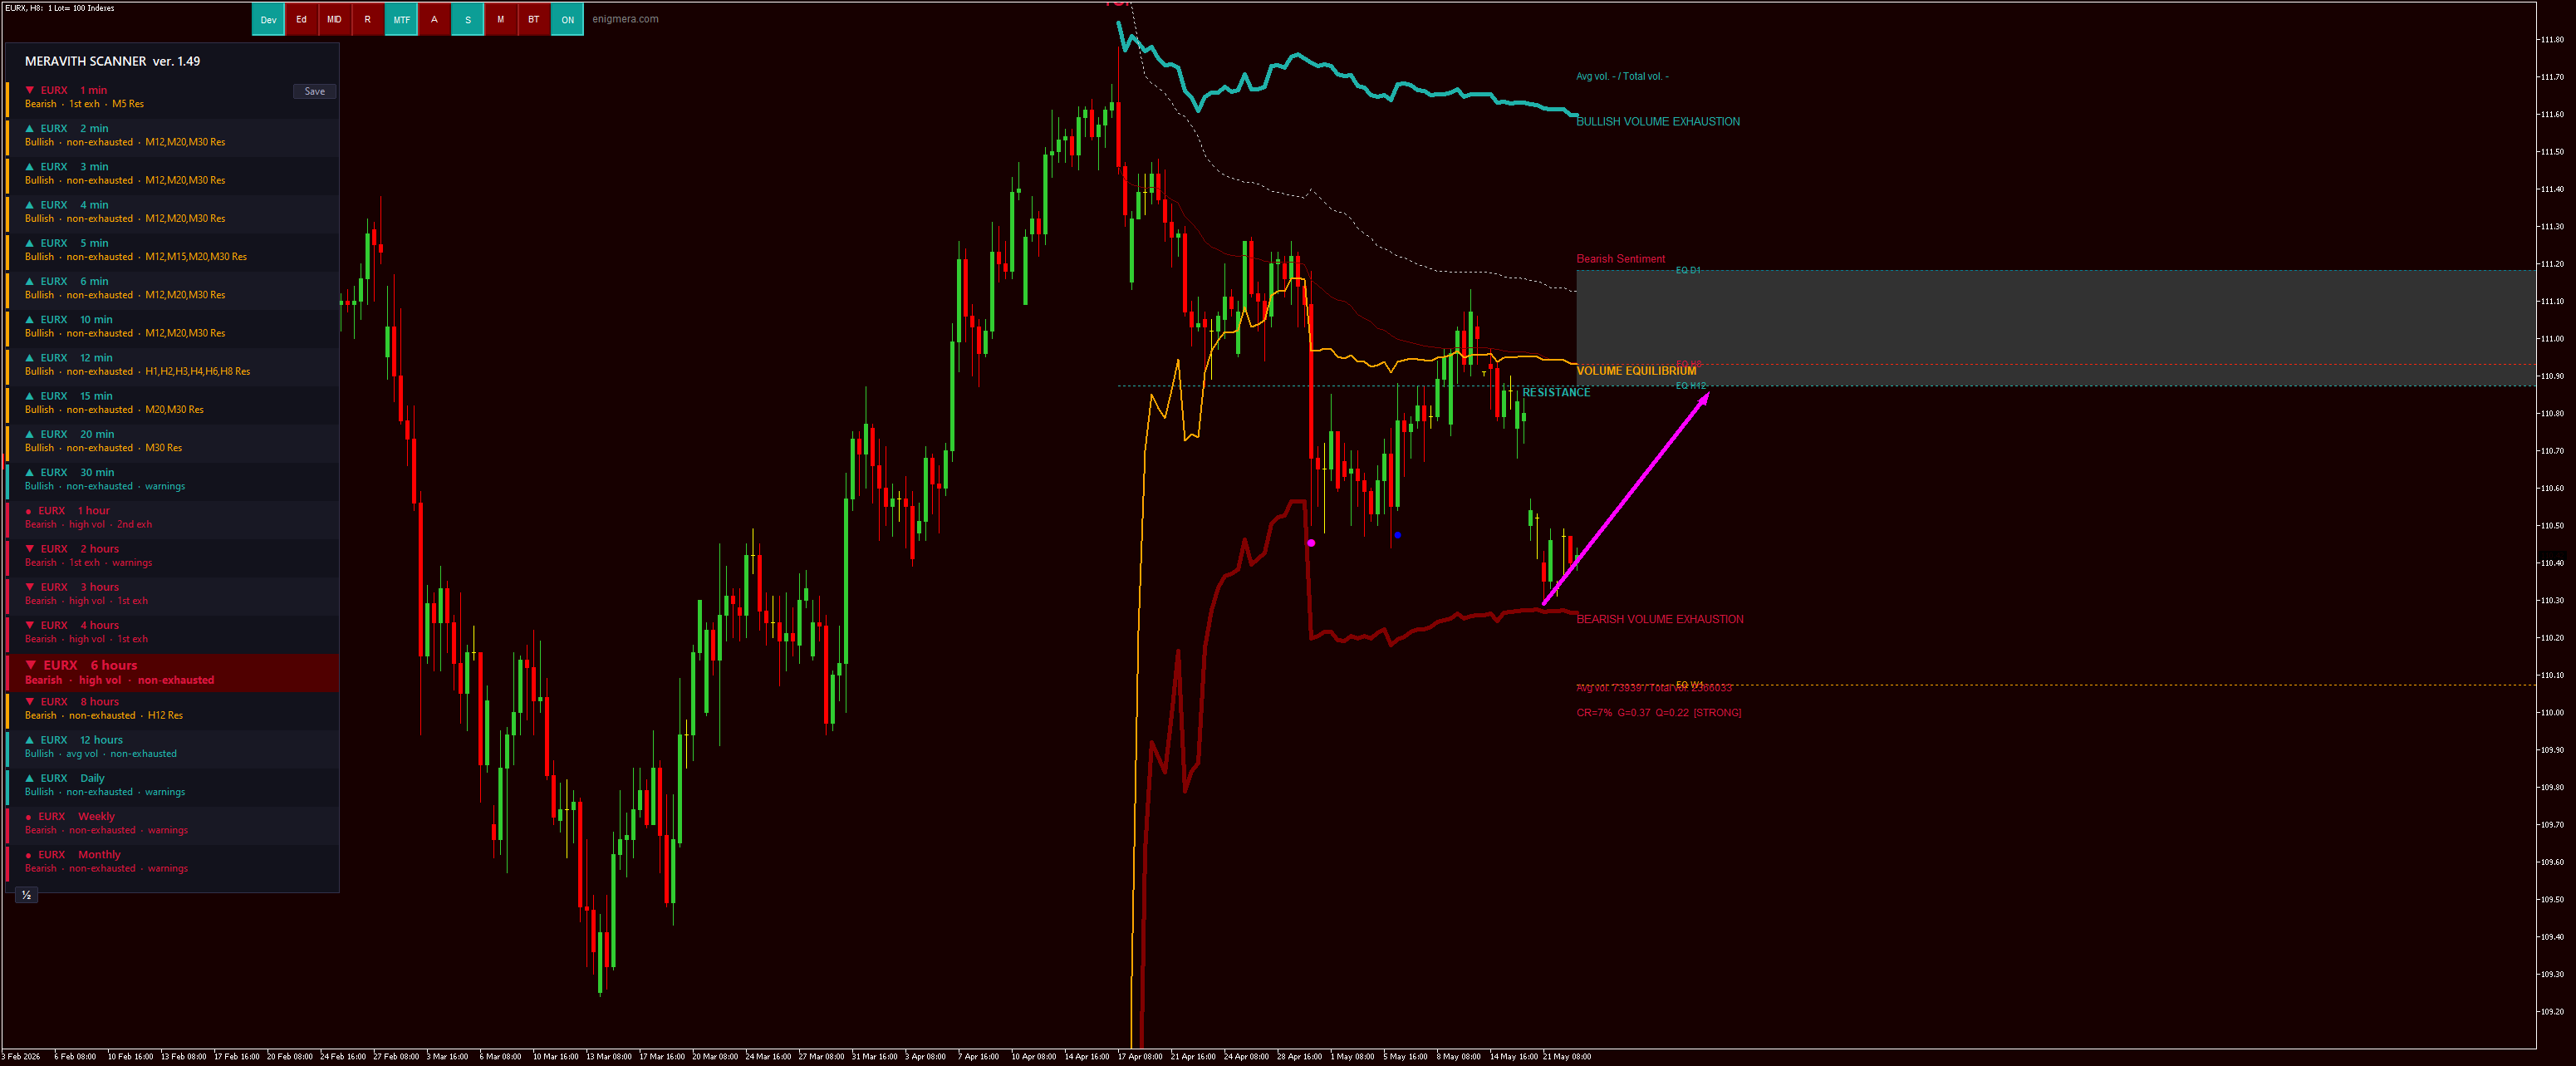
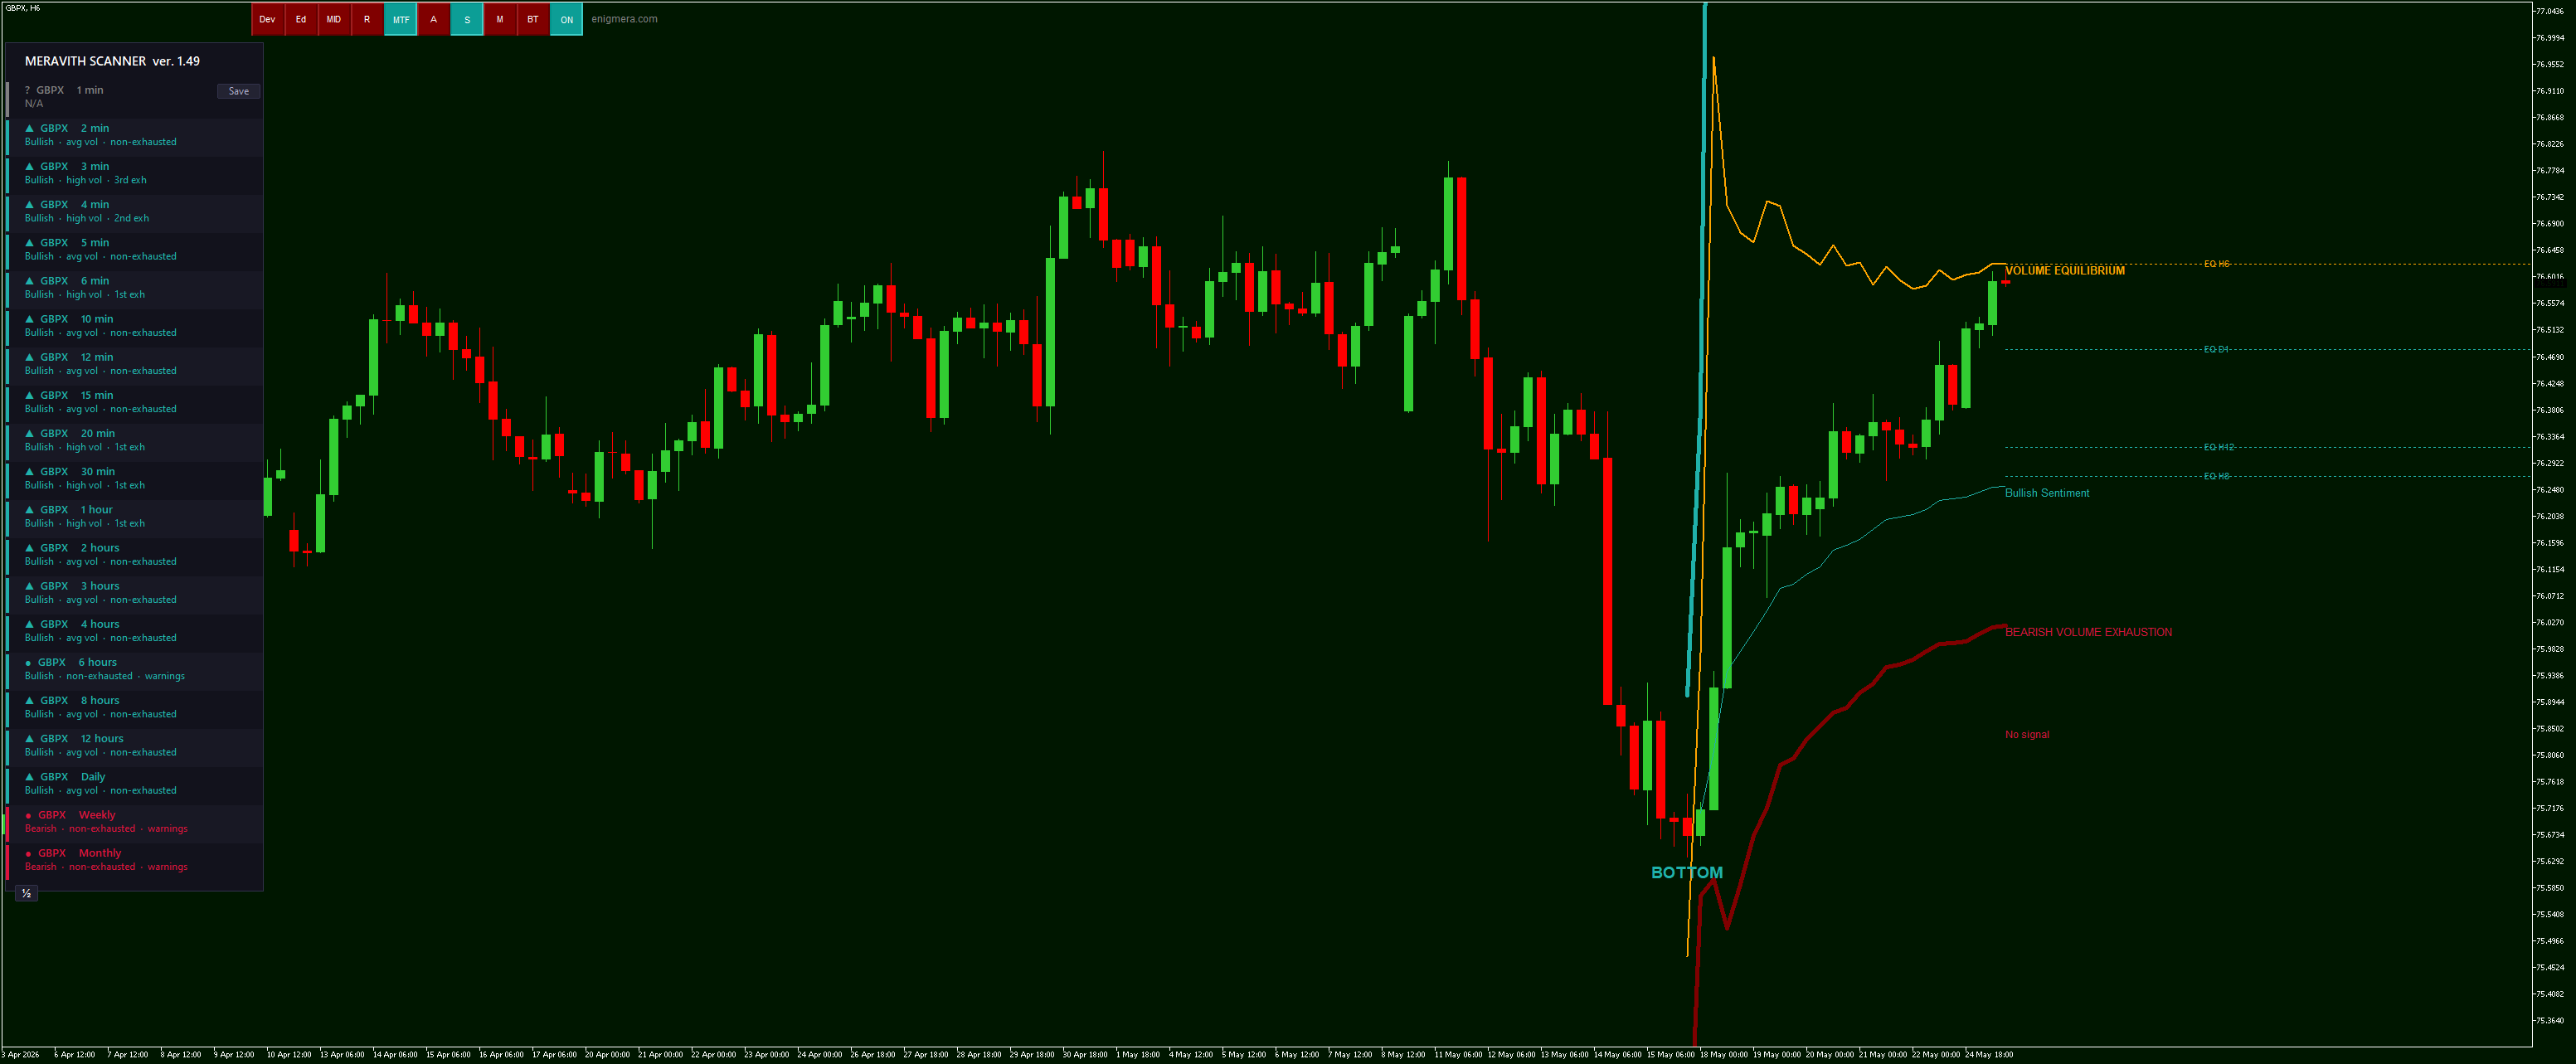
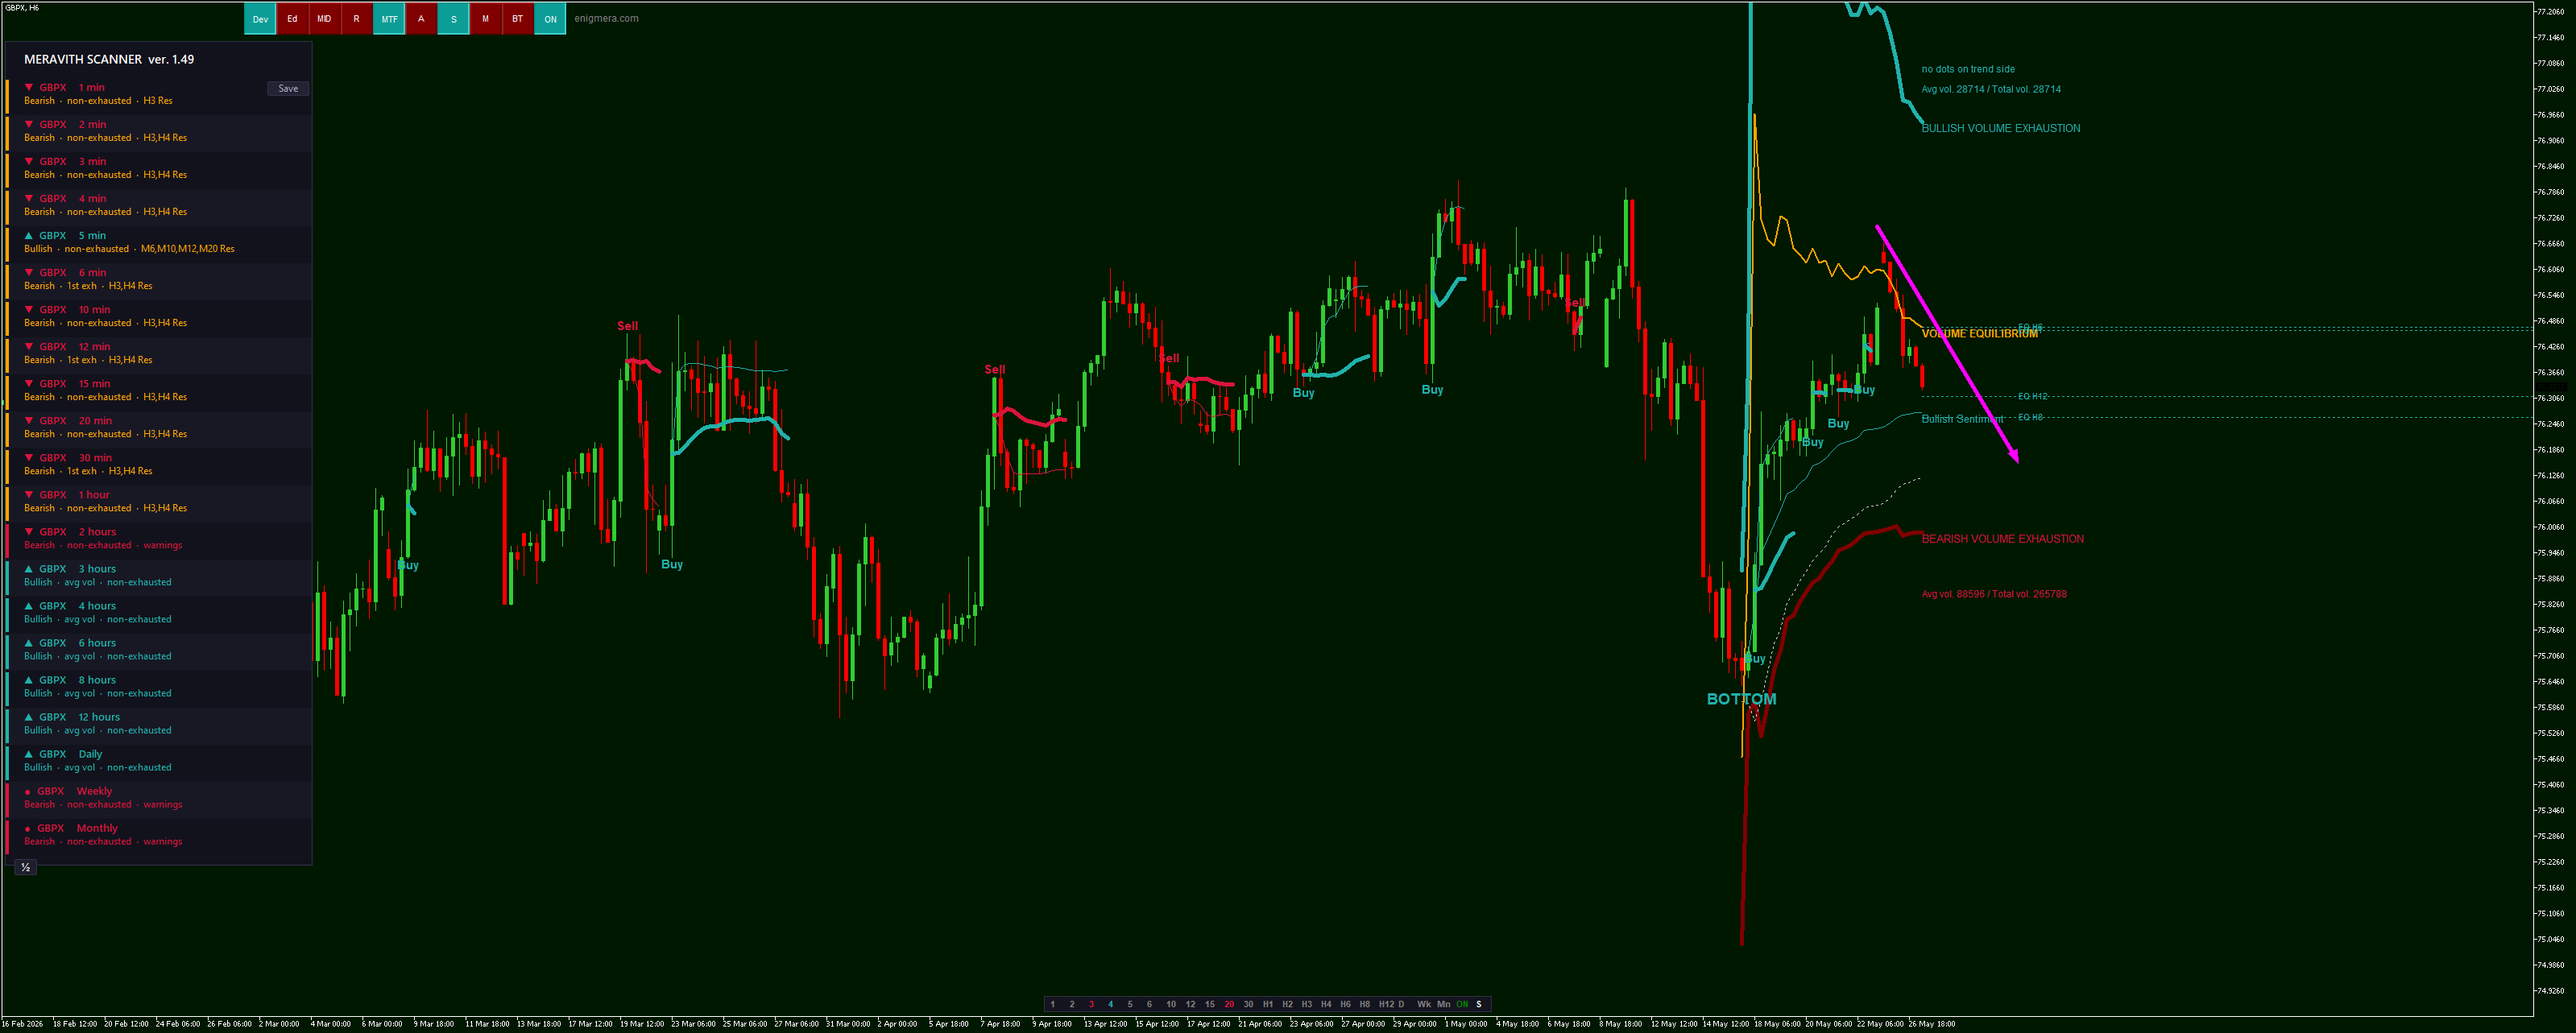
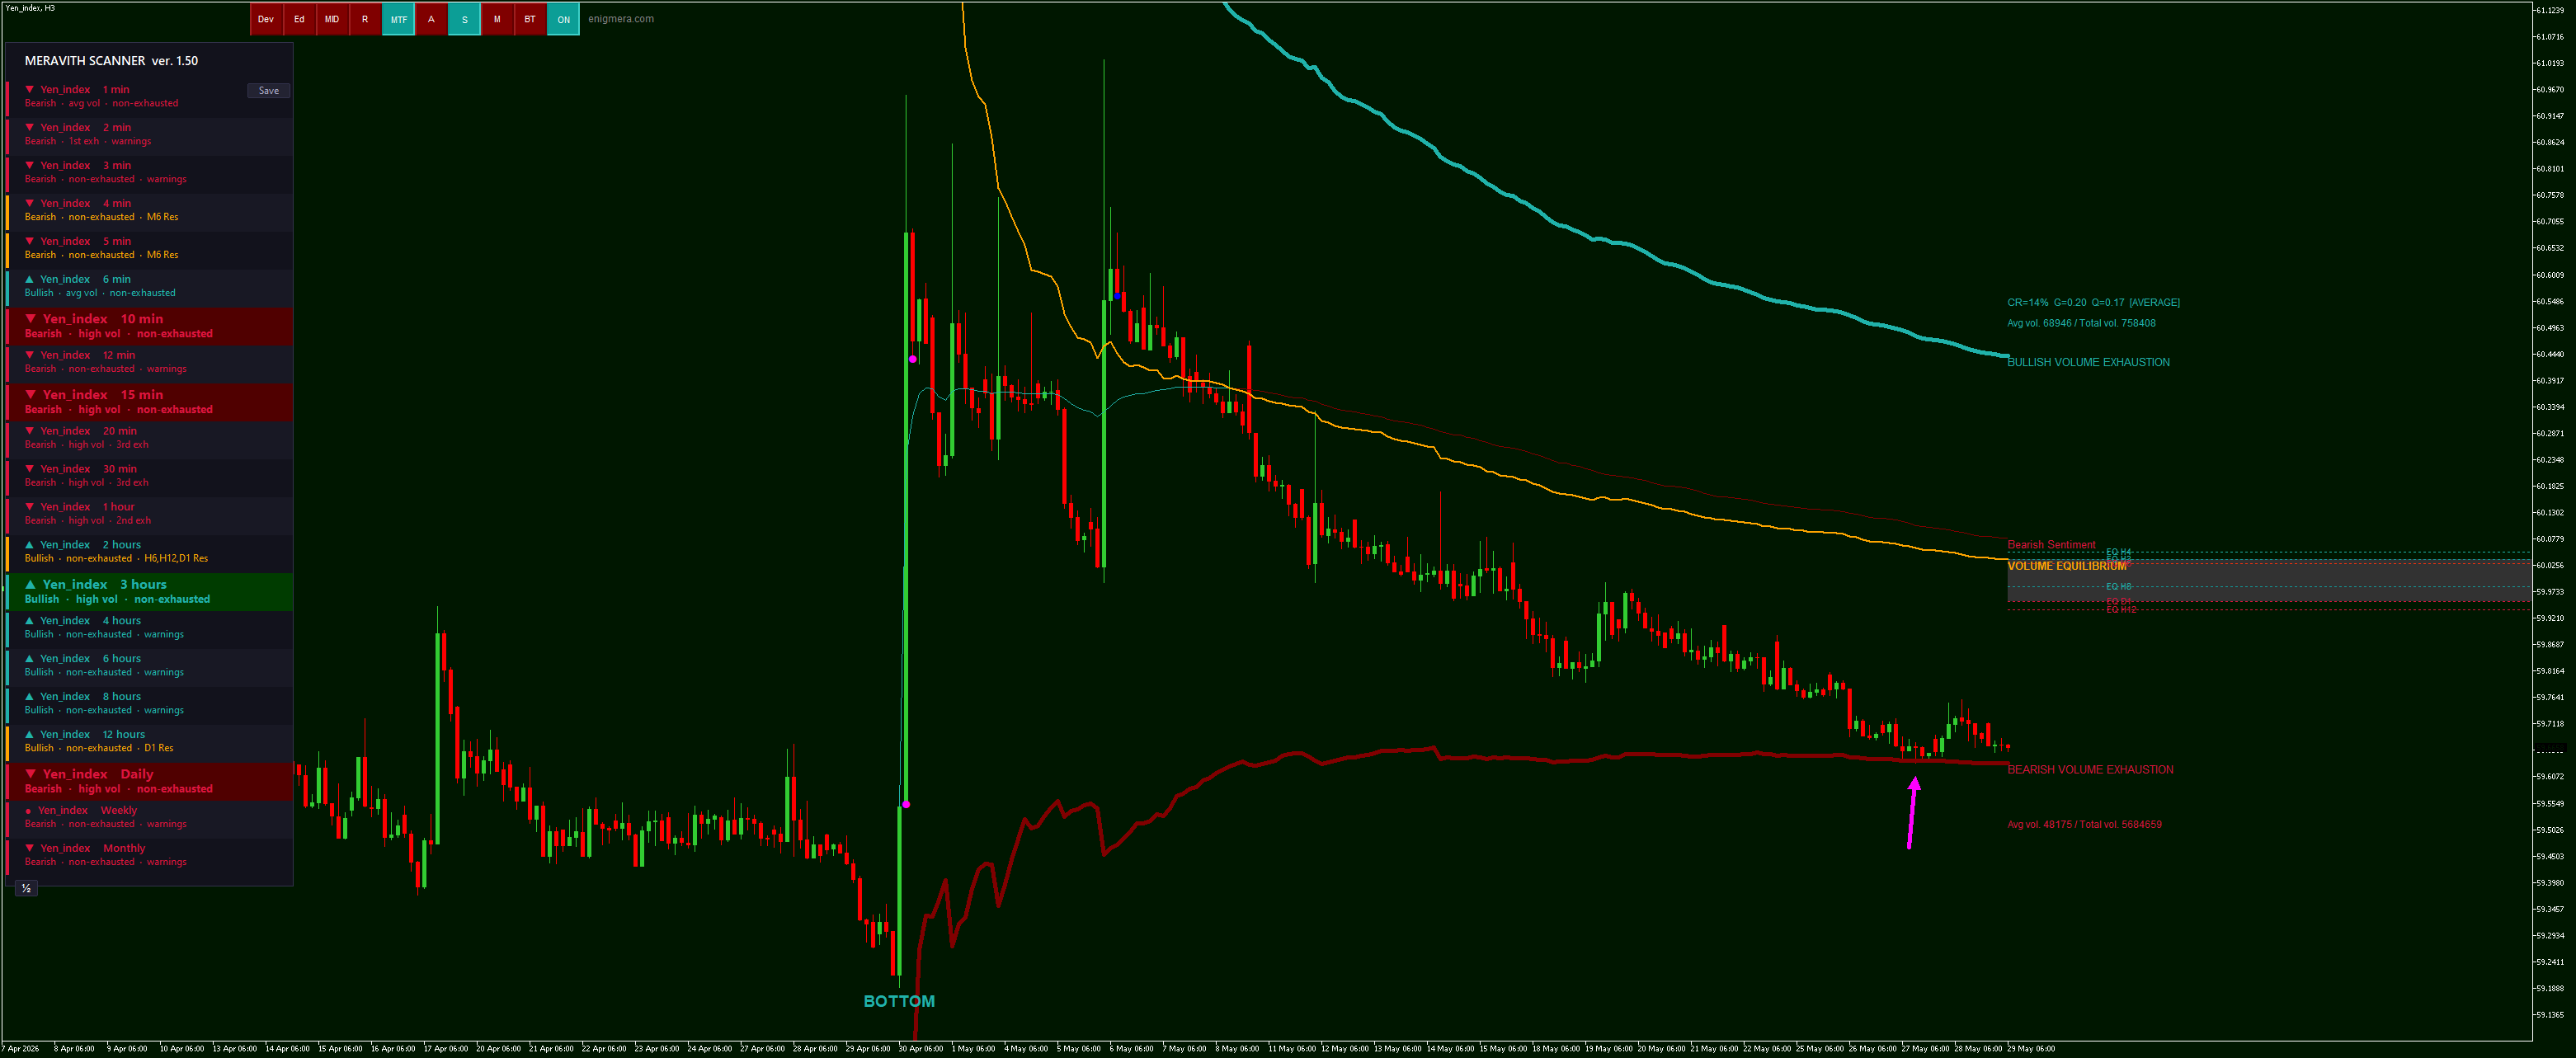
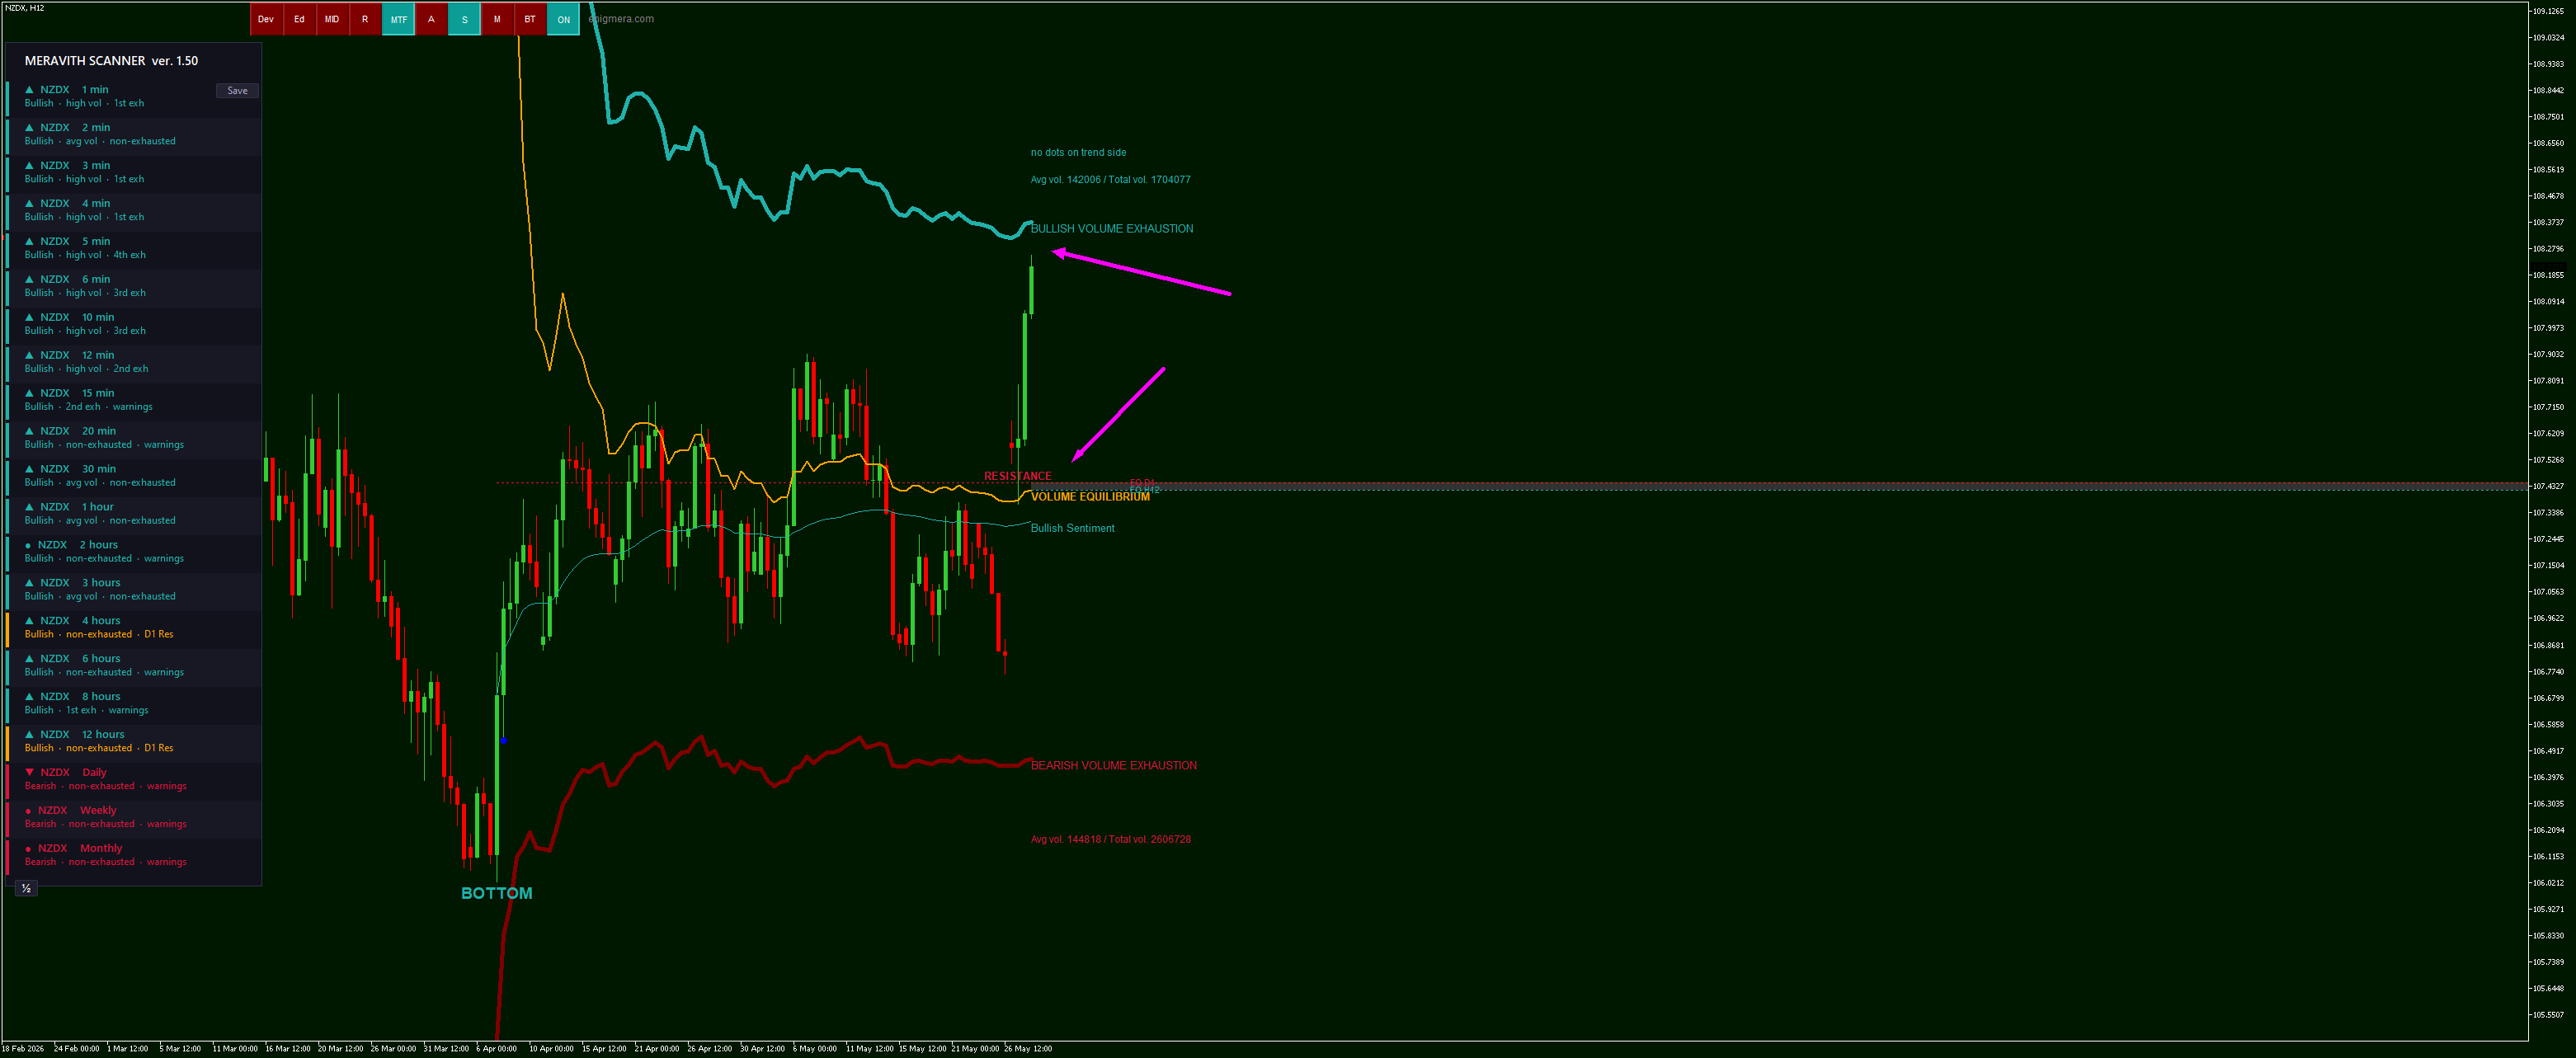
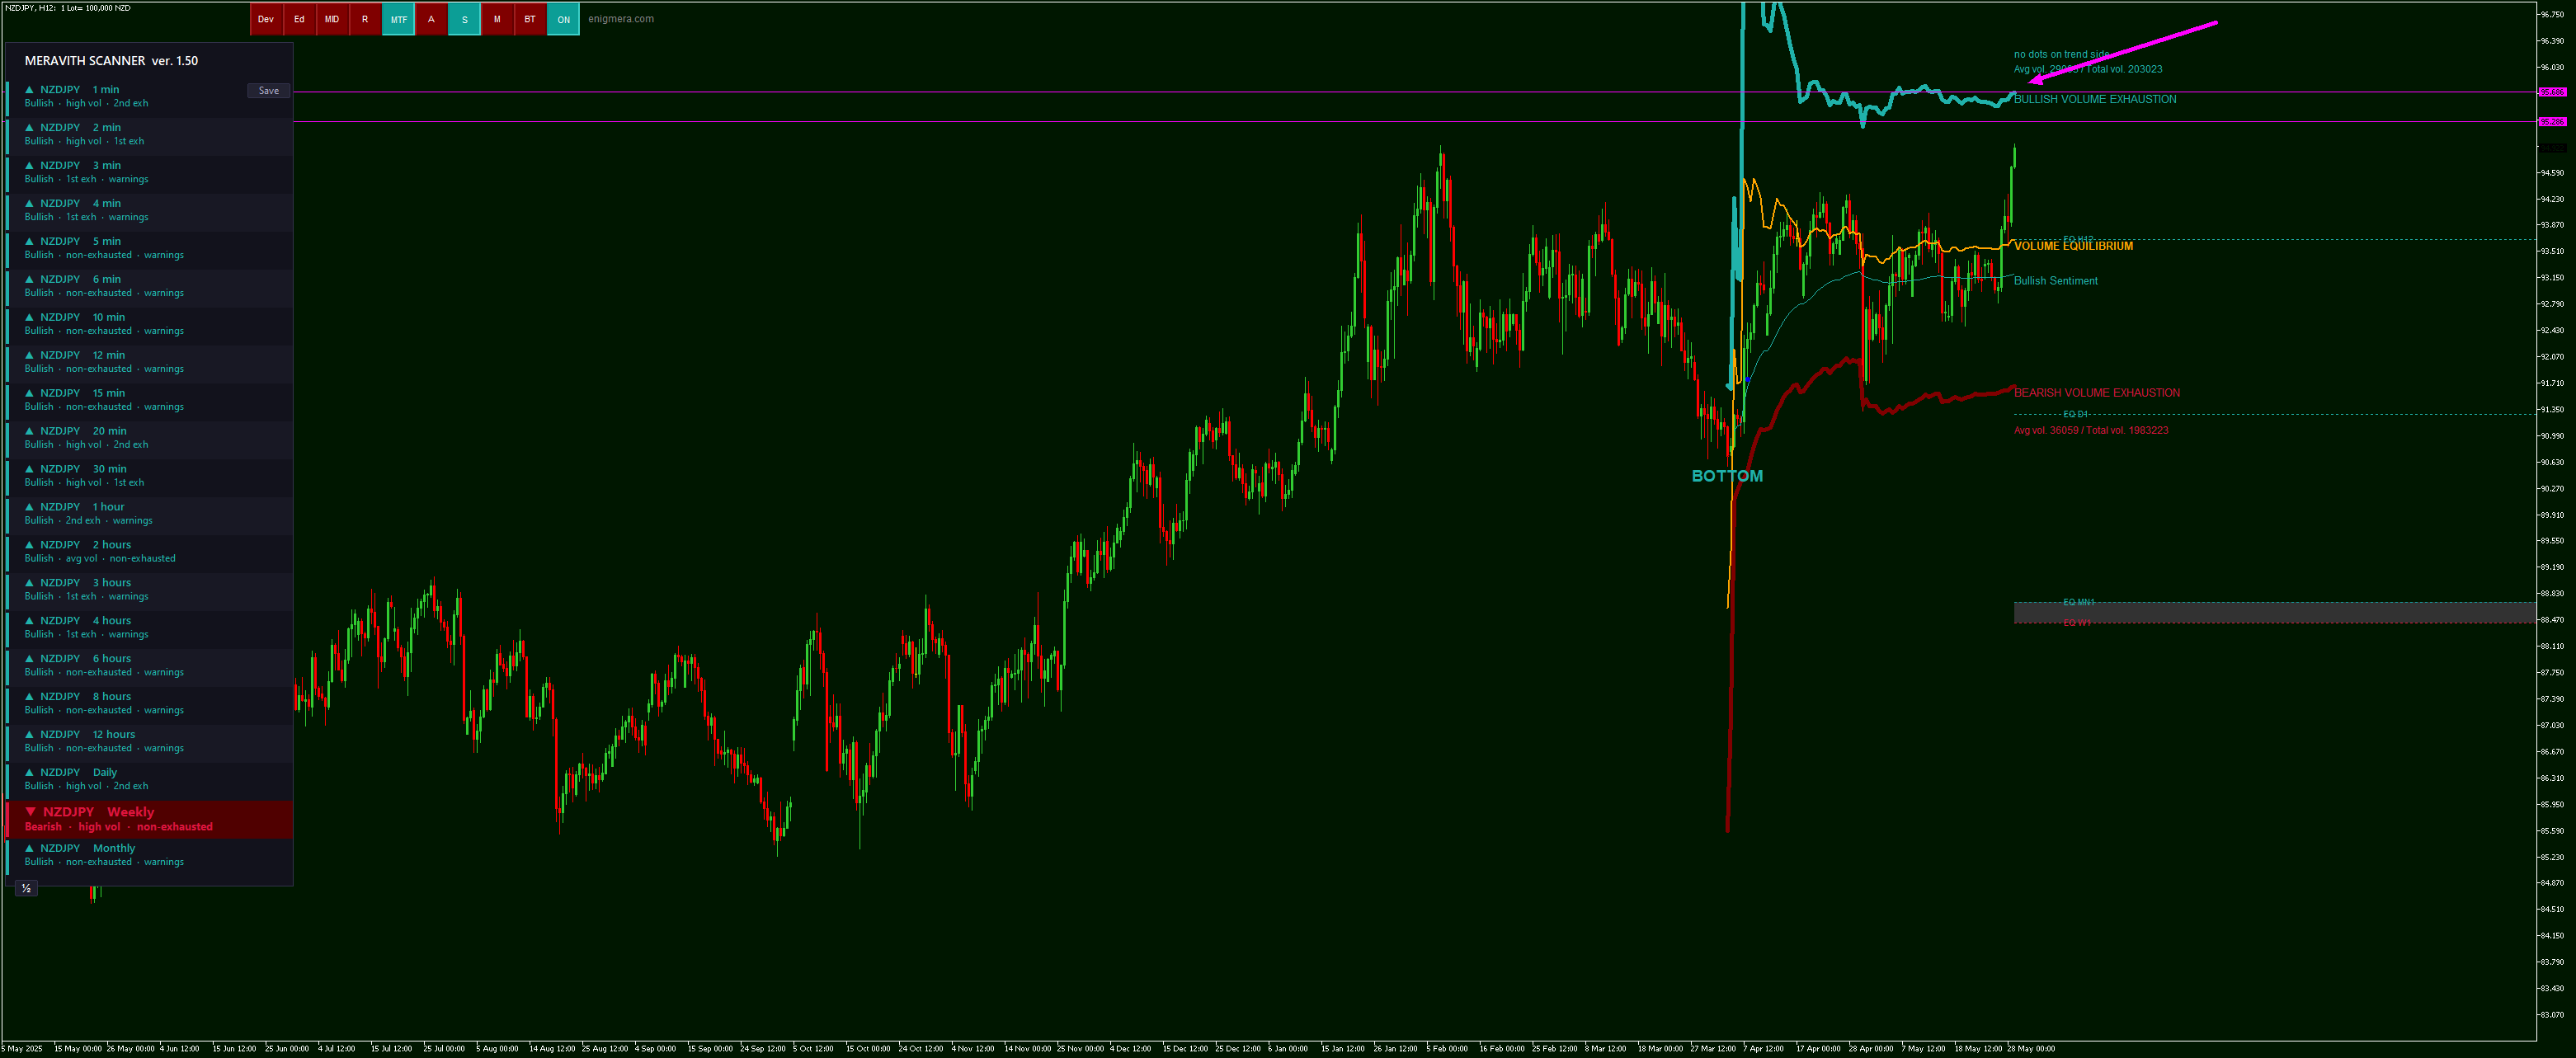
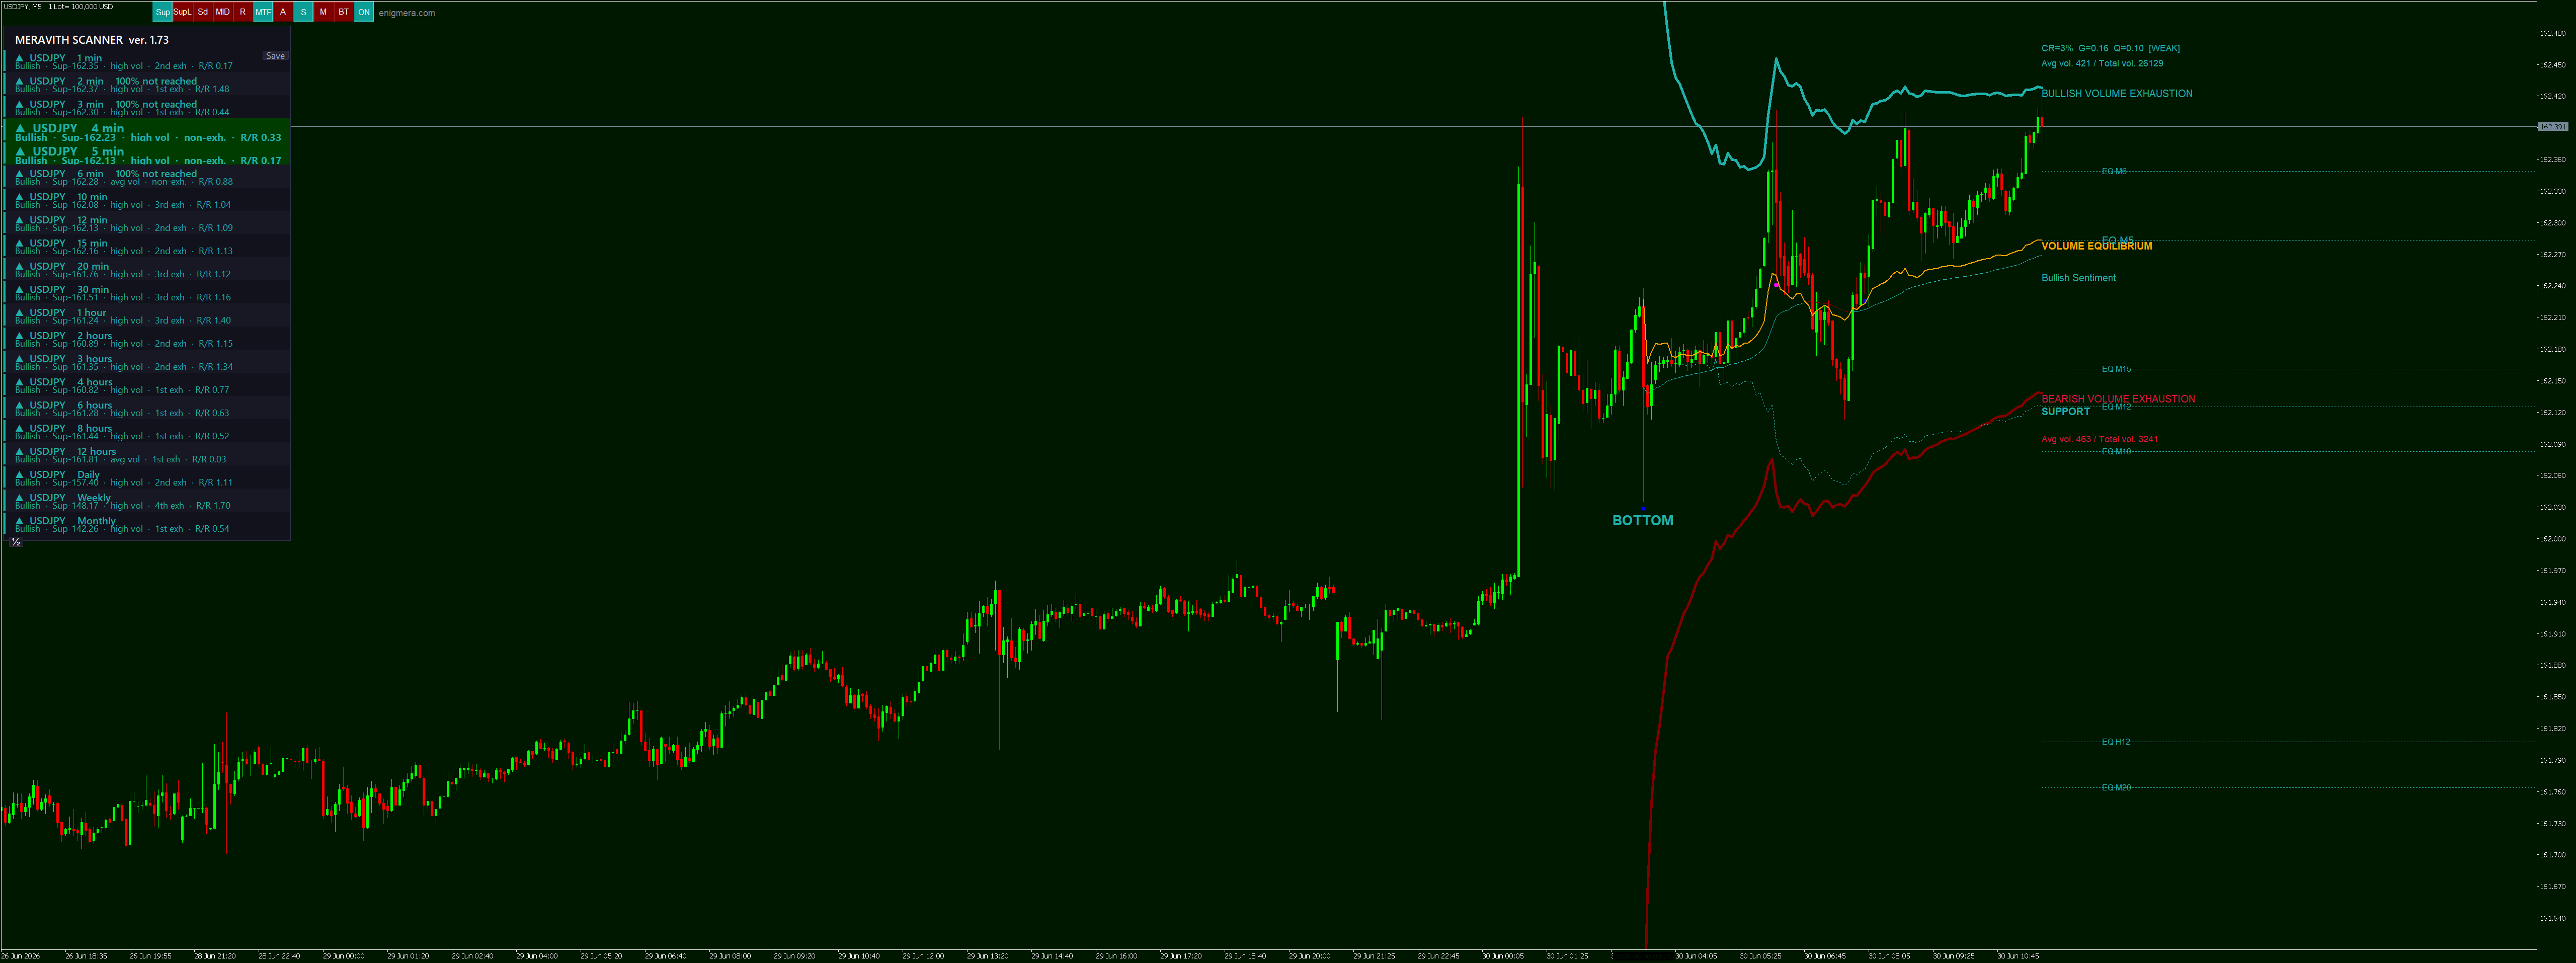
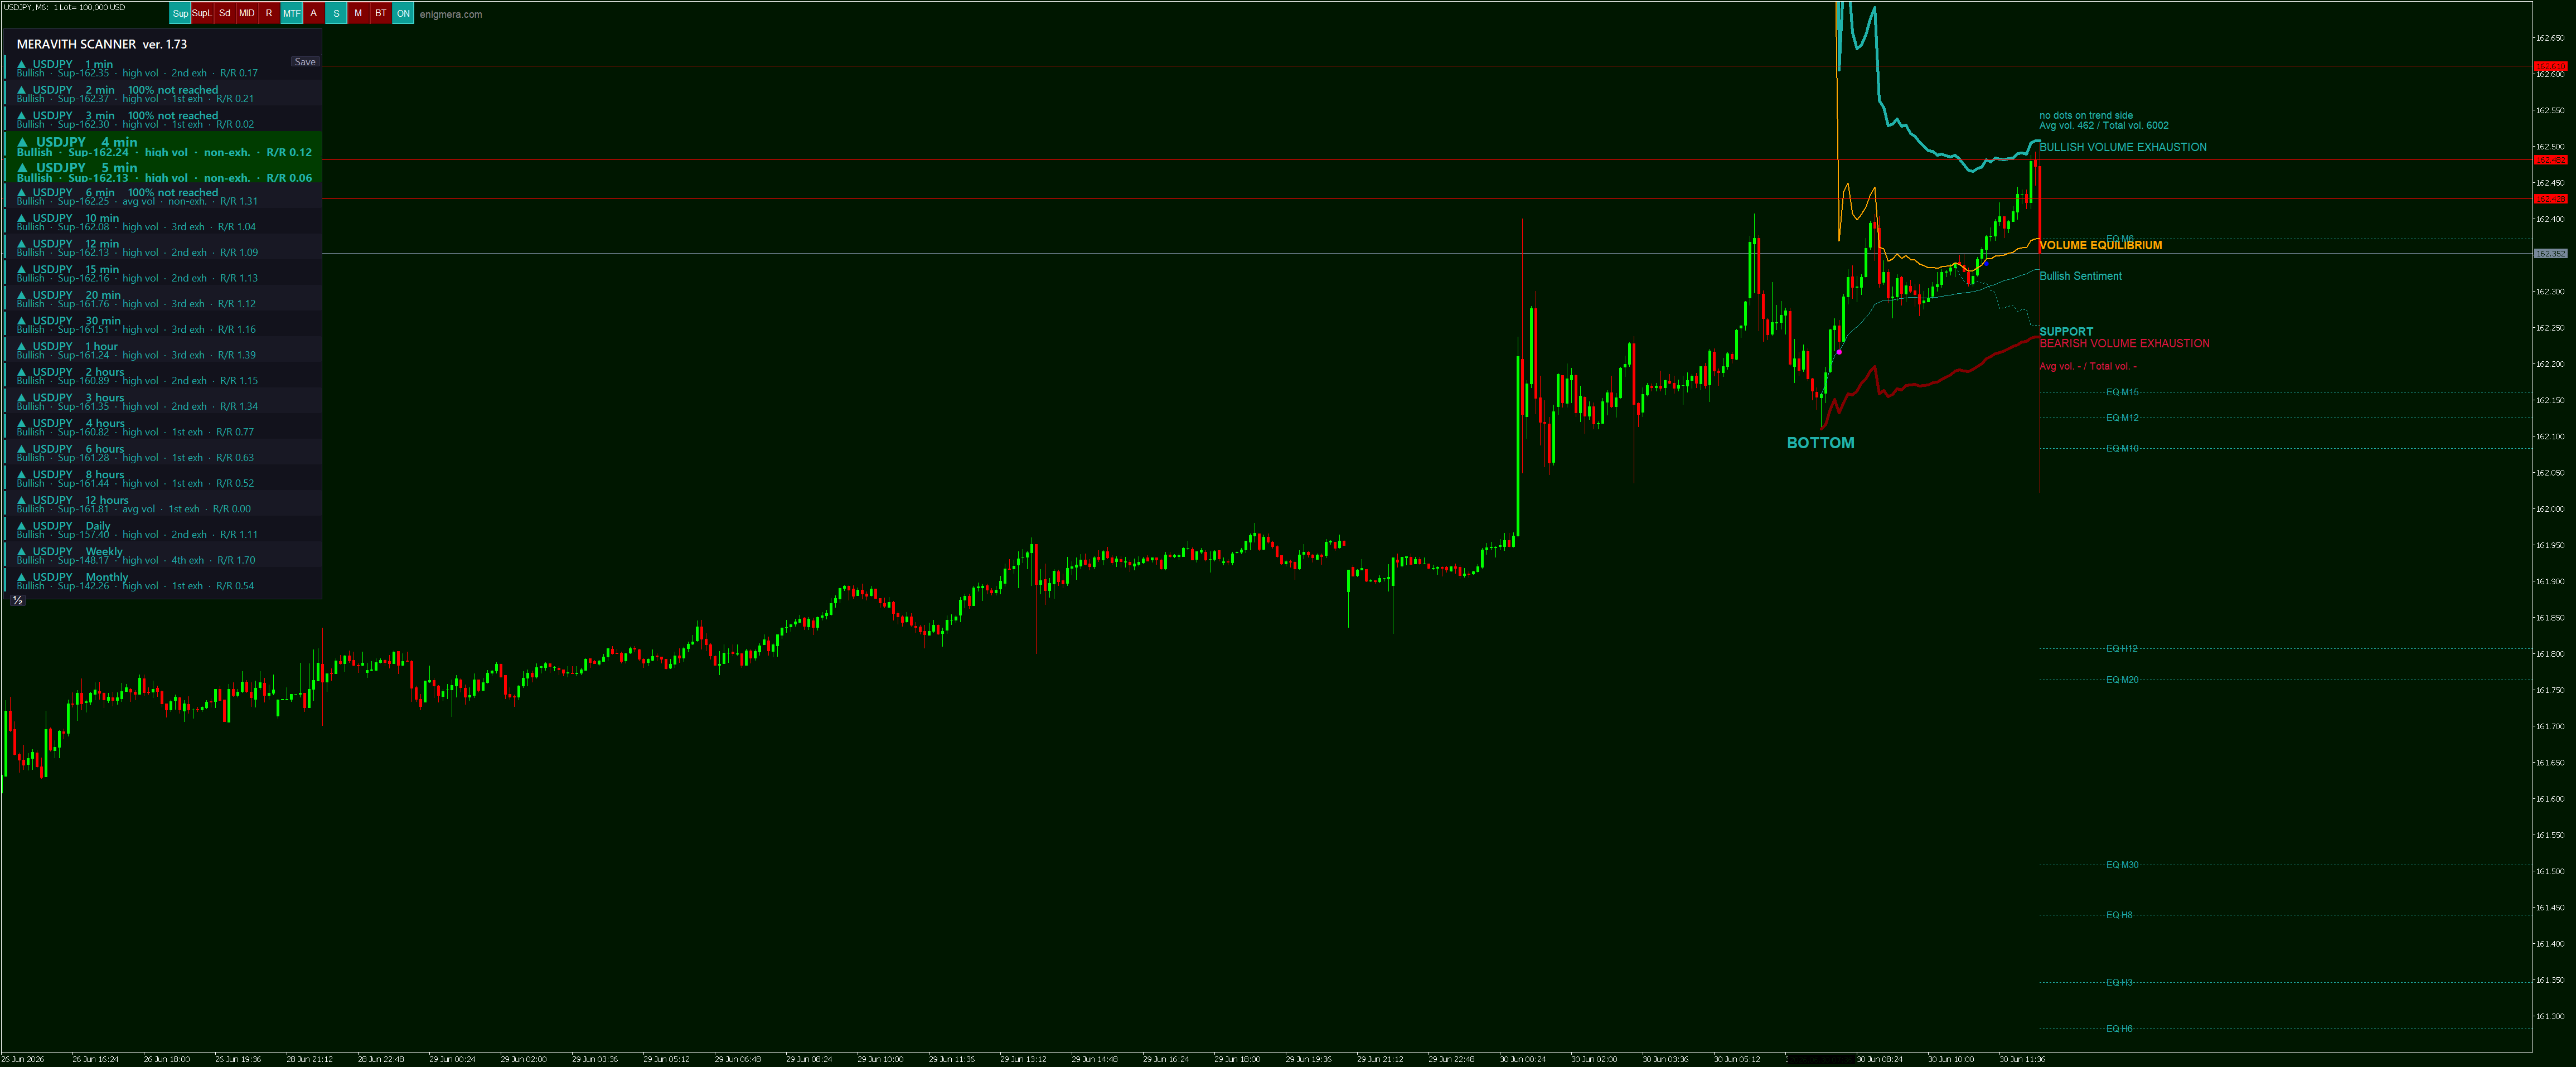
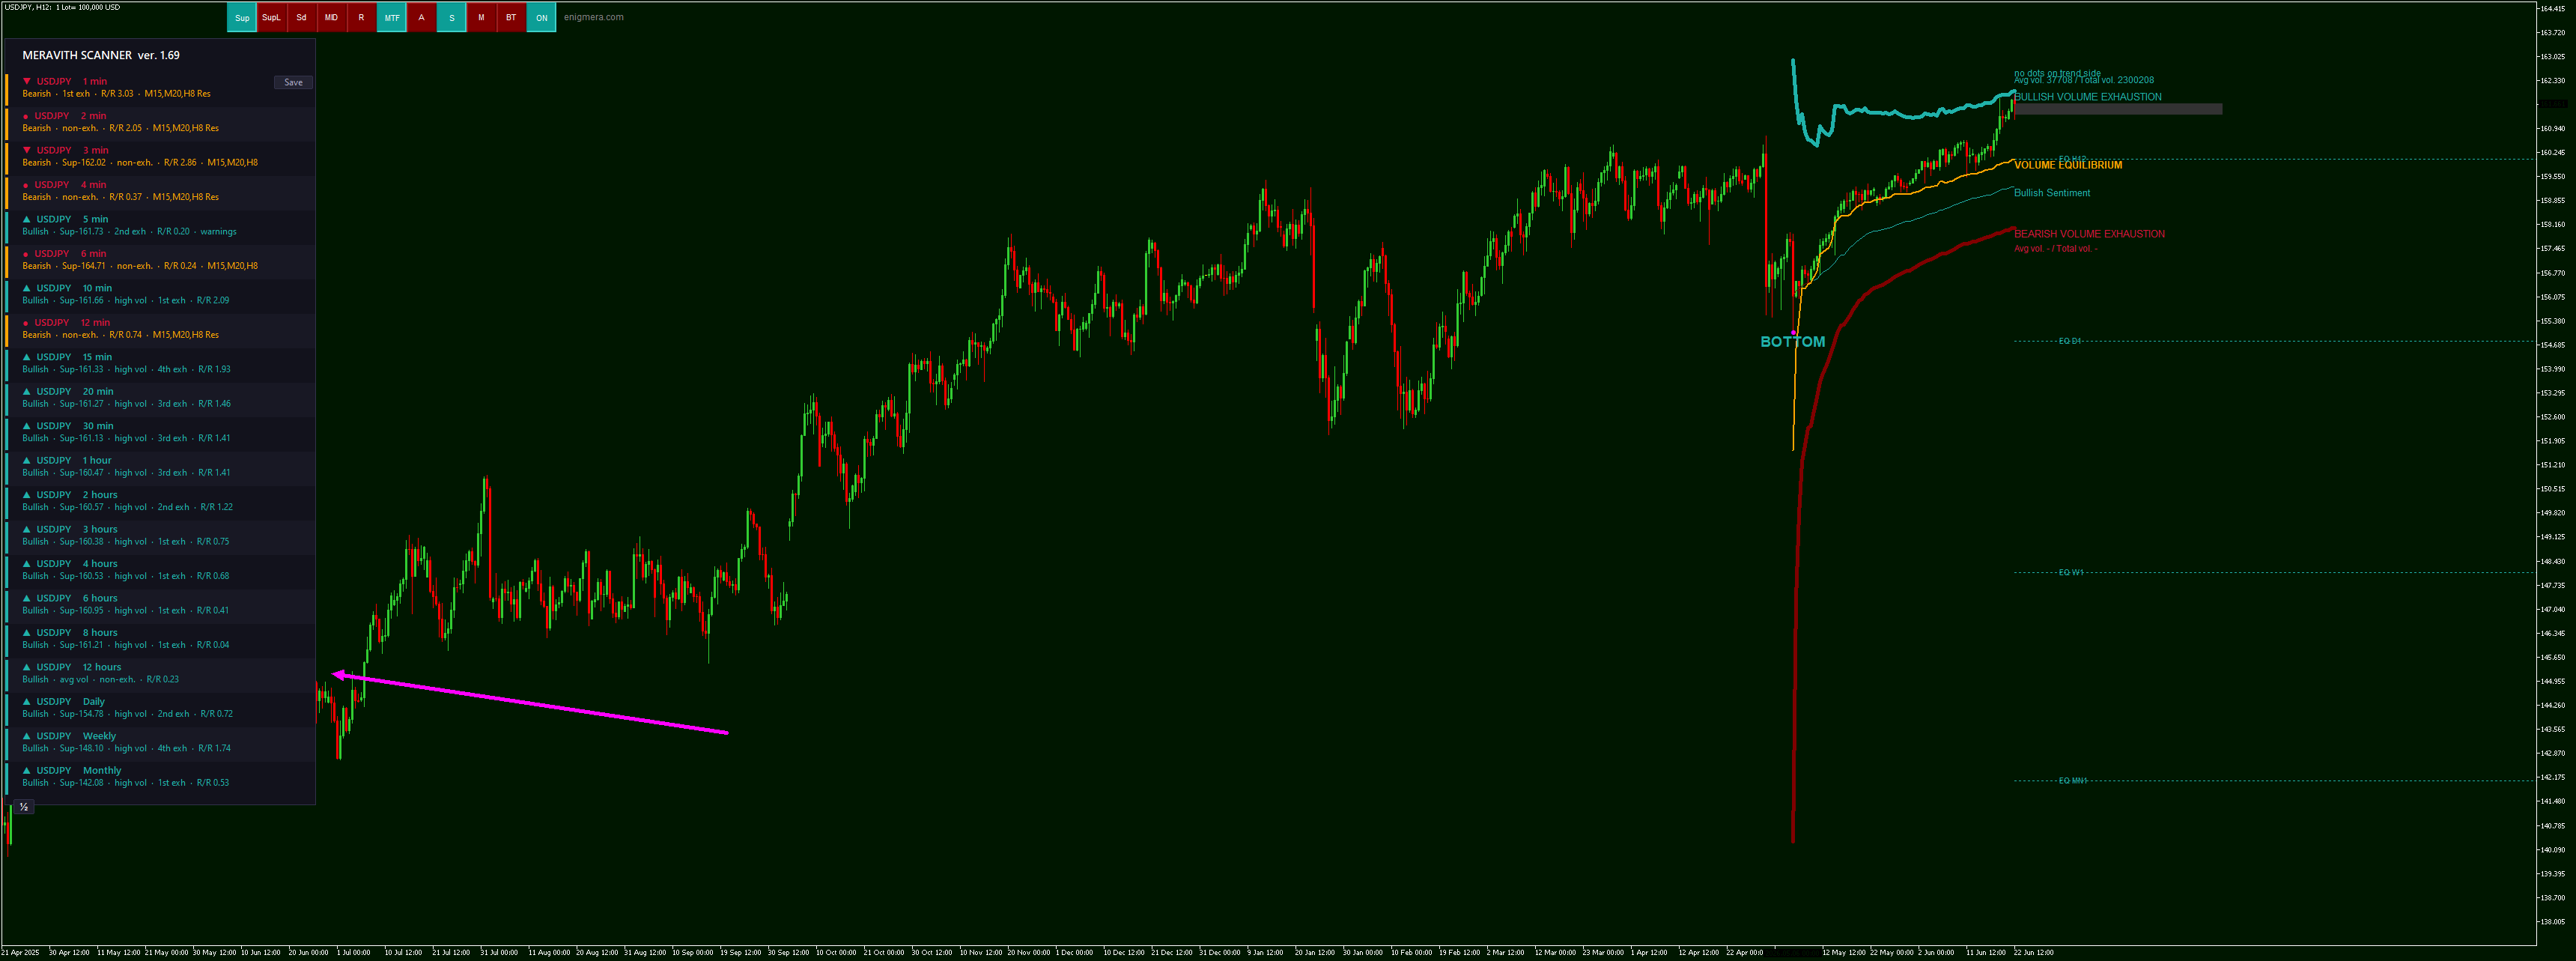
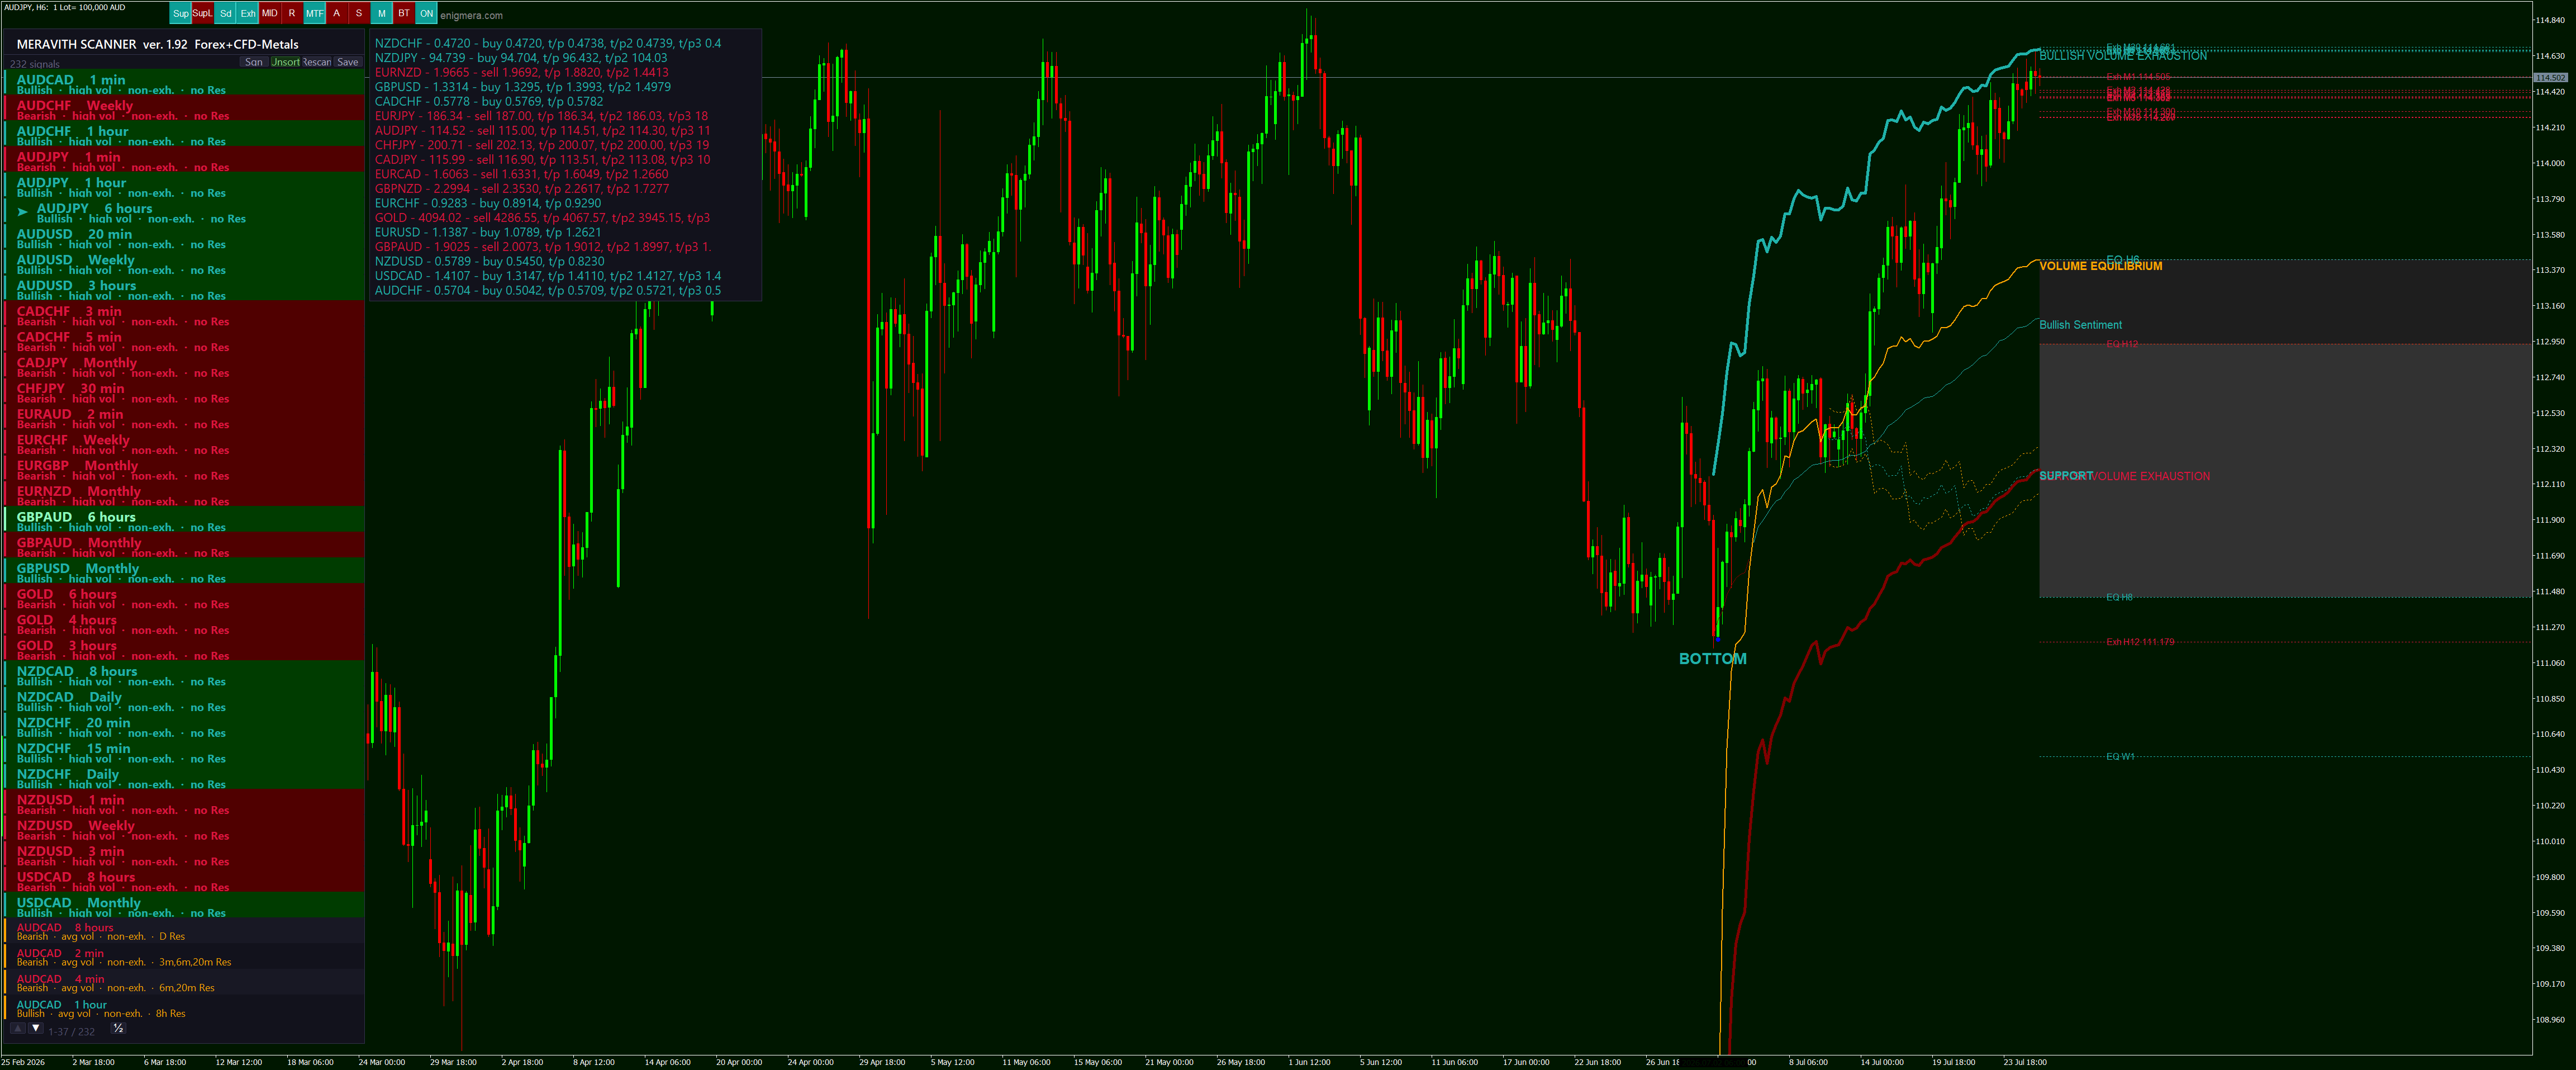
MERAVITH SCANNER extends its analysis across the entire instrument universe available within the broker terminal — Forex pairs, indices, metals, cryptocurrencies, equities, and any other categorised instruments — and evaluates them across all selected timeframes simultaneously.
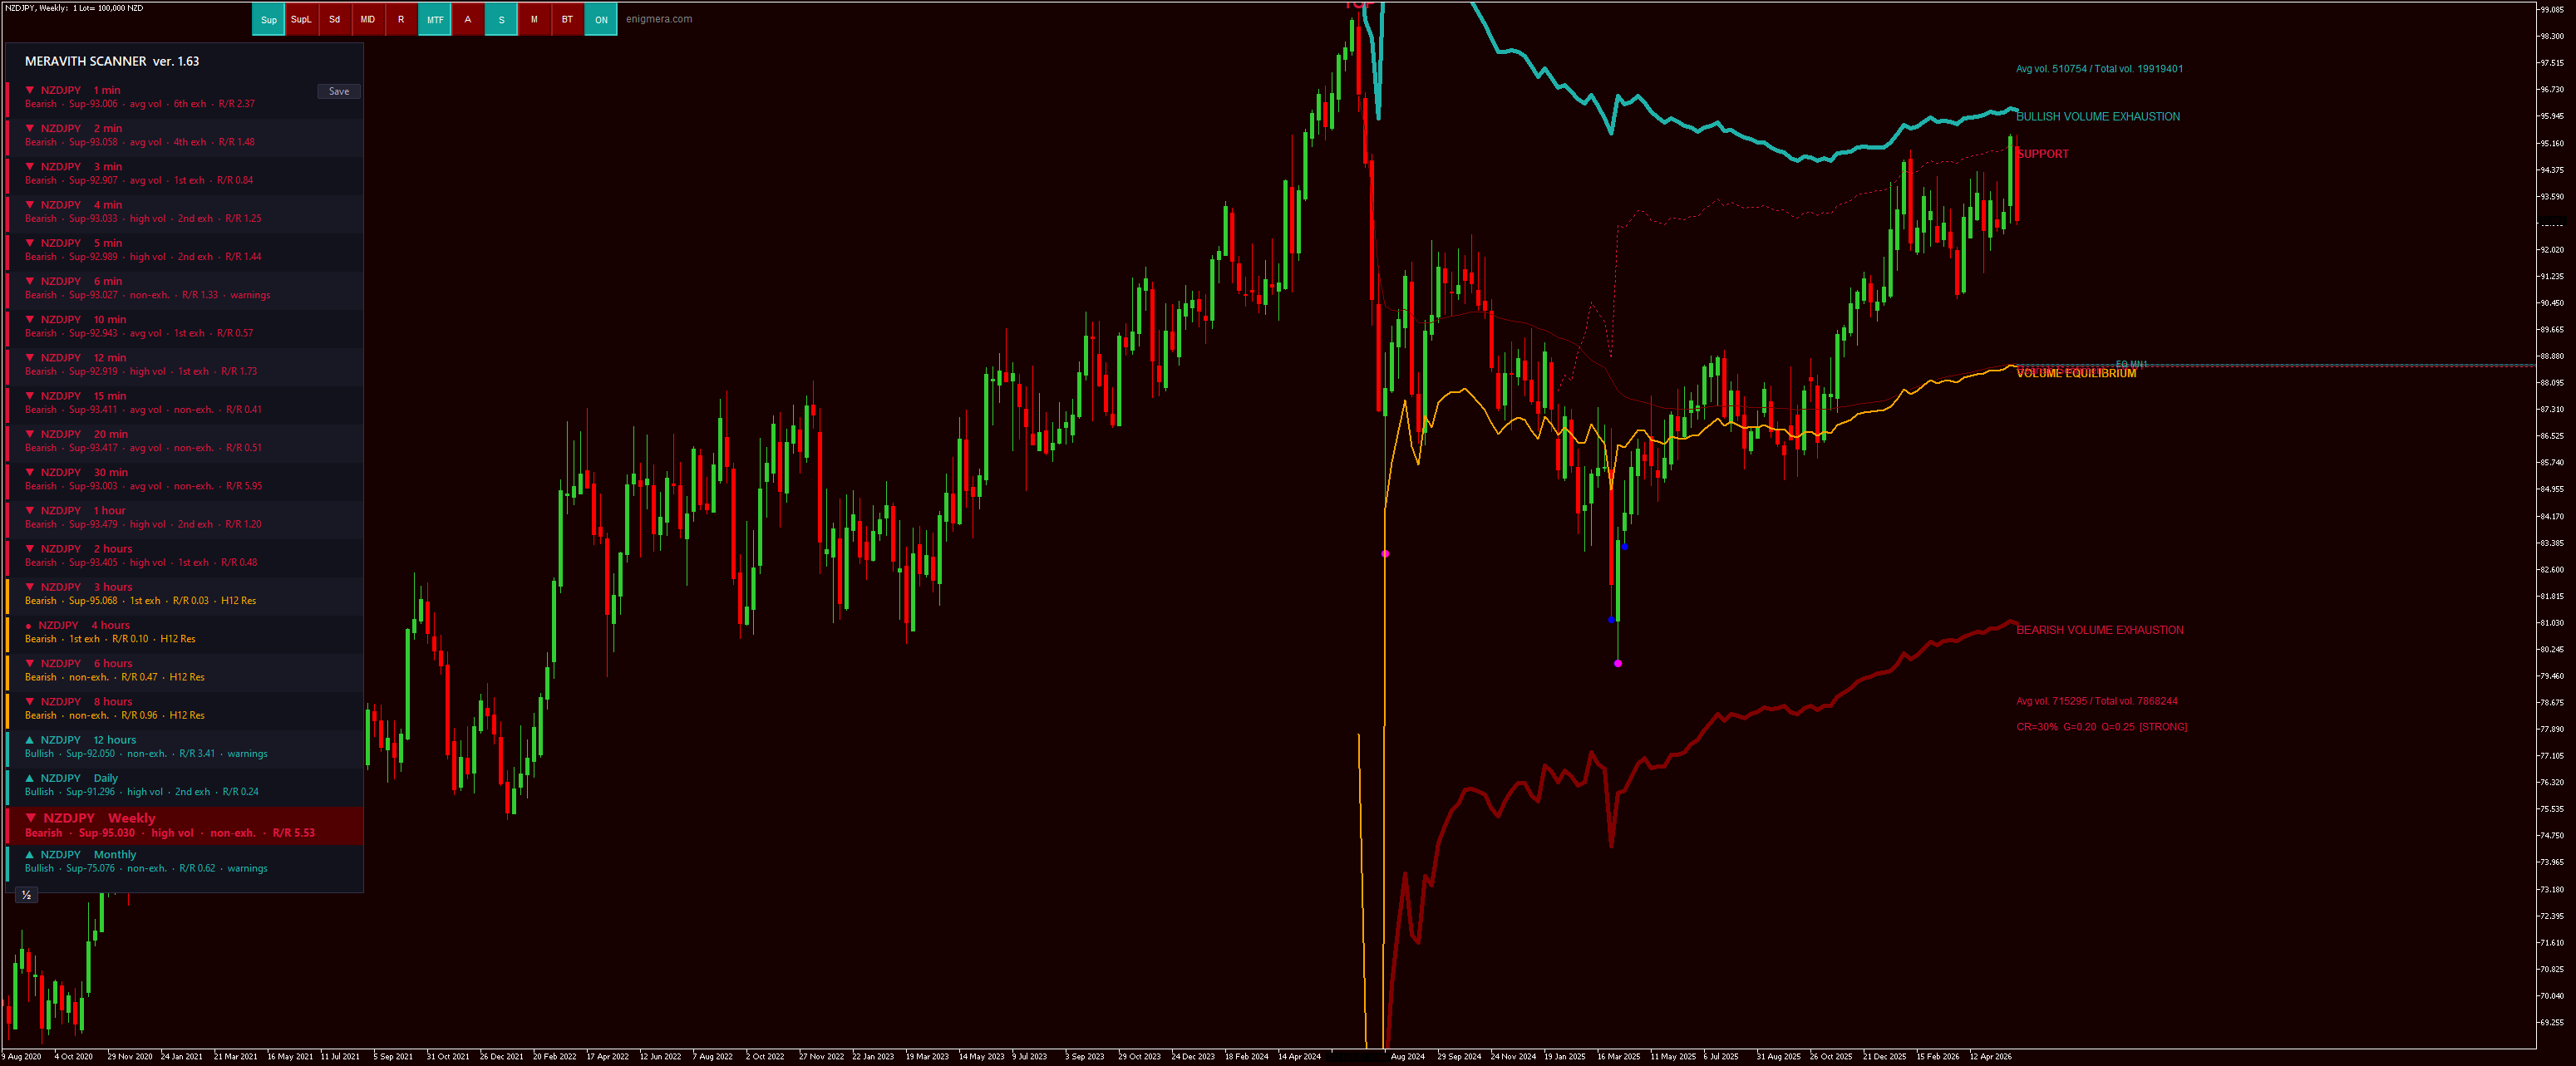
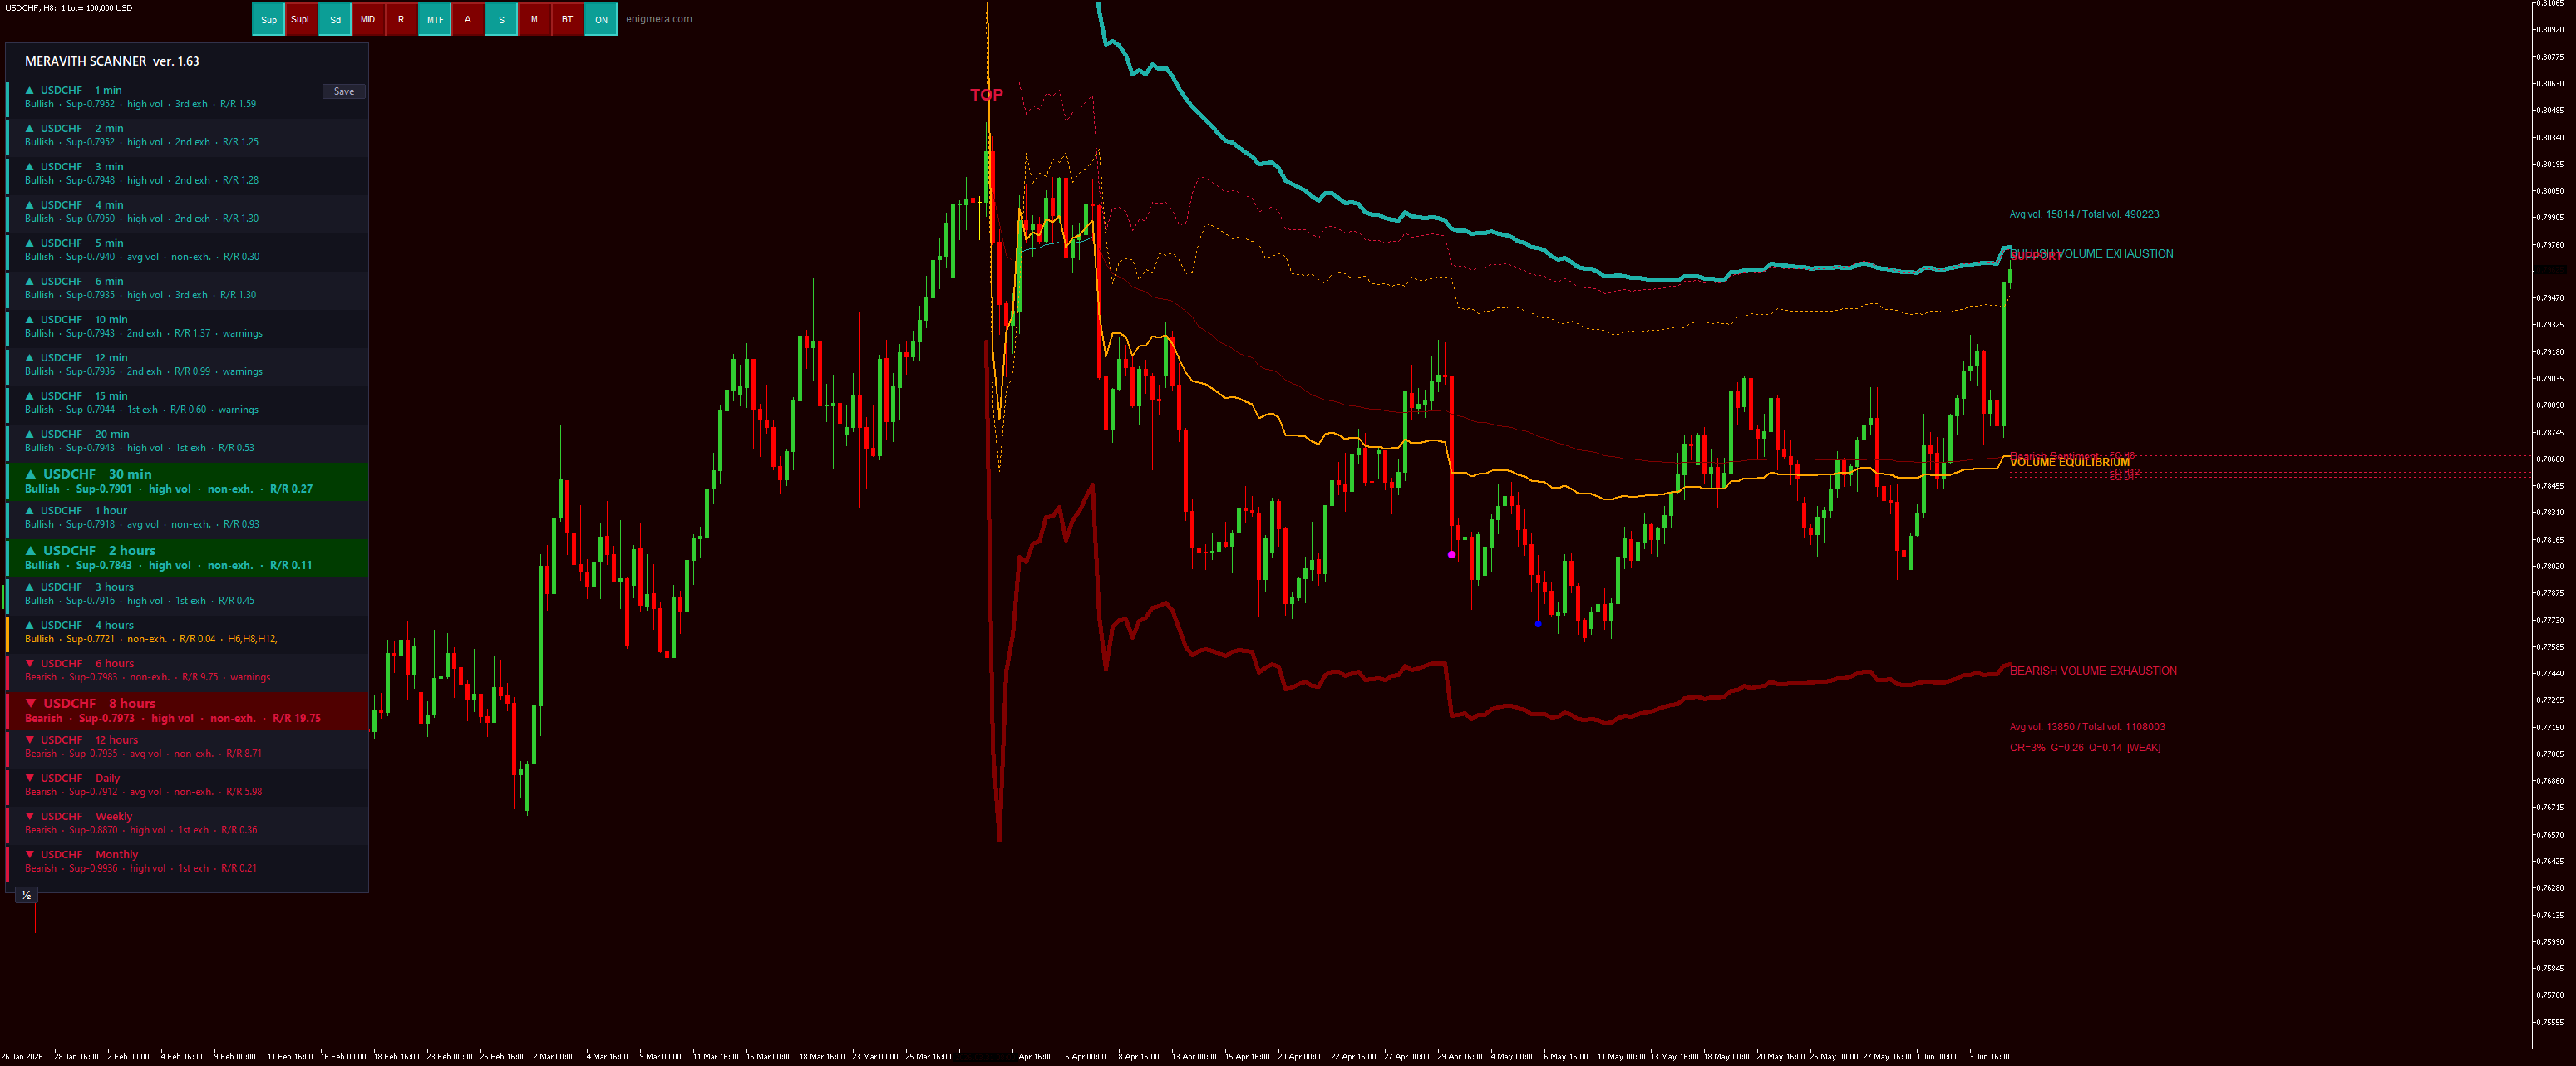
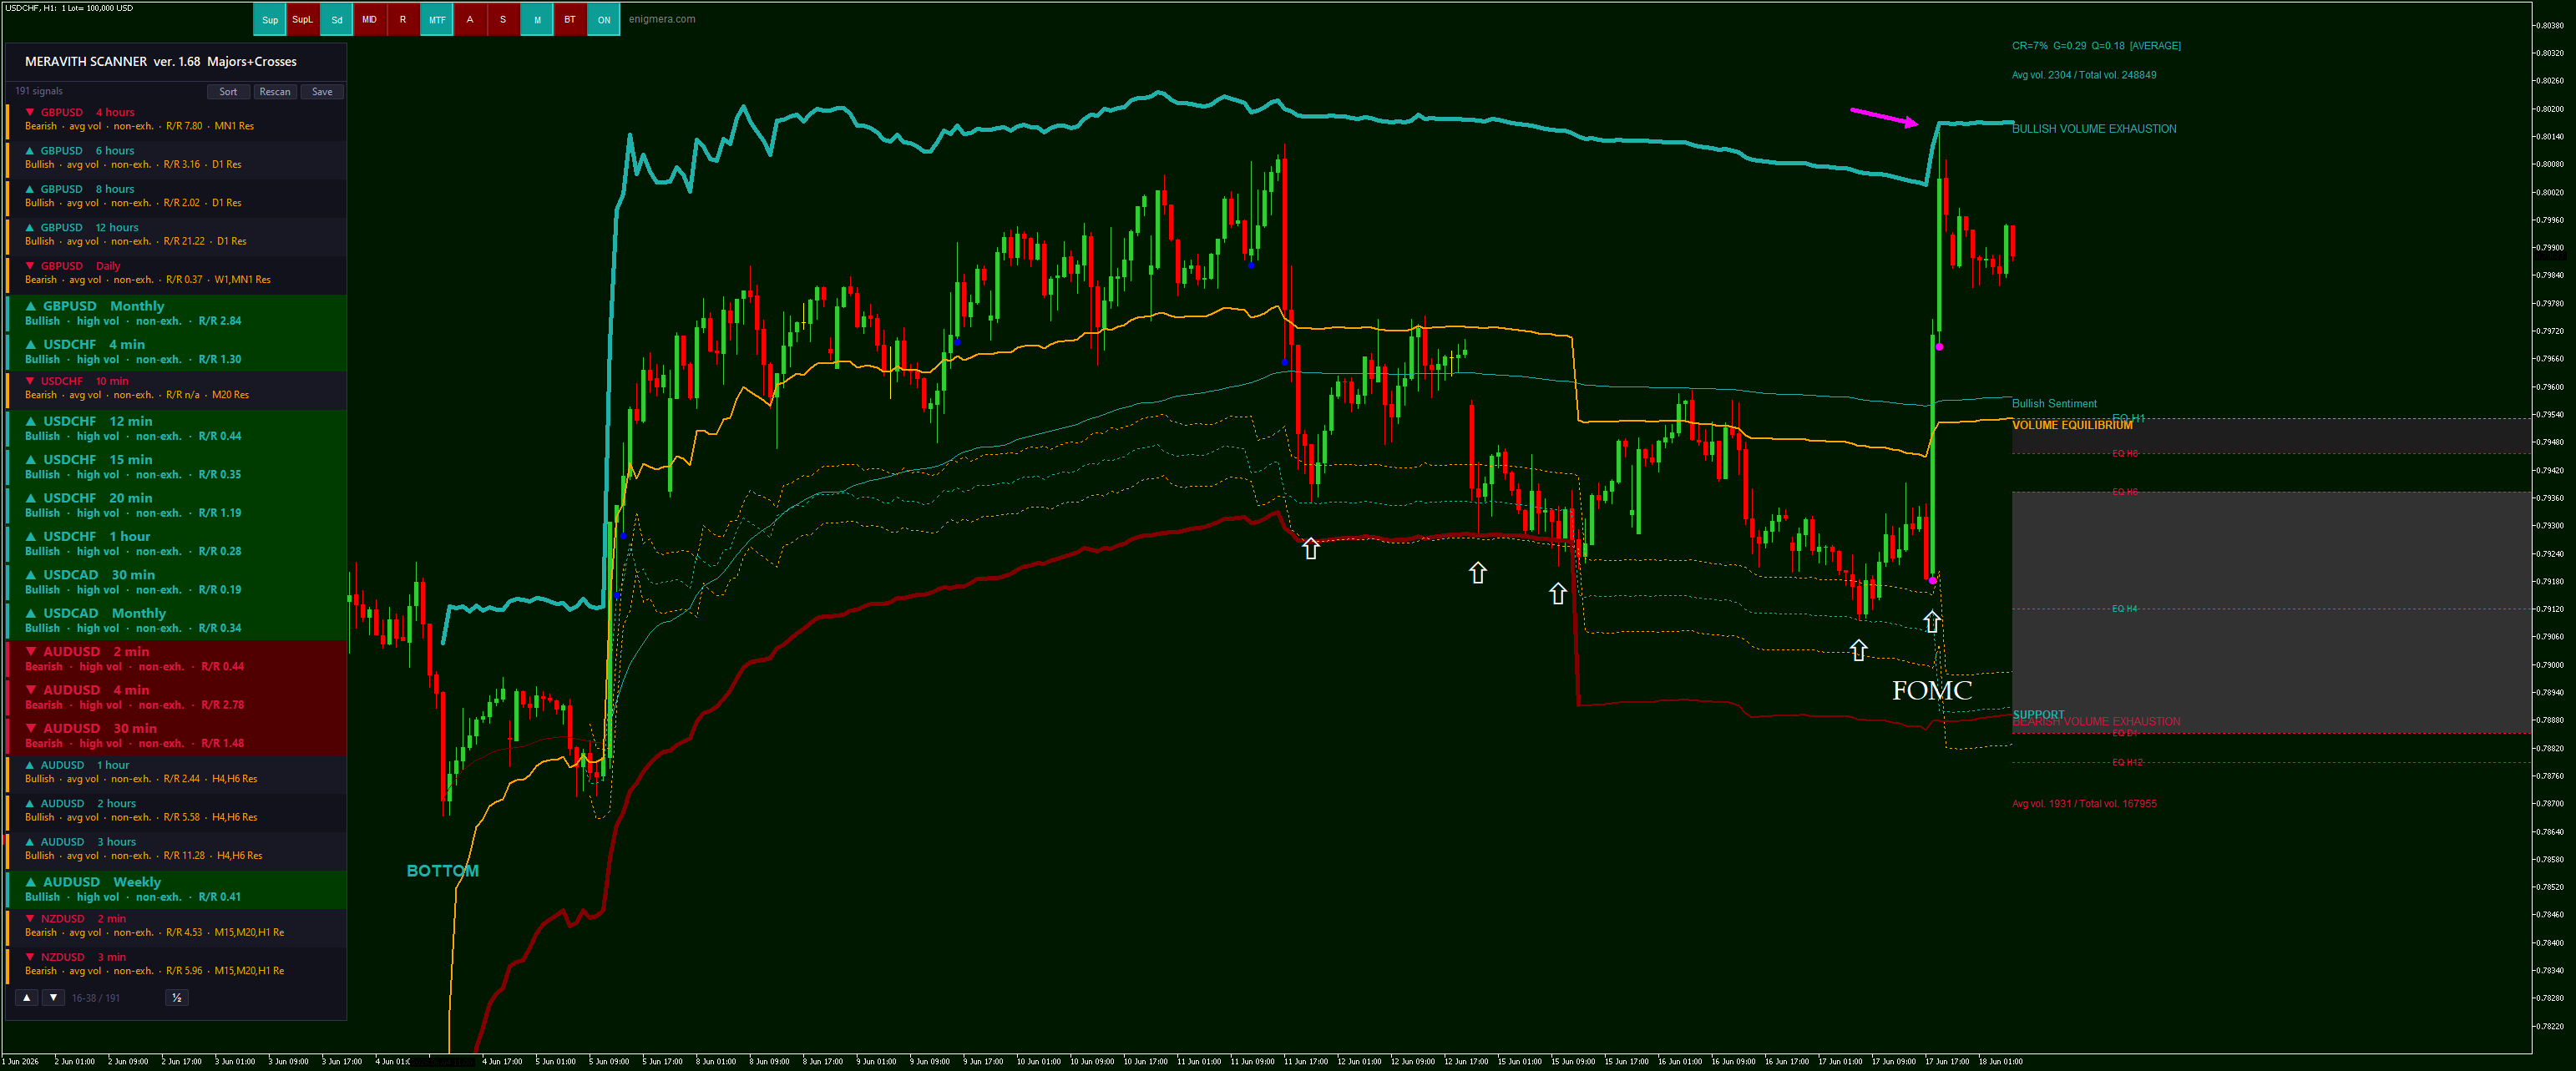
The scanner produces a structured, sortable board of qualified setups. Results can be filtered by trend direction and timeframe, ranked by signal quality, and accessed instantly: a single click navigates the chart directly to the selected symbol and timeframe, with the complete analytical layer reconstructed and applied automatically.
Additional operational features include:
Persistent caching of scan results across sessions and timeframe changes.
Configurable timeframe filters and trend-direction filters.
An auto-position engine that restores the full analytical context — anchor lines, equilibrium structures, exhaustion levels, and projected trade parameters — on every navigation.
What would otherwise require extended manual review across dozens of charts is consolidated into a single, queryable interface.
Designed For Professional Use
MERAVITH SCANNER is built for traders who require a systematic, repeatable, and structurally grounded approach to market analysis. It is intended for users who already operate with a defined methodology and seek a tool capable of supporting that methodology with institutional-grade depth, scanning breadth, and analytical precision.
MERAVITH SCANNER — structural analysis, liquidity mapping, and full-market scanning, delivered within a single professional environment.