Meravith Scanner

5

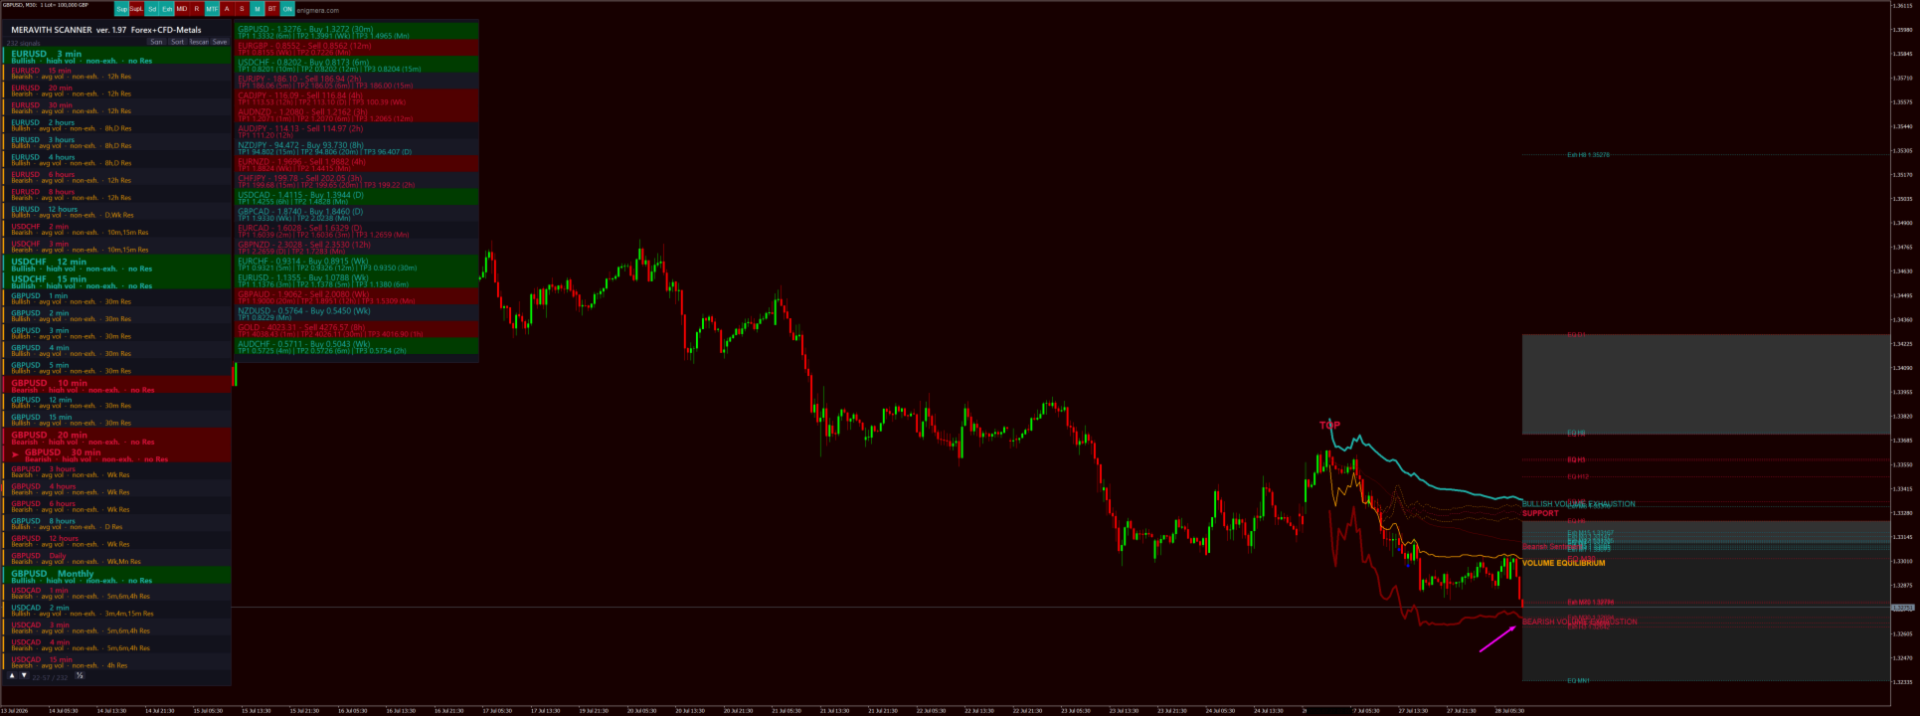
MERAVITH SCANNERは、MetaTrader 5用のプロフェッショナルな金融市場インジケーターで、複数の分析ツールを一つの統合システムにまとめています。独自の出来高加重平均価格(VWAP)手法を使用してすべての計算を自動で行い、主観的な解釈を完全に排除します。

このインジケーターは、すべての資産クラス(FX、株式、指数、商品、暗号通貨)およびM1から月足までのすべての時間軸で動作します。基本原理は「価格は出来高に従う」というものです。MERAVITHは機関投資家の出来高が集中するポイントを特定し、その集中から数学的に正確な価格レベルを導き出します。予測や投機は行わず、計算のみを行います。

MERAVITH SCANNERを使用すると、28の主要FX通貨ペアをすべての時間軸でわずか2~3分でスキャンできます。また、任意の市場をスキャンすることも可能です。例えば、約100銘柄の株式を約10分でスキャンできます。

インジケーターは、消耗レベル、均衡線、偏差、統計レベル、およびターゲット予測を算出します。

チャート要素

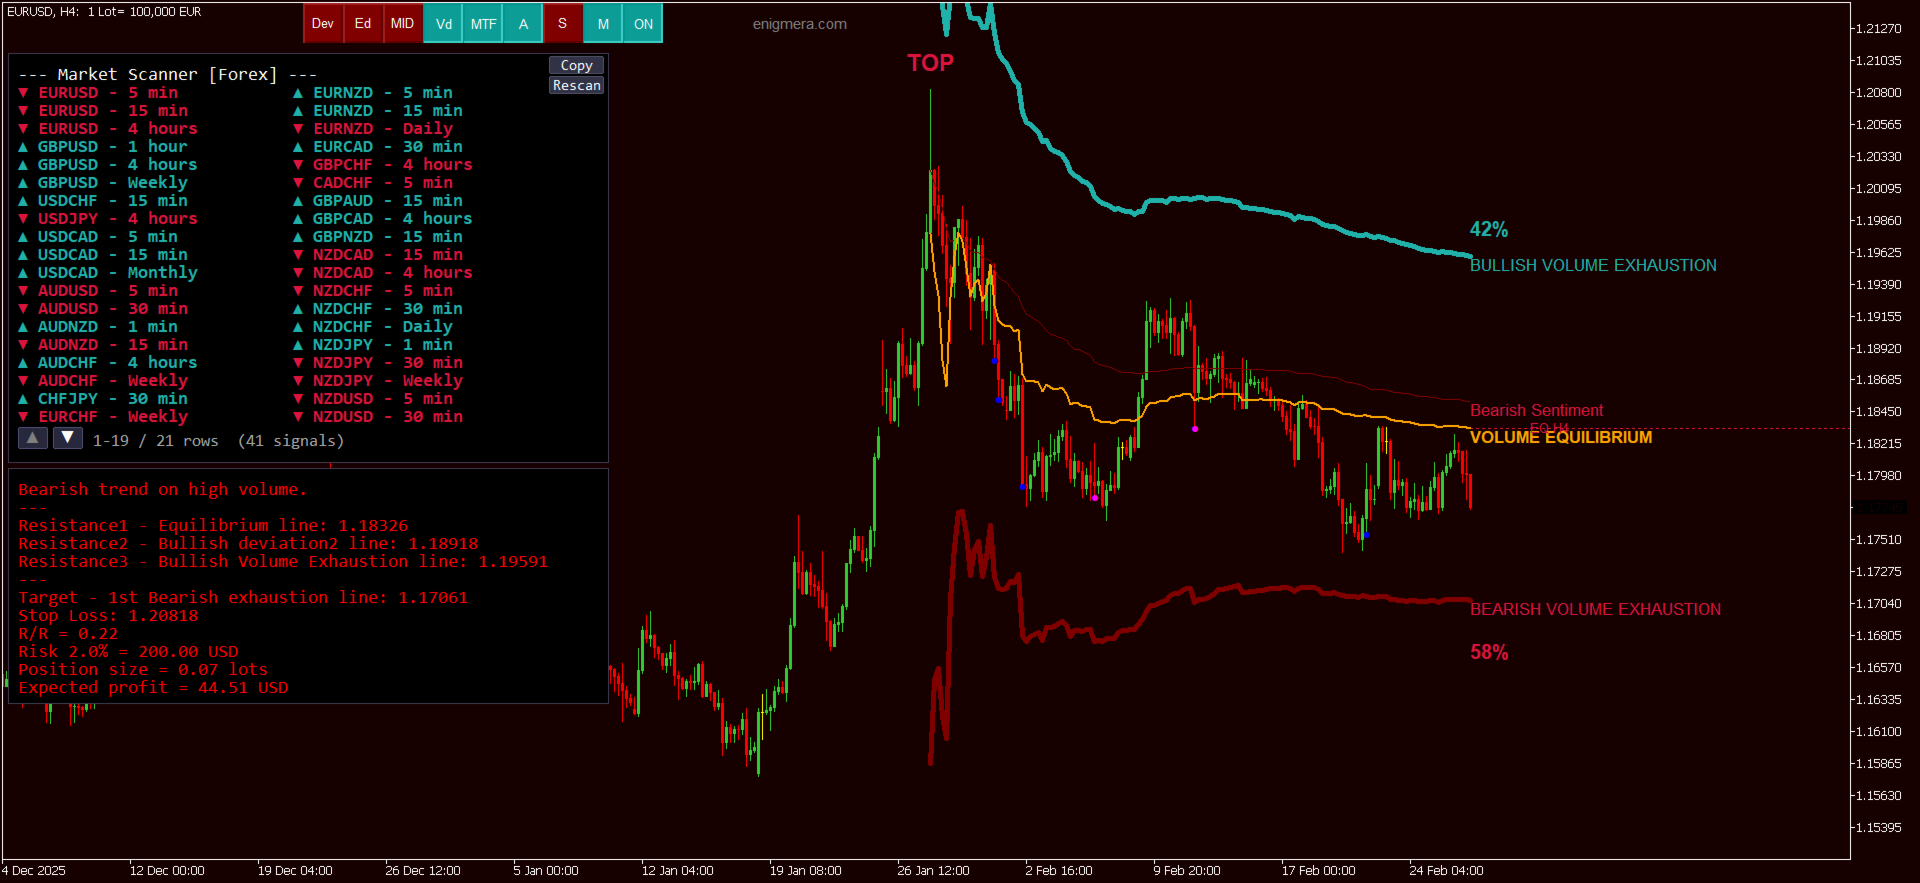
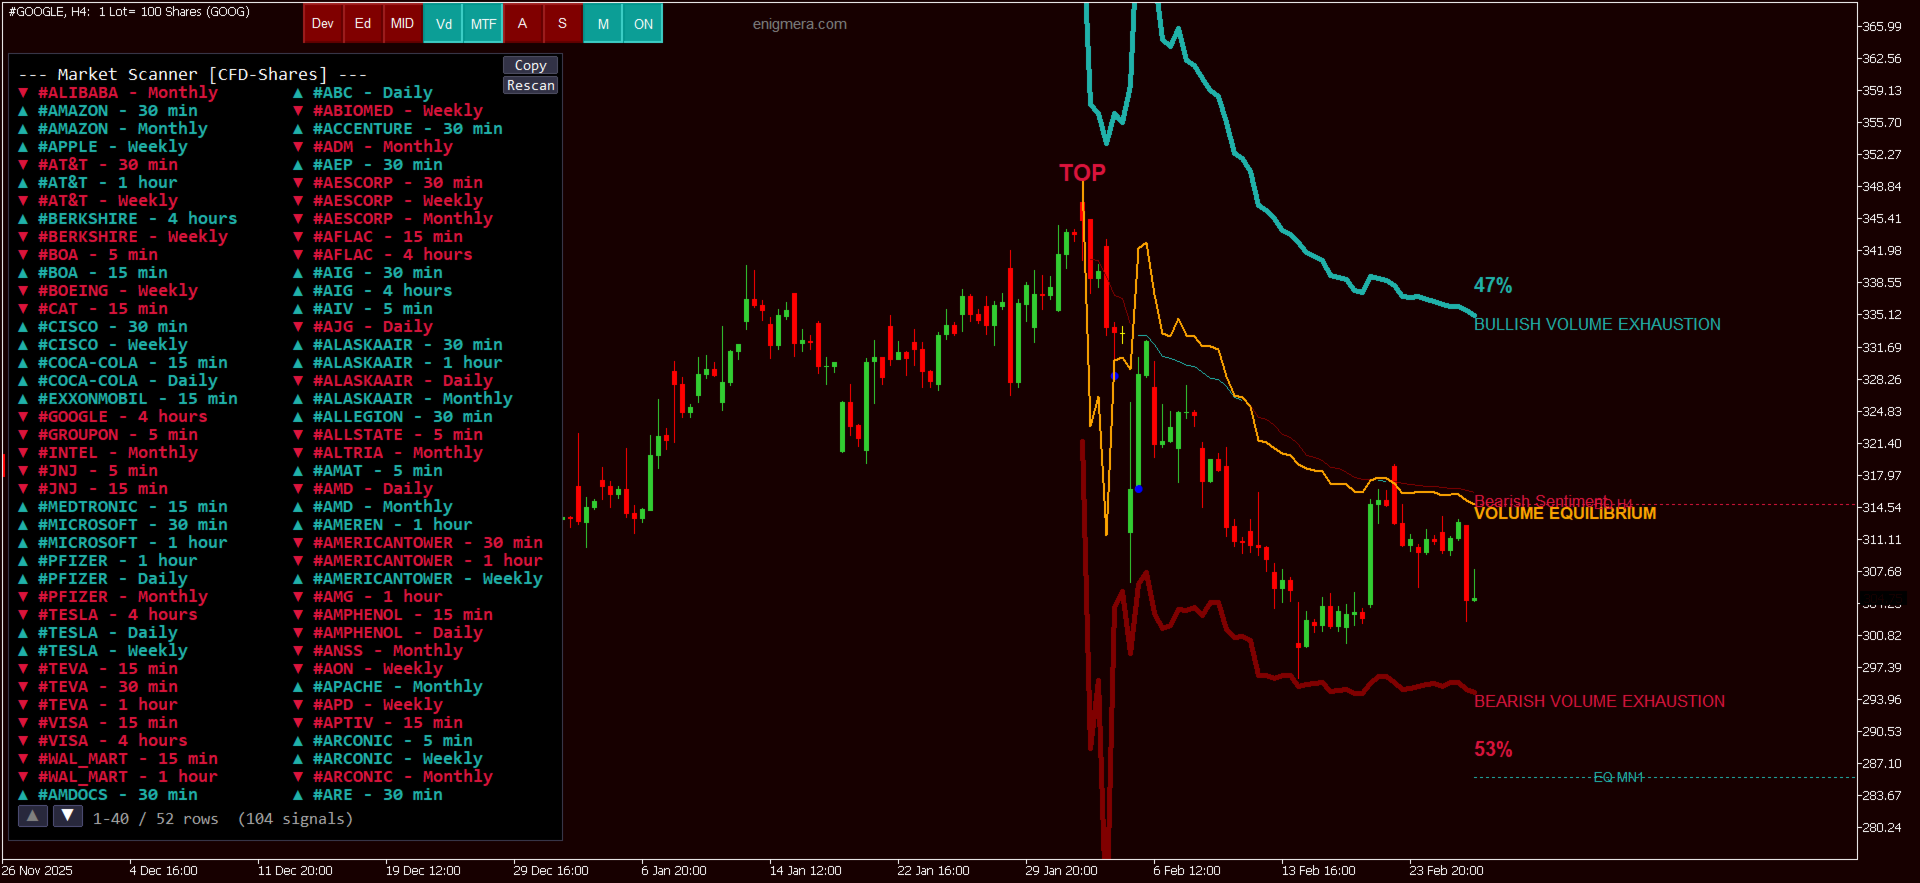
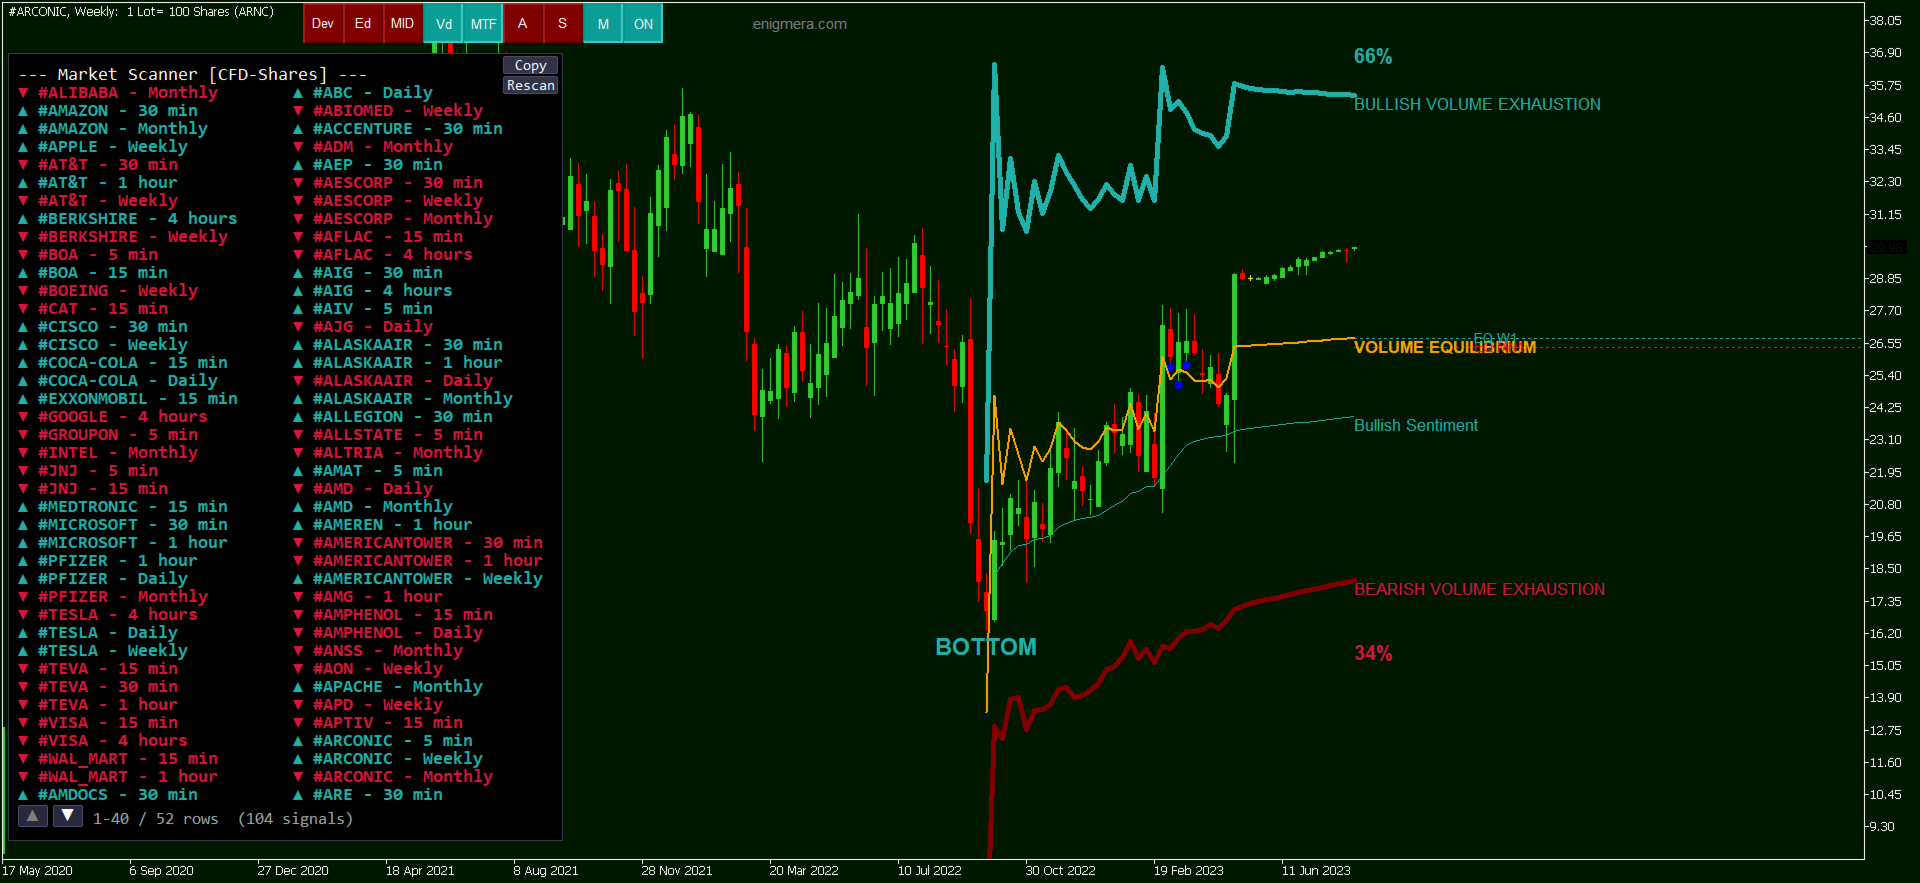
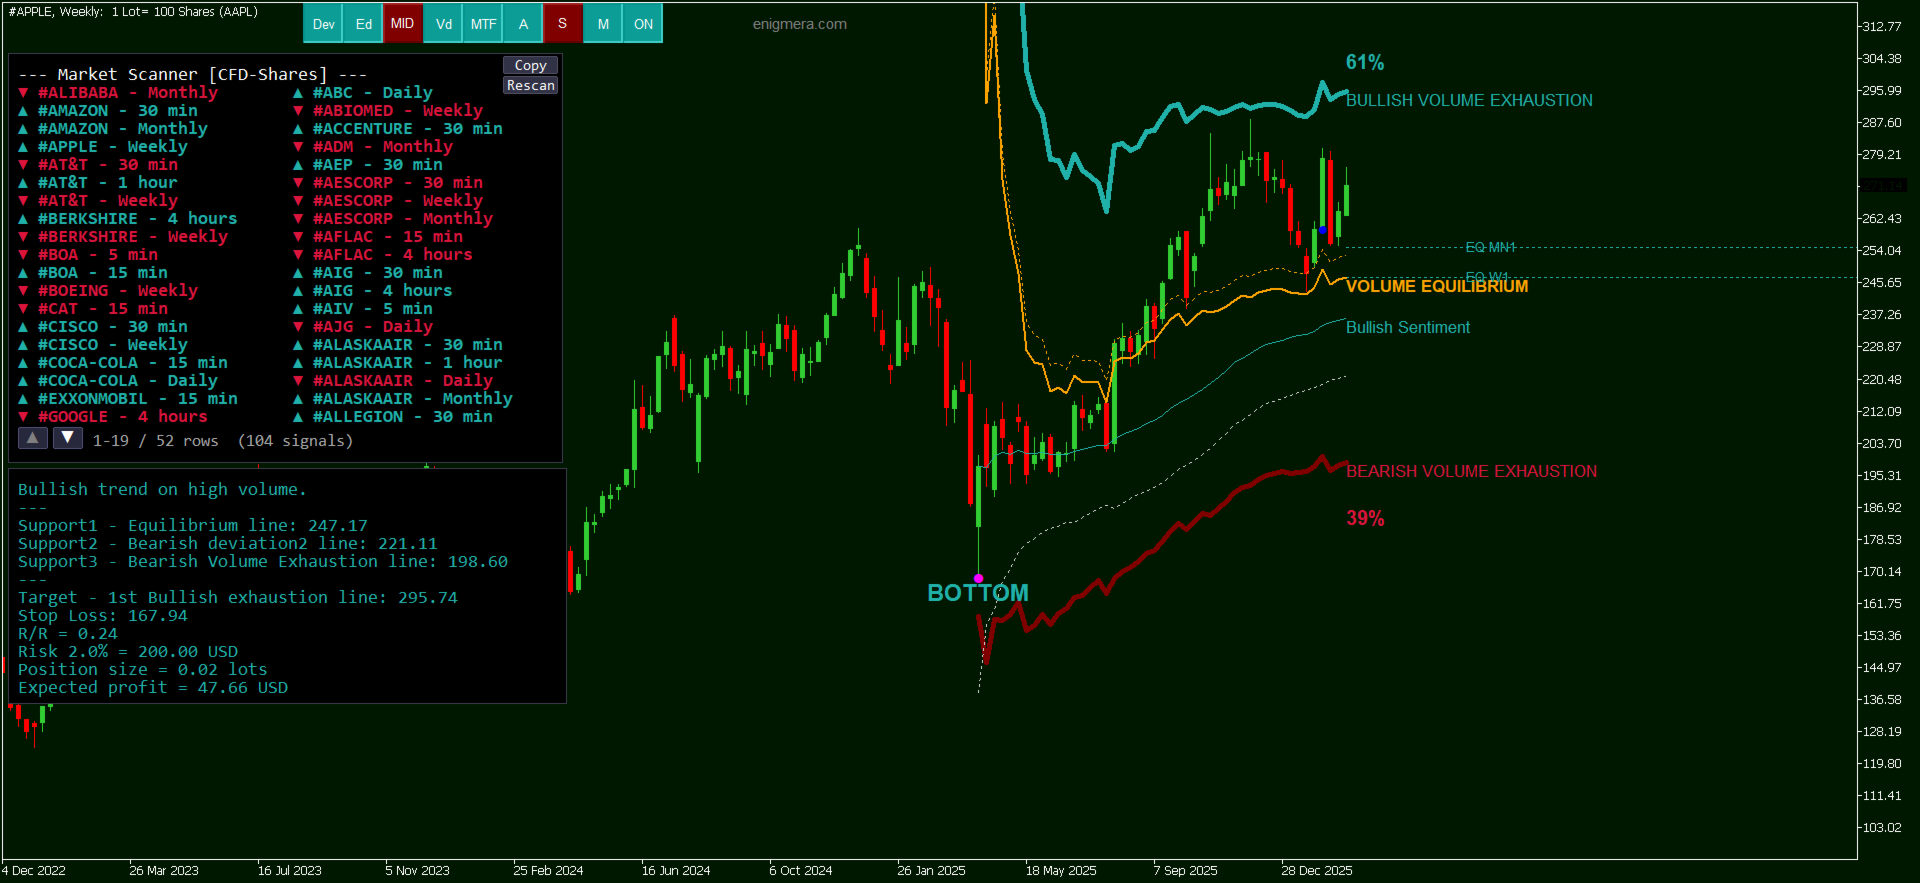
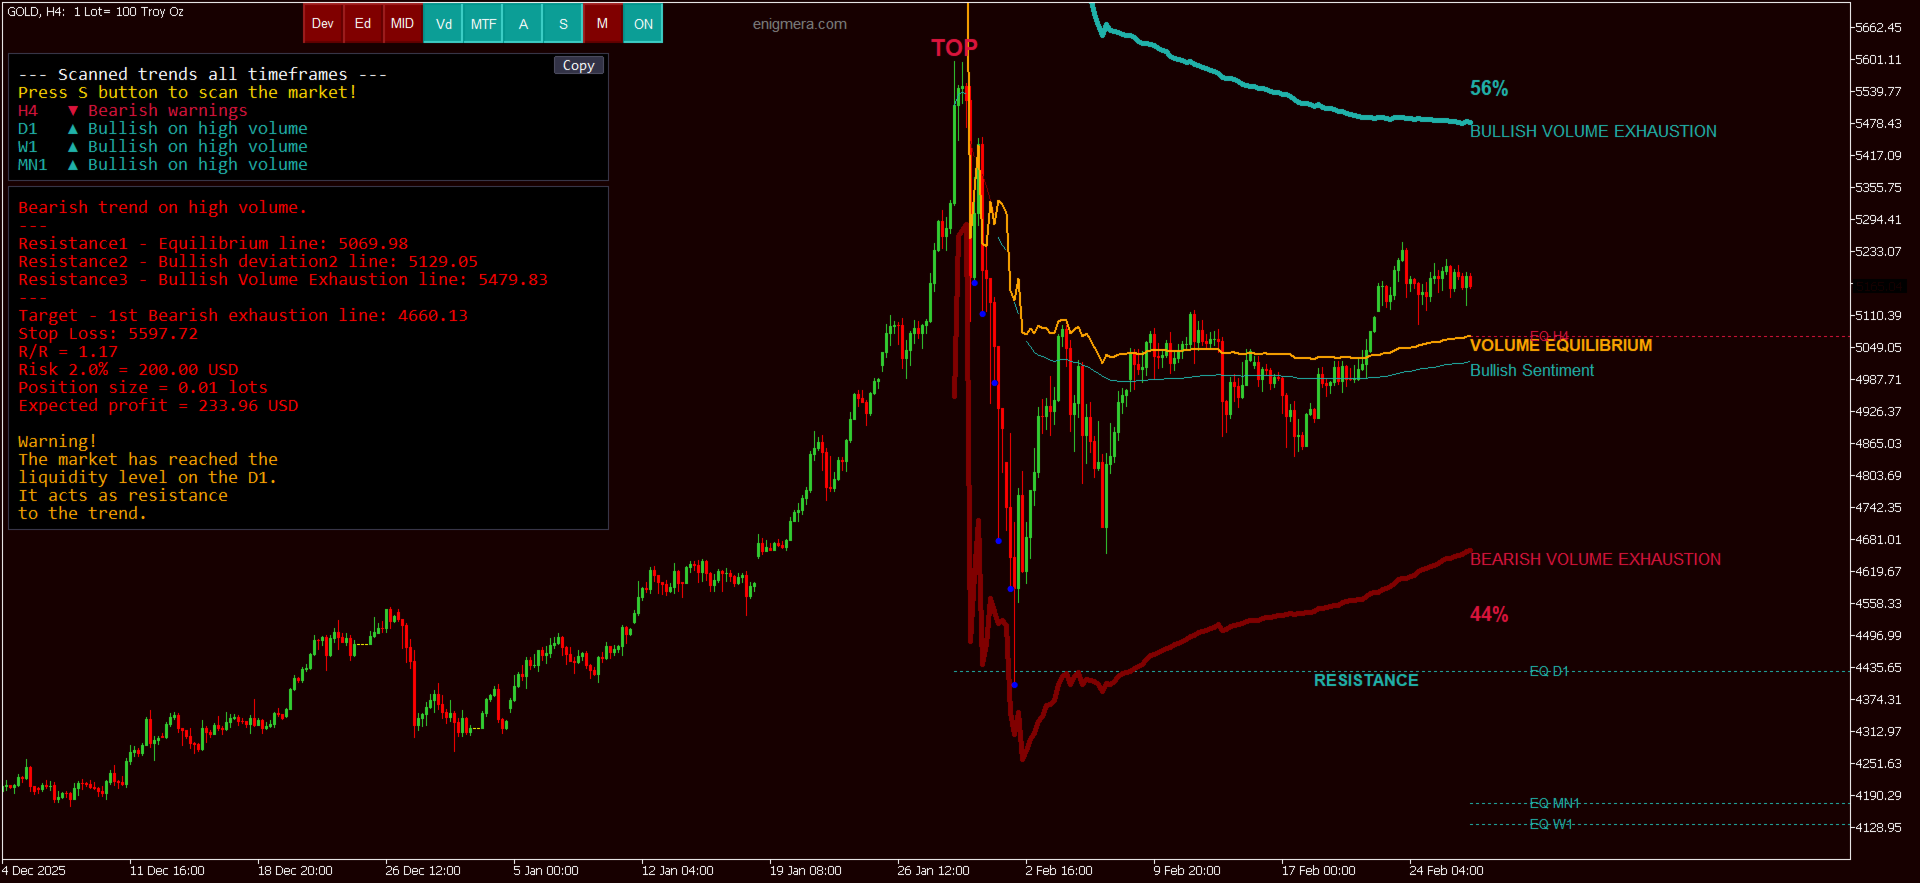
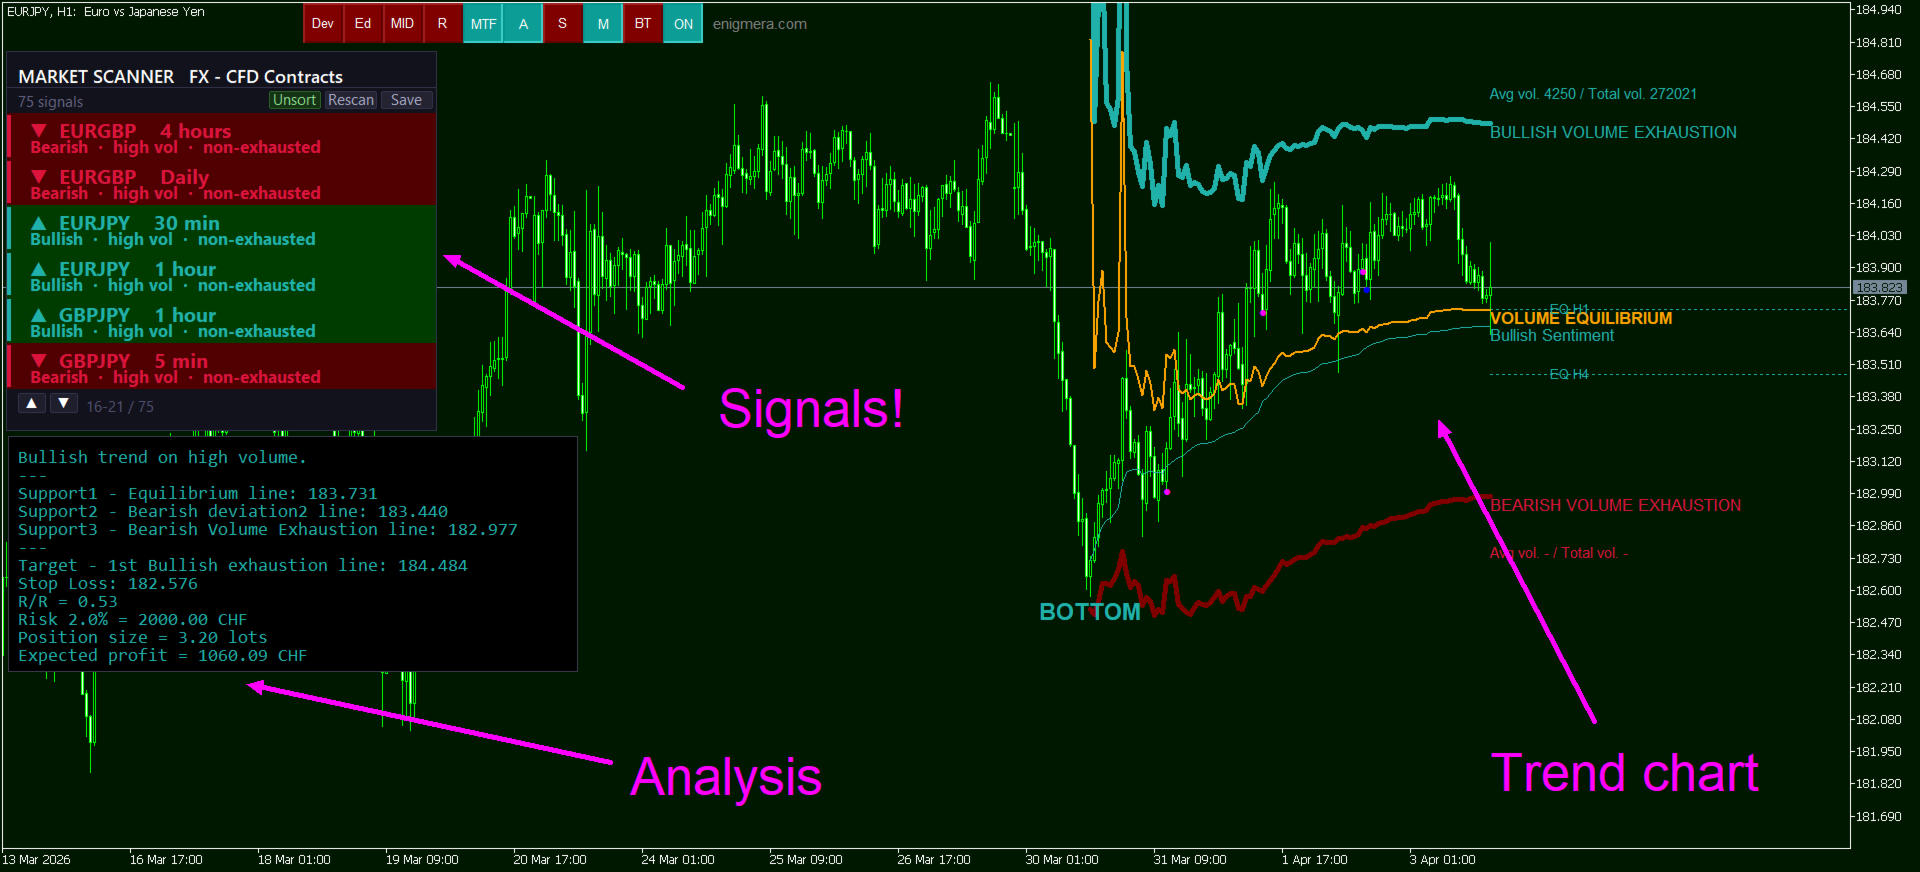
Origin Point:すべての計算が始まる起点です。インジケーターは最適な位置に自動配置します。赤いラベル(TOP)は下降バイアスを伴う市場の高値を示します。緑のラベル(BOTTOM)は上昇バイアスを伴う市場の安値を示します。

Sentiment Line:出来高加重計算に基づく市場センチメントを反映する動的な曲線です。赤は弱気、緑は強気、白は稀な移行状態を示します。

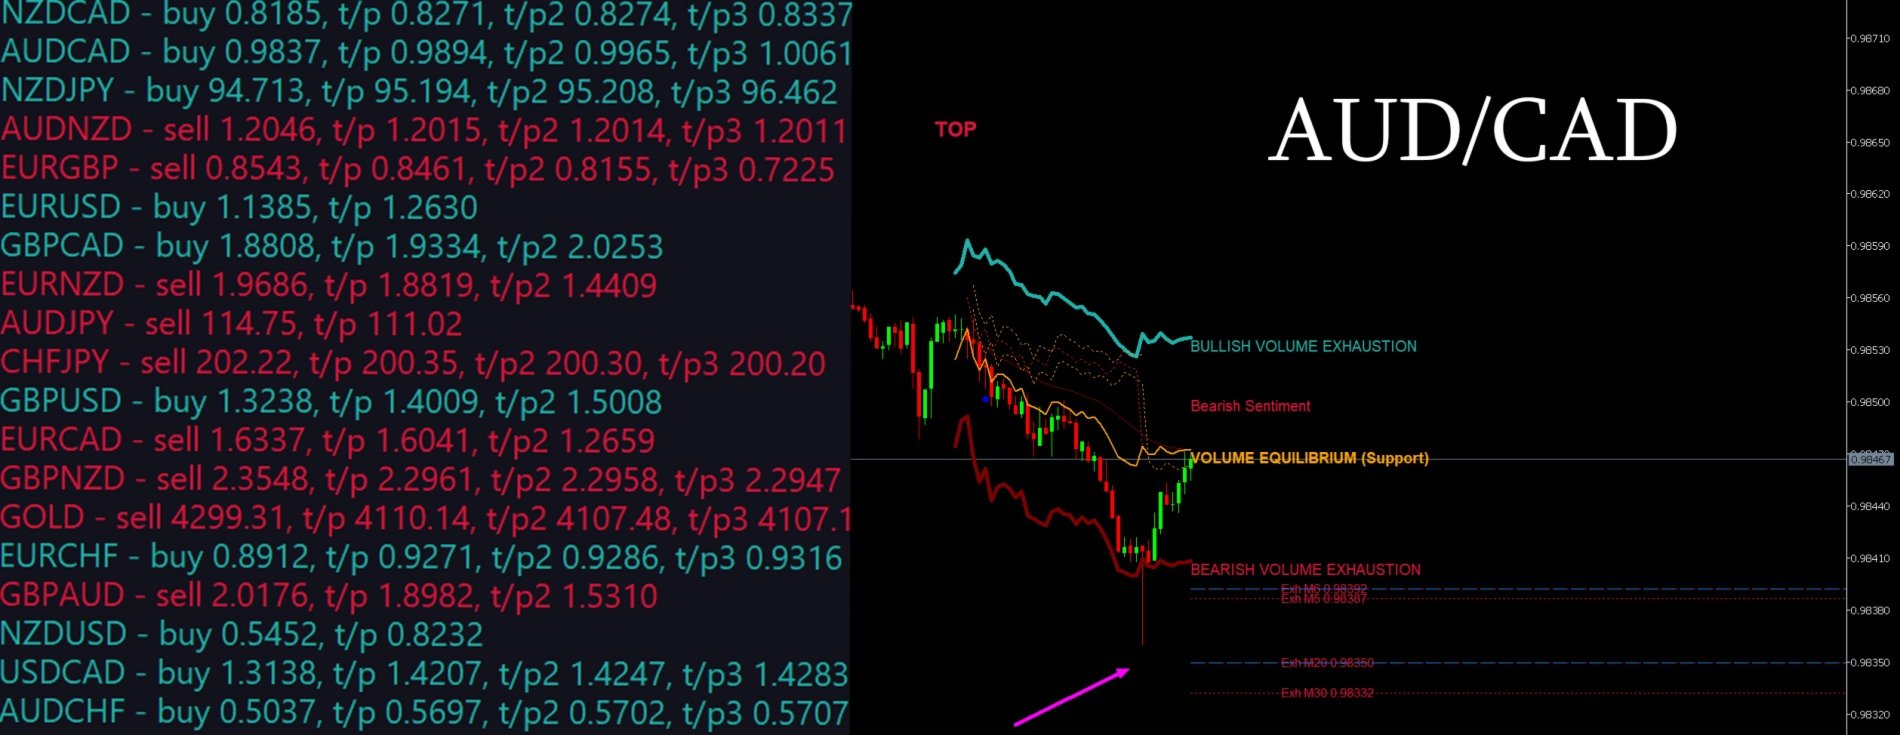
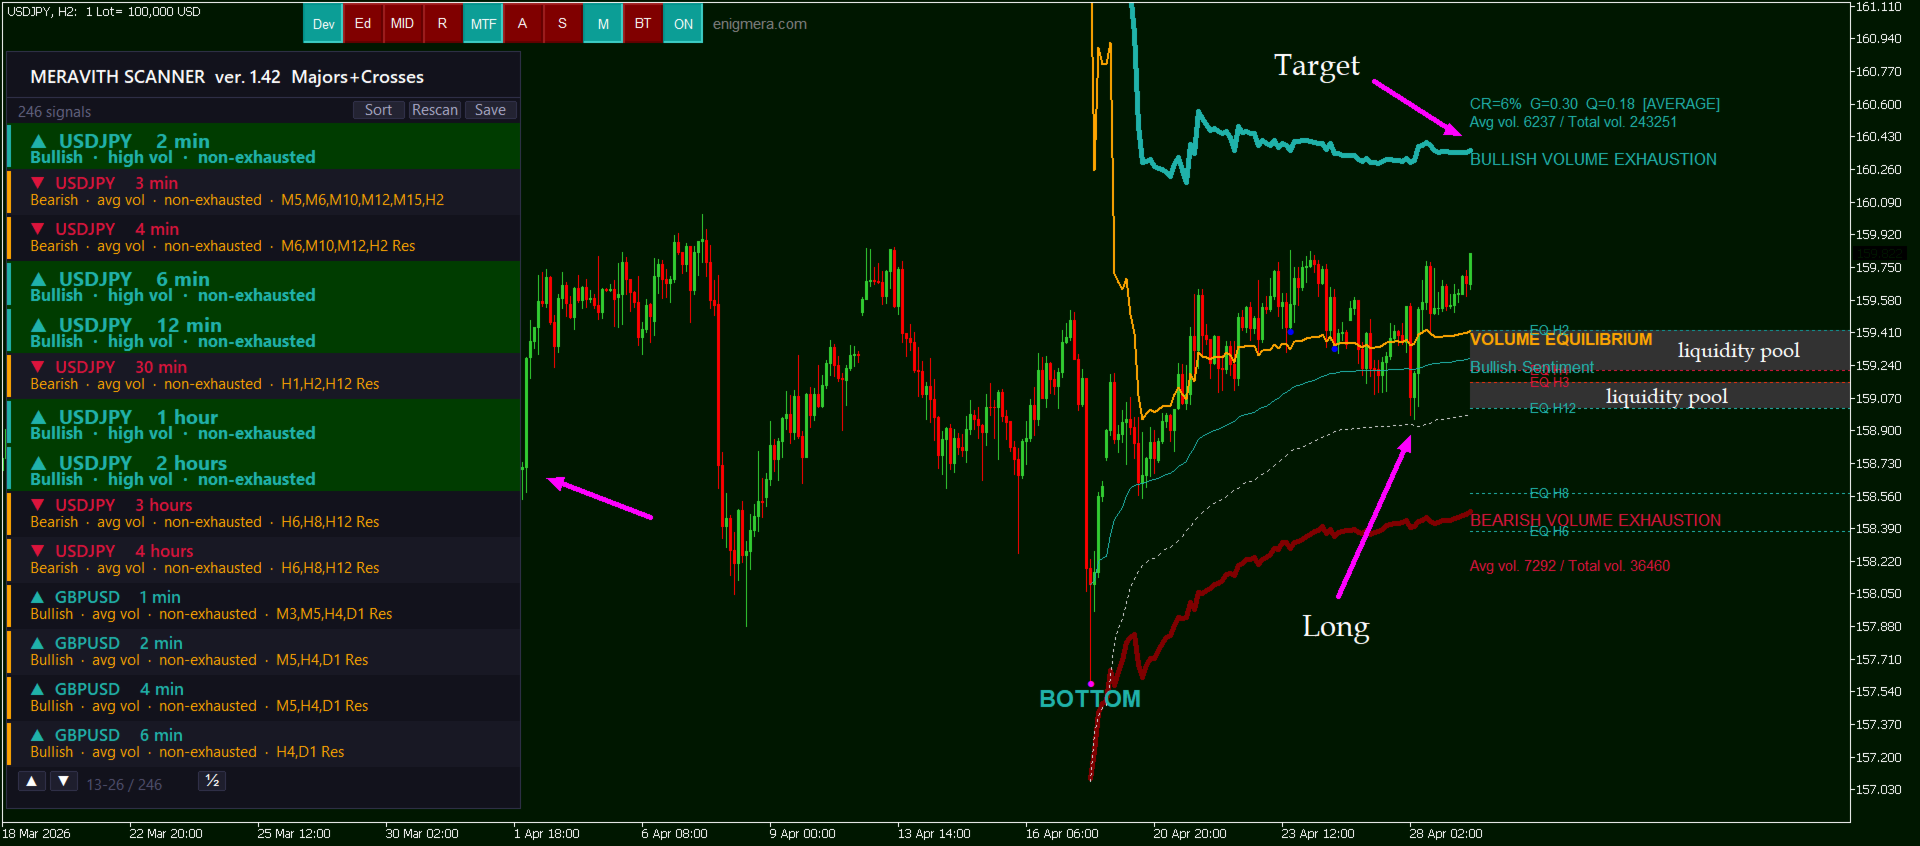
Exhaustion Lines:方向性の出来高が消耗したポイントを示す太い実線です。緑の太線は強気消耗レベル(上昇目標)、赤の太線は弱気消耗レベル(下降目標)を示します。これらのレベルは順次表示され、最大12レベルまであります。新しいレベルは前のレベルに価格が到達してから表示されます。レベルの表示が止まると、動きは完全消耗に近づいています。

Volume Equilibrium Line:最も高い強気消耗レベルと最も低い弱気消耗レベルの中間点を表すオレンジ色の実線です。主要な出来高が集中する流動性軸として機能し、強気トレンドでは動的サポート、弱気トレンドでは動的レジスタンス、またStop Lossの参照点としても機能します。持続的な突破は現在のトレンド仮説を無効化します。

Volume Dots:統計的に有意な出来高のあるローソク足の下に表示されます。青点は2標準偏差を超える出来高で、重要な機関活動を示します。紫点は3標準偏差を超える出来高で、非常に高い信頼度の機関参加を示します。均衡線の片側のみの点はトレンドを確認し、両側に点が現れる場合はレンジ市場の可能性があります。

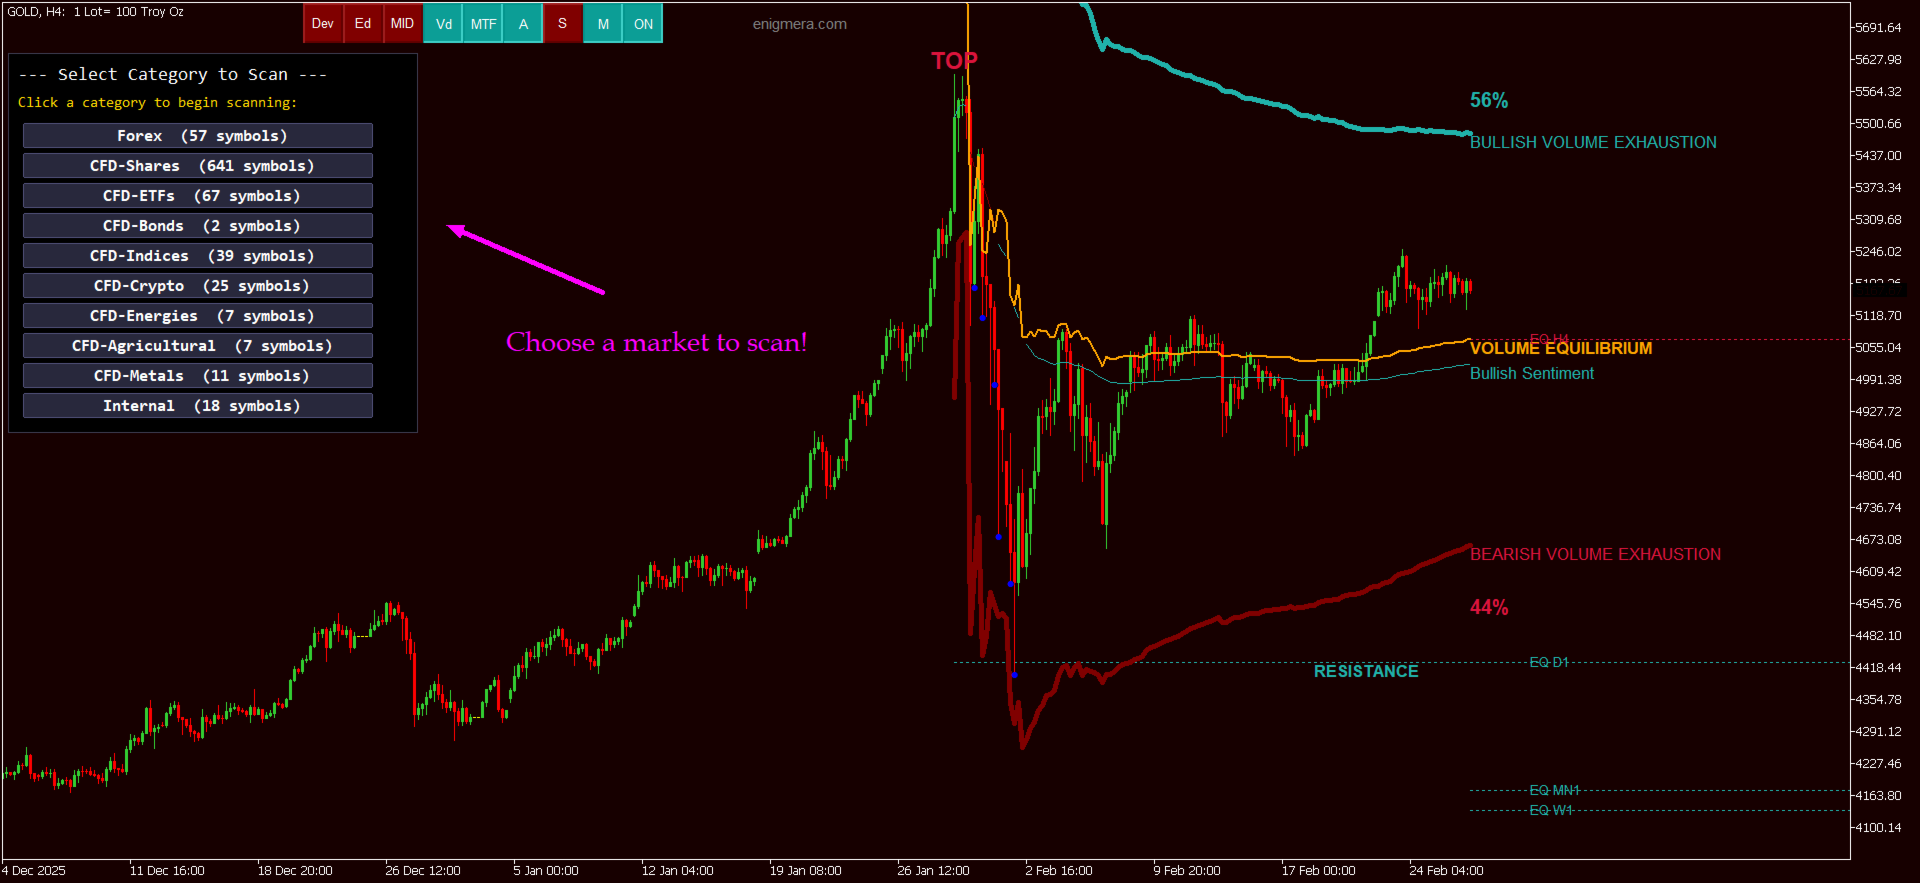
MTF Horizontal Lines:上位時間軸からの破線水平均衡線です。H1チャートではH4、D1、W1、MN1の線が表示されます。緑線はその時間軸で強気トレンド、赤線は弱気トレンドを示します。価格が上位時間軸の均衡線に近づき、トレンドが逆の場合、線が点滅し「RESISTANCE」ラベルが表示されます。

チャート背景色は直感的な方向認識を提供します。濃い緑は強気、濃い赤は弱気を示します。

コントロールボタン

インジケーターにはチャート上部に9つのボタンがあります。緑はアクティブ、濃赤は非アクティブを示します。

  • Dev (Deviation):出来高加重平均からの2倍偏差を表す追加偏差線を描画します。Stop Loss設定や反転ゾーン特定の補助レベルを提供します。

  • Ed (Equilibrium Deviation / Channel):均衡線周囲にボラティリティチャネルを描画します。通常、価格はチャネル内で推移します。チャネル外への突破は異常に強い方向性インパルスを示します。

  • MID (0%、50%、100% Levels):現在のトレンド価格範囲を定義する黄色の破線3本を描画します。50%はリトレースメントの基準として機能します。0%を下回るとトレンド終了の可能性があります。

  • Vd (Volume Dots):青および紫の出来高ドットを表示/非表示切替します。トレンド確認に不可欠で常時オン推奨です。

  • MTF (Multi-Timeframe Lines):上位時間軸の破線均衡線を表示/非表示切替します。下位時間軸では見えない構造的障壁を明示します。常時オン推奨です。

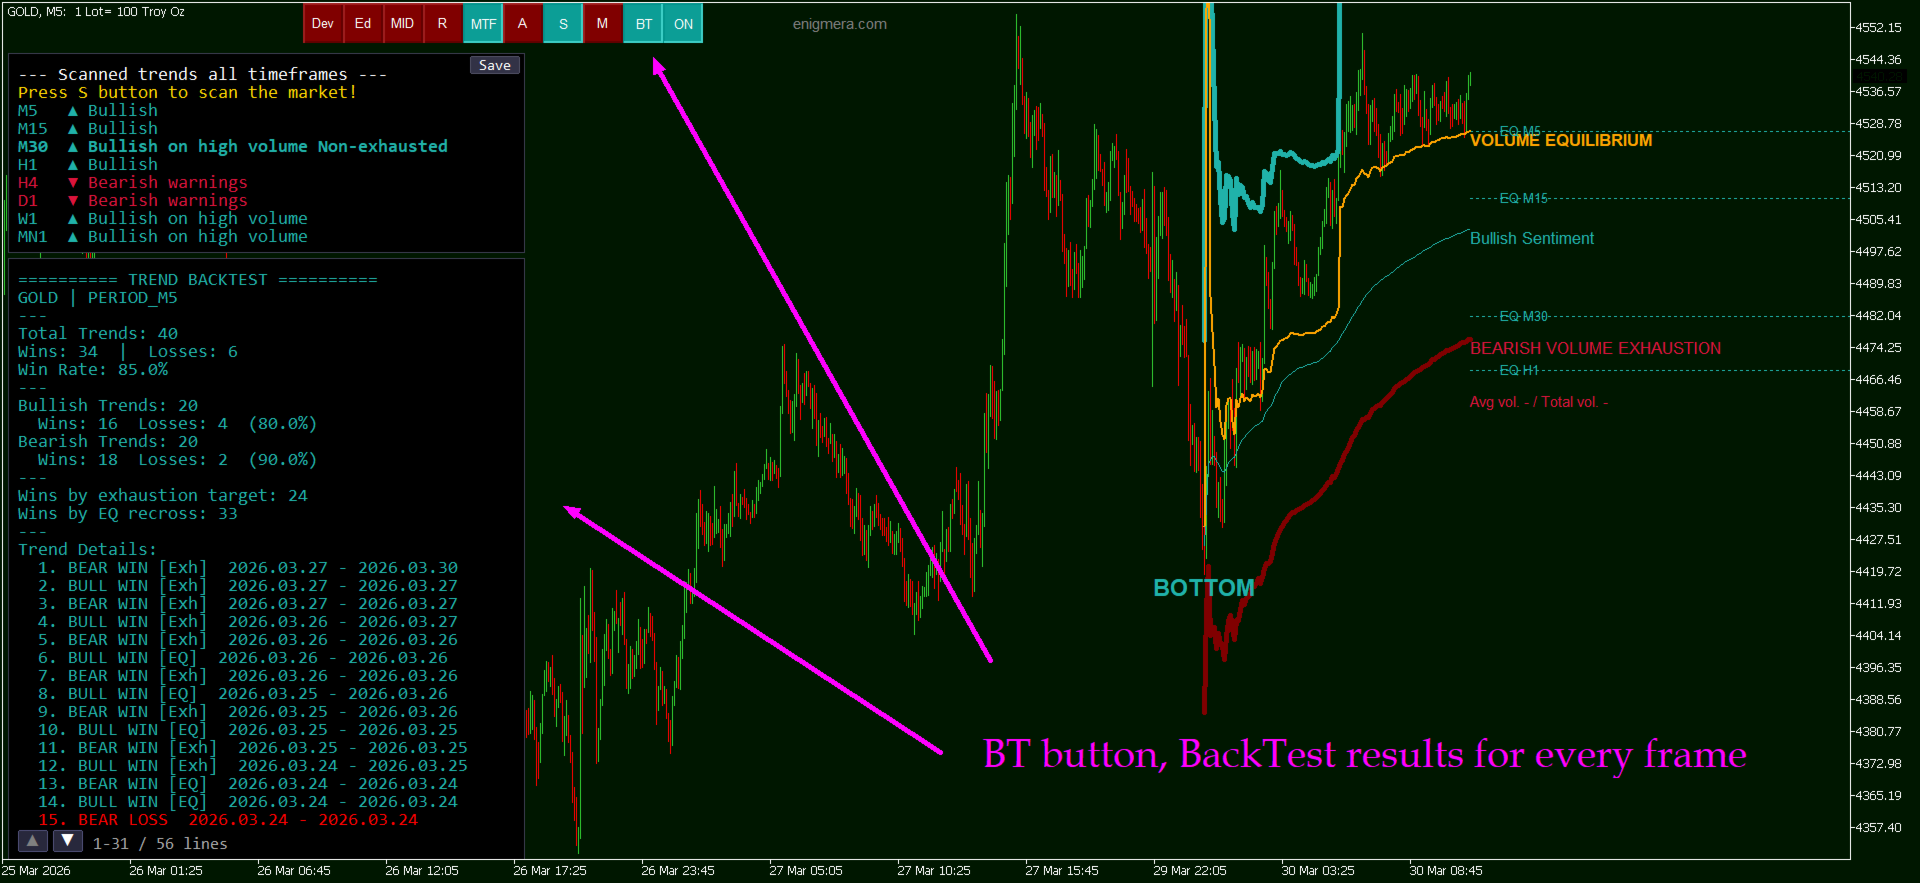
  • A (Analysis):トレンド方向、出来高品質、サポート/レジスタンスレベル、ターゲット、Stop Loss、リスク/リワード比、ポジションサイズ(ロット)、期待利益、上位時間軸の目標レベル、アクティブ警告を含む総合分析パネルを表示します。

  • S (Scan / Multi-Timeframe Trend Summary):現在の時間軸から月足までのすべての時間軸のトレンド方向を表示します。High volumeかつNon-exhaustedの太字行は高信頼度シグナルです。行をクリックするとその時間軸に切り替わります。Copyボタンでテキストファイルに結果をエクスポートできます。

  • M (Market Scanner):ブローカーが提供する全銘柄を9時間軸で自動スキャンする包括的スキャナーです。カテゴリ(FX、指数、暗号、商品など)を選択し、完全分析を実行します。最適条件の銘柄のみ色分けパネルに表示され、クリックで即座にチャート表示。Rescanボタンで現在カテゴリを再スキャン可能です。

  • ON/OFF:インジケーター全体の有効/無効切替。無効時は線・レベル・パネルは非表示、ボタンは表示されます。

アラートシステム

チャート上で三回クリックすると、その価格に黄色の破線アラートラインを作成します。価格到達時、アラートダイアログが表示され、音声通知が再生され、必要に応じてメール、プッシュ通知、スクリーンショット送信が可能です。クリックで削除できます。

設定可能なアラートオプションには、メール通知、モバイルプッシュ通知、均衡線タッチアラート、逆トレンド出来高アラート、初回消耗レベル到達アラートが含まれます。

リスク管理

RiskPercent入力(デフォルト2%)は、1取引あたりの口座資金リスク比率を設定します。分析パネルは自動で適切なロットサイズと予想利益を計算します。

入力パラメータ

  • IndicatorID:同一チャート上で複数インジケーターを競合なく使用可能なユニークID。

  • IgnoreWeekendBars:D1で土日バーを除外。推奨オン。

  • ShowFirstTouchDots:消耗レベル初接触時にダイヤマーカー表示。

  • RiskPercent:1取引あたりのリスク率、デフォルト2%。

  • BlinkVolumeDots:警告発生時に出来高ドット点滅。

  • EnableEmailAlerts:メール通知オン。

  • EnablePushAlerts:モバイルプッシュ通知オン。

  • EnableEquilibriumAlert:均衡線到達時アラート。

  • EnableWrongSideDotAlert:トレンド逆側に出来高ドット出現時アラート。

  • EnableExhaustionAlert:初回消耗線到達時アラート。

  • EnableChartScreenshot:アラート時自動スクリーンショット送信(FTP)。

  • AutoScanTFTrend:全時間軸自動定期スキャン。

  • AutoScanIntervalMin:自動スキャン間隔(分)。

  • ボタン背景色、テキスト色、ラベル色のカスタマイズ。

インジケーターは、ブローカーが提供するすべての銘柄と時間軸で動作します。上位時間軸ほど強力で信頼性の高いレベルを生成します。すべてのレベルはアルゴリズム計算され、同じチャートでMERAVITHを使用する10人のトレーダーが同一レベルを観測できます。消耗レベルは標準偏差に基づき、価格が連続して高い消耗レベルに到達するほど、平均回帰の統計的確率が増加します。
レビュー 2
Mase
1794
Mase 2026.07.04 09:03 
 

like all of Ivans Indicators big value add. In this case its masterpiece, highly recommend it. As always Ivan is very supportive and steady improving, its big joy with him. Big thx Ivan

Valeriu-alexandru Petrache
183
Valeriu-alexandru Petrache 2026.03.24 21:53 
 

The best system on the market. I recommend it with pleasure. Ivan has the best indicators and the most profitable systems. He is a wonderful man, who is happy to help you and who works on improvements every day.

おすすめのプロダクト
Win43 Scalper
Eadvisors Software Inc.
O novo s43 Scalper para Mini-Índice (WIN-IND) faz operações de curto prazo no timeframe 1min buscando pequenas variações do mercado, utiliza nova tecnologia de trade, os resultados no intraday são íncríveis, confira:      Após a instalação adicione no gráfico dos instrumentos win para visualizar os resultados no backteste. Recomendamos o timeframe de 1min.
BTC Quantum AI Scalper PRO MetaTrader 5対応プロフェッショナルビットコインAIトレーディングインジケーター BTC Quantum AI Scalper PROは、古典的なテクニカル分析、市場センチメント分析、そして独自のAIベースの確率エンジンを組み合わせた次世代ビットコイントレーディングシステムです。 移動平均線やオシレーターのみに依存する従来のインジケーターとは異なり、このシステムは複数の主要な市場要因を同時に分析します。 • 恐怖と貪欲指数 • ファンディングレート • ファンディングレートデルタ • 建玉デルタ • ロング/ショート比率 • テイカー買い/売り比率 • ボリュームデルタ • 仮想通貨ニュースセンチメント これらのデータソースに基づき、インジケーターは独自のAIスコアを算出し、最も有望な取引機会のみを特定します。 主な機能 買いシグナルと売りシグナル 確率に基づくトレードフィルタリング TP1とTP2の目標価格設定 動的ストップロス リアルタイムアラートと通知 トレンド確認システム

Mean Reversion Supply Demand Indicator Mean Reversion Supply Demand is the indicator to detect the important supply demand zone in your chart. The concept of supply demand trading relies on the quantity mismatching between buying and selling volumes in the financial market. Typically, supply demand zone serves to predict the turning point. The wave pattern, for any supply demand zone to work as an successful trade, looks like the price must touch the base zone, move away and then return to zone
PR EA - Engulfing Pattern Trading System Automated Engulfing Pattern Detection with MA Confirmation The PR EA is a Meta Trader 5 expert advisor that identifies and trades bullish/bearish engulfing candlestick patterns when confirmed by a moving average filter. Designed for swing trading on 30-minute charts with compatibility for M15 and H1 time frames. Key Features: Pattern Recognition - Detects valid bullish/bearish engulfing candle formations Trend Confirmation - 238-period SMA filter
Manyal trading system, CovEchoTrend Robot, focuses on reliability and flexibility. By employing statistical analysis methods to study the relationships between the base indicator and market patterns, the system enables a deeper understanding of market processes. Intelligent pattern analysis: The application of statistical data processing helps identify key trend reversal points more accurately, signaling significant market shifts. Informed decision-making is based on the intersection of indicato
Flashe
Kodjo Olivier Leonard Daga
FLASHE INDICATOR - La Révolution du Trading Intelligent PRÉSENTATION FLASHE INDICATOR est un système de trading de nouvelle génération qui repousse les limites de l'analyse technique traditionnelle. Développé par l'équipe DovTech, cet indicateur allie intelligence artificielle et algorithmes propriétaires pour offrir une expérience de trading unique. Conçu aussi bien pour le Day Trading que pour le Swing Trading, FLASHE s'adapte à toutes les conditions de marché et à tous les styles de
WARNING: This indicator is distributed EXCLUSIVELY on MQL5.com MT4 version:   https://www.mql5.com/it/market/product/160363 MT5 version:   https://www.mql5.com/it/market/product/160410 MAX RIBBON ver 1.00 The indicator that shows you the TREND clearly and unambiguously! DESCRIPTION MAX RIBBON is an advanced trend indicator that combines two ribbon systems to accurately identify market direction: • MaxRib2 (Fast Ribbon): Responsive to short-term movements, ideal for capturing rapid reversals and
Innovative trading robot Smart Capital: Your reliable partner in the Forex market Smart Capital is an advanced trading robot created for deep analysis of financial markets using specialized algorithms. This robot is designed to evaluate complex market data, which allows it to accurately predict trend changes and make optimal trading decisions. With its help, you can significantly increase the efficiency of your investments. Advantages of Smart Capital Unique analysis system: Smart Capital app
Expert. Automatic and manual trading. Ready-made trading system based on Elliott waves and Fibonacci retracement levels . It is simple and affordable. Display of the marking of Elliott waves (main or alternative option) on the chart. Construction of horizontal levels, support and resistance lines, a channel. Superposition of Fibonacci levels on waves 1, 3, 5, A Alert system (on-screen, E-Mail, Push notifications).    visual panel for opening orders in manual trading. visual panel for setting up
Introduction to Harmonic Pattern Scenario Planner The present state of Forex market can go through many different possible price paths to reach its future destination. Future is dynamic. Therefore, planning your trade with possible future scenario is an important step for your success. To meet such a powerful concept, we introduce the Harmonic Pattern Scenario Planner, the first predictive Harmonic Pattern Tool in the world among its kind. Main Features Predicting future patterns for scenario
このインジケーターは、H.M.Gartley (「株式市場の利益」、1935 年) の開発に従って調和パターン (XABCD) を識別します。 D 点を透視投影の点として投影します (設定で ProjectionD_Mode = true を指定します)。 再描画はしません。 作業時間枠のバーが閉じるとき、特定されたパターン ポイントが Patterns_Fractal_Bars バーの間に移動していない場合、チャート上に (予想される価格変動の方向に) 矢印が表示されます。 この瞬間から、矢印はチャート上に永久に残ります。 連続した 2 ~ 3 つ以上の矢印 - これは市場状況の変化であり、再描画/再描画ではありません (時間枠を前後に切り替えてはなりません)。 注: 2 ~ 3 つ以上の矢印が連続している場合 - これは市況の変化であり、再描画ではありません。 パターンの総数は 85 です (Gartley-222 と Gartley-222WS を含む。完全なリストはコメント セクションにあります)。 識別されたすべてのパターンのうち、最後に識別されたパターンのみがベ


Overview Harmonic Patterns MT5 is a technical analysis indicator designed for the MetaTrader 5 platform. It identifies and displays harmonic price patterns, such as Butterfly, Cypher, Crab, Bat, Shark, and Gartley, in both bullish and bearish directions. The indicator calculates key price levels, including entry, stop loss, and three take-profit levels, to assist traders in analyzing market movements. Visual elements and customizable alerts enhance usability on the chart. Features Detects six ha
SPECIAL LAUNCH OFFER: $30 (1-Month Rent) Limited time offer to build our community and gather feedback! AmbM GOLD Institutional Scalper A high-precision M5 algorithm for XAUUSD (Gold) , engineered to trade exclusively at Institutional Liquidity Levels ($5/$10 psychological marks). PERFORMANCE DATA (BUY ONLY) • Win Rate: 87.09%. • Safe Growth: +$4,113 profit on $10k (13.75% Max Drawdown). • Extreme Stress Test: Successfully generated +$22,997 in a 5-year stress test (2020-2026), proving
M & W Pattern Pro is an advanced scanner for M and W patters , it uses extra filters to ensure scanned patterns are profitable. The indicator can be used with all symbols and time frames. The indicator is a non repaint indicator with accurate statistics calculations. To use , simply scan the most profitable pair using the statistics dashboard accuracy , then enter trades on signal arrow and exit at the TP and SL levels. STATISTICS : Accuracy 1 : This is the percentage of the times price hits TP
SMC Market Structure PRO — Order Blocks, FVG, Liquidity & Confluence Zones Stop guessing. Start reading the market the way the big players see it. SMC Market Structure PRO automatically detects smart money zones of interest on your chart — Order Blocks, Fair Value Gaps (FVG) and time-based imbalances — and highlights Confluence Zones where all three types of structure overlap. That is exactly where price reacts most often. This is a complete market structure analysis tool based on the Smart Mone
The FVG Sessions indicator highlights the first fair value gap of the trading session as well as the session range. Detected fair value gaps extend to the end of the trading session. Alerts are included on the formation of a session fair value gap, price being within a session fair value gap, mitigations, and price crossing session fair value gaps average. Trader ICT states that the first fair value gap of the trading session can attract the most significant reaction. Having only one FVG per
A scalping indicator based on mathematical patterns, which on average gives signals with relatively small SL, and also occasionally helps to catch big moves in the markets (more information in the video) This indicator has three main types of notifications: The first type warns of a possible/upcoming signal on the next bar The second type indicates the presence of a ready signal to enter the market/open a position The third type is for SL and TP levels - you will be notified every time price re
This indicator is, without a doubt, the best variation of the Gann Angles among others. It allows traders using Gann methods to automatically calculate the Gann angles for the traded instrument. The scale is automatically calculated when the indicator is attached to the chart. When switching timeframes, the indicator recalculates the scale for the current timeframe. Additionally, you can enter your own scales for the Gann angles. You can enter your own scales either for both vectors or for each
ENGLISH DESCRIPTION (MQL5 Standard Optimized) Product Name: Obsidian Forest Automaton AI (MT5) [Subtitle: Forest Structure | Obsidian Blade TEMA | Shield Safety] Introduction Obsidian Forest Automaton AI is a structural trend-following construct designed to navigate the market with the cold precision of an automaton. It builds a "Forest Structure" using Ichimoku Cloud , cuts through noise with the Obsidian Blade (TEMA) , and validates density with Standard Deviation . This creates a system that
Uno Quant Trader
Mark Joseph Borromeo Juan
UNO Quant Trader UNO Quant Trader is a premium market-bias and trade-planning indicator built for traders who want cleaner decisions, faster chart reading, and a professional dashboard view. This indicator uses a multi-layer mathematical market model designed to analyze price behavior, momentum pressure, imbalance zones, trend strength, market exhaustion, and high-probability trade areas. Instead of relying on emotion or random entries, UNO Quant Trader helps you read the market using structured
マーケットメーカーのためのツール。 Meravith は次の機能を提供します: すべての時間足を分析し、現在有効なトレンドを表示します。 強気と弱気の出来高が等しくなる流動性ゾーン(出来高均衡)を強調表示します。 異なる時間足のすべての流動性レベルをチャート上に直接表示します。 テキスト形式の市場分析を生成し、参考情報として表示します。 現在のトレンドに基づいて目標値、サポートレベル、ストップロスを計算します。 取引のリスクリワード比を算出します。 口座残高に基づいてポジションサイズを計算し、潜在的な利益を推定します。 また、市場に大きな変化があった場合には警告を表示します。 インジケーターの主要ライン: 強気/弱気の出来高エグゾーストライン ― 目標値として機能します。 市場のトレンドを示すライン。市場が強気か弱気かによって色が変わり、トレンドのサポートとして機能します。主にその色が市場センチメントを示します。 出来高均衡ライン(Eq)。Eq(Volume Equilibrium)ラインはシステムの中核です。これは買い手と売り手の出来高のバランスポイントを表します。市場の流動性を示し
SURMAchannelPROは、動的な価格チャネルと明確なトレンドフォロー信号を生成するプレミアム多機能インジケーターです。滑らかなハル移動平均線(HMA)を中核とし、その周囲に動的なサポートとレジスタンスとして機能する複数のチャネルライン(内側、中間、外側)を構築します。インジケーターはチャネルのブレイクアウト/再エントリー時に視覚的な買い/売りの矢印を表示し、ユーザー定義のチャネル幅のパーセンテージに基づいて、Take Profit(TP)とStop Loss(SL)の水平線を自動的に引きます。主な特徴は、設定された履歴期間内の過去すべての信号のパフォーマンス(合計数、T/P、S/L、利益、損失)を追跡する統合統計パネルです。また、次のバーまでのリアルタイムカウントダウンタイマーも含まれます。 主な特徴: 動的マルチラインチャネル:   主要な上限/下限バンドと、市場構造を精密に分析するためのフィボナッチベースの中間線を生成します。 自動信号とバックテスト:   価格とチャネルの相互作用に基づいて買い(緑)と売り(ピンク)の矢印をプロットします。信号のパフォーマンスの完全な履歴記
Aurex Fibo Scalper is a premium precious metal (Gold, Silver) and forex scalping system. By focusing on the Golden Ratio of Fibonacci projections and incorporating specialized trend filter channels, it identifies strategic daily turning points. Key Features: Golden Ratio Projections: Levels calculated using precise Fibonacci coefficients. Metal Optimization: Tuned for volatile assets like XAUUSD (Gold) and XAGUSD (Silver). Synergy Crossover: Double MA filter to block counter-trend signals. Tradi
Chronos Auto-Adaptive Matrix - Pure Mathematical Precision Tired of fake "AI", "Deep Learning", and "ChatGPT" buzzwords? So are we. Welcome to Chronos Auto-Adaptive Matrix — an honest, transparent, and mathematically rigorous trading system.  === GOD-TIER PRESETS === [SETUP 1] SCALPING MATRIX (Best Overall / Default) Maximum trade frequency and highest profit yield. Very active breakout hunting. - **Breakout Period:** 12 - **Risk per Trade:** 2.0% - **SL / TP Multiplier:** 1.0 ATR / 1.5 ATR
The Rocket Trend indicator is trending. The indicator draws two-color points connected by lines along the chart. This is a trend indicator, it is an algorithmic indicator. It is easy to work and understand when a blue circle appears, you need to buy, when a red one appears, sell. The indicator is used for scalping and pipsing, and has proven itself well. Rocket Trend is available for analyzing the direction of the trend for a specific period of time. Ideal for novice traders learning the laws o
UZFX-Alpha Strike Signals v2.0は、高い確率の取引機会を正確かつ明確に特定するために設計されたプロフェッショナルグレードの市場分析ツールです。この高度な指標は、洗練された価格行動認識と動的なリスク管理可視化を組み合わせ、チャート上に直接明確な買い・売りシグナルを提供します。 注:勝率を高めるには、{ LTL 164343 }インジケーターと組み合わせてご使用ください。 トレンドの判断にはLTLシグナルを、エントリーの判断にはAlphaシグナルをご利用ください。 このアプローチにより、勝率を最大化し、誤ったシグナルを防ぐことができます。 仕組み 本指標は、トレンド反転または継続の可能性を示す特定のローソク足パターンを特定することで市場構造を分析します。これらのパターンが当社独自のアルゴリズム条件と一致した場合、インジケーターは明確な視覚的シグナルを生成します: 買いシグナル(青矢印)は、強気の勢いが検出された市場底値で表示 売りシグナル(赤矢印)は、弱気の圧力が確認された市場天井で表示 トレーダーにとっての主な利点 1. 明確で実行可能なシグナル 解釈の
Disclaimer : Keep in mind that seasonal patterns are not always reliable. Therefore, thoughtful risk management is crucial to minimize losses.  Seasonal patterns in the financial world are like a well-guarded secret that successful investors use to their advantage. These patterns are recurring price movements that occur during specific periods or around special events. Additionally, there are also intraday patterns that repeat. For example, Uncle Ted from Forex Family suggests examining previou
Insight Investor: Advanced Multi-Currency Forex Trading Bot Introduction In the fast-paced world of Forex trading, having the right tools can significantly enhance your trading experience. Insight Investor is an advanced multi-currency trading bot designed to automate and optimize your trading operations. This expert advisor employs modern algorithms to analyze market conditions and execute trades, aiming to deliver consistent results while maintaining controlled risk levels. Key Features of Ins
Master Editionは、ボリュームとマネーフローの視点を通じて市場構造を可視化するために設計されたプロフェッショナルグレードの分析ツールです。標準のボリュームインジケーターとは異なり、このツールはチャート上に日足ボリュームプロファイルを直接表示し、価格発見がどこで行われたか、そして「スマートマネー」がどこに位置しているかを正確に確認できます。 このMaster Editionは、明確さとスピードを考慮して設計されており、ロード時にチャートレイアウトを即座に美化するユニークな自動テーマ同期システムを備えています。 主な機能: 真のマネーフロー計算: 標準のティックボリュームを超えます。「Use Money Flow」を有効にすると、ボリュームは価格によって重み付けされ、特定の価格レベルでの実際の資本コミットメントが明らかになります。 バリューエリア (VA) の可視化: バリューエリア(デフォルトではボリュームの70%)を自動的に計算します。 VA Fill: コントロールゾーンを即座に識別するために、バリューエリアの背景をシェーディングします。 主要レベル: コントロールポイン
Sonic R Pro Enhanced EA - バージョン 2025 249ドル - 最初の5名様限定! ライブシグナル Sonic R Pro Enhancedのライブパフォーマンスを確認: トレード戦略 Sonic R Pro Enhancedは、Dragon Band (EMA 34とEMA 89) を基にした自動トレード戦略の改良版であり、先進的なアルゴリズムを搭載しています。 タイムフレーム: M15, M30 対応通貨ペア: XAUUSD, BTCUSD, AUDJPY, USDJPY トレードスタイル: スイングトレード - リトレースメント & 逆張り 最低資金: 500 USD レバレッジ: 1:200 以上 ユーザーガイド Sonic R Pro Enhancedはシンプルさを追求しています。設定するのは1つのパラメータ: RiskAmount のみです。 RiskAmount < 0 の場合:口座残高のパーセンテージでリスクを計算 RiskAmount > 0 の場合:1回のトレードあたりの固定リスク金額 (USD) 例: RiskA
このプロダクトを購入した人は以下も購入しています
ARIPoint
Temirlan Kdyrkhan
1 (1)
ARIPoint is a powerful trading companion designed to generate high-probability entry signals with dynamic TP/SL/DP levels based on volatility. Built-in performance tracking shows win/loss stats, PP1/PP2 hits, and success rates all updated live. Key Features: Buy/Sell signals with adaptive volatility bands Real-time TP/SL/DP levels based on ATR Built-in MA Filter with optional ATR/StdDev volatility Performance stats panel (Success, Profit/Loss, PP1/PP2) Alerts via popup, sound, push, or email Cu
PrimeScalping is a powerful trading companion designed to generate high-probability entry signals with dynamic TP/SL/DP levels based on volatility. Built-in performance tracking shows win/loss stats, PP1/PP2 hits, and success rates — all updated live. Key Features: Buy/Sell signals with adaptive volatility bands Real-time TP/SL/DP levels based on ATR Built-in MA Filter with optional ATR/StdDev volatility Performance stats panel (Success, Profit/Loss, PP1/PP2) Alerts via popup, sound, push, or e
SmartScalping is a powerful trading companion designed to generate high-probability entry signals with dynamic TP/SL/DP levels based on volatility. Built-in performance tracking shows win/loss stats, PP1/PP2 hits, and success rates — all updated live. Key Features: Buy/Sell signals with adaptive volatility bands Real-time TP/SL/DP levels based on ATR Built-in MA Filter with optional ATR/StdDev volatility Performance stats panel (Success, Profit/Loss, PP1/PP2) Alerts via popup, sound, push, or e
ScalpPoint is a powerful trading companion designed to generate high-probability entry signals with dynamic TP/SL/DP levels based on volatility. Built-in performance tracking shows win/loss stats, PP1/PP2 hits, and success rates — all updated live. Key Features: Buy/Sell signals with adaptive volatility bands Real-time TP/SL/DP levels based on ATR Built-in MA Filter with optional ATR/StdDev volatility Performance stats panel (Success, Profit/Loss, PP1/PP2) Alerts via popup, sound, push, or emai
MasterTrend Indicator for MT5 A powerful trend-following and signal-evaluation tool MasterTrend   is a custom MT5 indicator that combines Moving Averages and ATR-based risk/reward logic to generate clear buy/sell signals. It visualizes dynamic SL/TP levels, evaluates past trade outcomes, and displays win/loss statistics in a clean on-chart panel. Key features include: Buy/Sell signals based on MA crossovers ATR-based SL/TP1/TP2/TP3 levels with visual lines and labels Signal outcome tracking wit
ARICoin is a powerful trading companion designed to generate high-probability entry signals with dynamic TP/SL/DP levels based on volatility. Built-in performance tracking shows win/loss stats, PP1/PP2 hits, and success rates all updated live. Key Features: Buy/Sell signals with adaptive volatility bands Real-time TP/SL/DP levels based on ATR Built-in MA Filter with optional ATR/StdDev volatility Performance stats panel (Success, Profit/Loss, PP1/PP2) Alerts via popup, sound, push, or email Cust
Euro Escalper — Puro no Kikan Toshi Sukyarupingu Injikeeta Euro Escalper wa, subete no entori de kikan toshi reberu no seido wo motomeru toreedaa no tame ni sekkei sareta kooseinou torihiki injikeeta desu. Gousei Shisuu (Deriv), Forex, oyobi MetaTrader 5 de riyou kanou na subete no shisan de kinoushimasu. Fibonacci beisu no ryuudousei zoon, naizou SuperTrend enjin, oyobi riaru taimu no purofesshonaru dasshubooddo wo kumiawasemasu. Shuyo na Riten Sai Egaki Nashi: Shingou yajirushi wa rousoku ashi
Классификатор силы тренда. Показания на истории не меняет. Изменяется классификация только незакрытого бара. По идее подобен полной системе ASCTrend, сигнальный модуль которой, точнее его аппроксимация в несколько "урезанном" виде, есть в свободном доступе, а также в терминале как сигнальный индикатор SilverTrend . Точной копией системы ASCTrend не является. Работает на всех инструментах и всех временных диапазонах. Индикатор использует несколько некоррелируемых между собой алгоритмов для класси
FFx Universal Strength Meter PRO is more than a basic strength meter. Instead of limiting the calculation to price, it can be based on any of the 19 integrated strength modes + 9 timeframes. With the FFx USM, you are able to define any period for any combination of timeframes. For example, you can set the dashboard for the last 10 candles for M15-H1-H4… Full flexibility! Very easy to interpret... It gives a great idea about which currency is weak and which is strong, so you can find the best pai
The FFx Universal MTF alerter shows on a single chart all the timeframes (M1 to Monthly) with their own status for the chosen indicator. 9 indicators mode (MACD-RSI-Stochastic-MA-ADX-Ichimoku-Candles-CCI-PSAR). Each can be applied multiple times on the same chart with different settings. Very easy to interpret. Confirm your BUY entries when most of the timeframes are showing green color. And confirm your SELL entries when most of the timeframes are showing red color. 2 Alert Options : input to s
The FFx Watcher PRO is a dashboard displaying on a single chart the current direction of up to 15 standard indicators and up to 21 timeframes. It has 2 different modes: Watcher mode: Multi Indicators User is able to select up to 15 indicators to be displayed User is able to select up to 21 timeframes to be displayed Watcher mode: Multi Pairs User is able to select any number of pairs/symbols User is able to select up to 21 timeframes to be displayed This mode uses one of the standard indicators
FFx Patterns Alerter gives trade suggestions with Entry, Target 1, Target 2 and StopLoss .... for any of the selected patterns (PinBar, Engulfing, InsideBar, OutsideBar) Below are the different options available: Multiple instances can be applied on the same chart to monitor different patterns Entry suggestion - pips to be added over the break for the entry 3 different options to calculate the SL - by pips, by ATR multiplier or at the pattern High/Low 3 different options to calculate the 2 TPs -
MetaTrader 4 version available here : https://www.mql5.com/en/market/product/24881 FFx Basket Scanner is a global tool scanning all pairs and all timeframes over up to five indicators among the 16 available. You will clearly see which currencies to avoid trading and which ones to focus on. Once a currency goes into an extreme zone (e.g. 20/80%), you can trade the whole basket with great confidence. Another way to use it is to look at two currencies (weak vs strong) to find the best single pairs
MetaTrader 4 version available here: https://www.mql5.com/en/market/product/25793 FFx Pivot SR Suite PRO is a complete suite for support and resistance levels. Support and Resistance are the most used levels in all kinds of trading. Can be used to find reversal trend, to set targets and stop, etc. The indicator is fully flexible directly from the chart 4 periods to choose for the calculation: 4Hours, Daily, Weekly and Monthly 4 formulas to choose for the calculation: Classic, Camarilla, Fibonac
Recommended TimeFrame >= H1. 100% Non Repainted at any moment.  Use it carefully, only with Trend Direction. Trading Usage: 2 Variants: as Range System or as BreakOut System (Both Only With Trend Direction)::: (Always use StopLoss for minimise Risk); [1] as Range System: (Recommended) in UP TREND:  - BUY in Blue Line , then if price goes down by 50 points (on H1) open Second BUY.   Close in any Profit you wish: TrailingStop(45 points) or Close when Price touches upper Gold Line. in DOWN TREND
This indicator is based on the crossing of two Moving Average with the RSI It is intended for scalpers Specially designed for Boom and Crash syhtetic indices from Binary.com/Deriv.com It is easy to use and intuitive. We recommend its use on M1 and is equipped with three types of notification Email alert Sound notification Push notification these parameters can be activated and deactivated.
Magicx
Hasan Abdulhussein
The indicator places a buy or sell signal when the conditions of the strategy it was designed with are met. The strategy is guaranteed, strong, and has been tested for 9 years. The indicator is for binary options and can be converted into a bot by linking it to MT2Trading, where it sends the signal to this platform. This platform automatically opens a trade on the trading platform you are using, whether it is Pocket Option, IQ Option, or any other binary options platforms. The entry is on the n
CBT Quantum Maverick 高効率バイナリーオプション取引システム CBT Quantum Maverickは、高いパフォーマンスとシンプルさを追求するトレーダー向けに設計されたバイナリーオプション取引システムです。カスタマイズの必要がなく、最適化された状態で使用を開始できます。シグナルに従うだけで、少しの練習でマスターできます。 主な特徴: シグナルの精度: 現在のローソク足を基に次のローソク足の取引シグナルを生成し、頻繁な再描画がありません。 多様な市場対応: バイナリーオプション取引に特化し、さまざまなブローカーや資産クラスに対応しています。 対応可能: Deriv Synthetic Charts :すべてのタイムフレームで使用可能。 OTCチャート :Quotex、PocketOption、Binomo、Stockity、IQOption、Exnova、OlympTrade、Deriv、Binolla、Homebrokerなどのブローカーに対応。MT5へのインポートは最初の1週間無料、その後は有料サービス。 FX、仮想通貨、商品市場 :幅広い資産利用が可能
This strategy focuses on identifying and following clear market trends by filtering out noise and short-term fluctuations. Using advanced algorithms, it highlights significant upward and downward movements, enabling traders to make data-driven decisions. The indicator is designed for simplicity and precision, ideal for traders who prefer a systematic approach to trend trading. Whether you're a beginner or an experienced trader, this tool helps you stay aligned with the dominant market direction
PRICE WILL BE INCREASED TO £4999 SOON! 5 or 15 MINUTE CHART ONLY: A state-of-the-art trading indicator, designed with advanced analytical and mathematical programming, delivers top-tier buy and sell signals. Simply enter a small buy position when a green arrow appears and a small sell position when a red arrow is shown. While signals from this indicator are infrequent, they boast exceptional accuracy when generated. Please apply your own stop-loss and take-profit levels as needed.
مؤشر Smart Trend Candles هو أداة فعّالة في منصة MetaTrader 4، تجمع بين عناصر تحليل فني متعددة لتحديد اتجاهات السوق وقياس قوة المشترين والبائعين. يوفر هذا المؤشر متعدد الاستخدامات إشارات مرئية واضحة تُحسّن قرارات التداول الخاصة بك. الميزات الرئيسية 1. تحديد الاتجاه يستخدم شموع Heikin-Ashi المعدلة (اختياري) لتصفية ضوضاء السوق يتضمن متوسطًا متحركًا (فترة قابلة للتكوين) لتأكيد الاتجاه تنفيذ مؤشر القوة النسبية لقياس الزخم 2. قياس القوة تشير الشموع المرمزة بالألوان إلى شدة ضغط الشراء/البيع تحليل الحج
Trend Frequency Market MT5 Carry out analysis and backtest even before opening your orders, check the strategy's Winrate and stay in favor of the Trend and the strength of the movement. The TFM indicator is specialized in providing you with the strength points of the movement, painting the candles GREEN or RED to report price aggression from the Players who are acting at the exact moment. Taking advantage of this detection, the indicator plots Arrow and Entry, Stop Loss and Take Profit levels
PRICE WILL BE INCREASED TO £4999 SOON! Knight Rider FX is a precision-engineered trading indicator that delivers highly accurate, non-repainting signals without flooding your chart. It filters out noise and selectively highlights only the highest probability trade setups. On higher timeframes, it anticipates major market reversals, while on intraday charts it pinpoints mini reversals with tactical clarity. By focusing on quality over quantity, Knight Rider FX equips traders with disciplined ent
AriX
Temirlan Kdyrkhan
1 (4)
AriX Indicator for MT5 A powerful trend-following and signal-evaluation tool AriX is a custom MT5 indicator that combines Moving Averages and ATR-based risk/reward logic to generate clear buy/sell signals. It visualizes dynamic SL/TP levels, evaluates past trade outcomes, and displays win/loss statistics in a clean on-chart panel. Key features include: Buy/Sell signals based on MA crossovers ATR-based SL/TP1/TP2/TP3 levels with visual lines and labels Signal outcome tracking with real-time stat
Screens realtime-  https://t.me/ +rEuJQo8zHLllMzgy Signals.Metals.etc This tool is designed to detect anomalies in market trading activity. It analyzes price movements and volumes to identify moments of unusually strong buying or selling pressure. Such periods are often followed by a cooling phase or consolidation, providing traders with valuable reference points for decision-making.  The indicator requires no complex setup and is suitable for both experienced traders and beginners. Screensho
Screens realtime-  https://t.me/ +rEuJQo8zHLllMzgy in Signals.Metals.etc VI Calculator  is a professional MetaTrader 5 indicator that analyzing volume at the moment. This synergy allows traders to evaluate both the strength of market movements and overbought/oversold conditions at the same time. The indicator automatically processes market data and provides clear trading signals directly on the chart in the form of arrows and text recommendations. It is ideal for identifying entry and exit p
TrendCatcherBot: Find Your Edge in the Market Don't guess the trend—catch it. The TrendCatcherBot is an Expert Advisor designed for MetaTrader 5 that simplifies your trading strategy. By leveraging the power of moving average crossovers, this bot provides clear, visual signals directly on your chart, so you always know when to act. Watch for the unmistakable green, red, and black dots in the corner of your screen to instantly see if the market is signaling a buy, sell, or hold. It's the perfect
Introducing the Ultimate Trend-Following Indicator: Precision Signals at Your Fingertips In a market saturated with "black-box" systems and cluttered, confusing charts, clarity is the ultimate advantage. Alpha Seeking Bull strips away the noise, distilling complex market analysis into a single, high-fidelity visual cue. Whether you are a seasoned day trader or just starting your journey, this indicator is engineered to provide the confidence you need to execute trades with surgical precision. Th
WELCOME TO THE ULTIMATE TRADING REVOLUTION!   Are you tired of lagging indicators, fakeouts, and leaving massive profits on the table? It’s time to stop guessing and start sniping! Introducing Dubai Sniper Ultra Strategy, the most powerful, highly-optimized trend-following and reversal indicator meticulously engineered for MetaTrader 5. This isn't just another indicator—this is your ultimate weapon to dominate the markets, especially built to crush indices like SPX500, Gold, and Major Forex pair
作者のその他のプロダクト
KAMA Confluence Engine トレンドに沿って取引し、反転した瞬間にエントリー、ストップ、ターゲットを即座に把握する。 KAMA Confluence Engine は、カウフマン適応型移動平均(KAMA)を中心に構築されたオールインワンのトレンド指標であり、ティック出来高の加重、マルチタイムフレーム確認、自動トレードレベルを組み合わせています。市場環境に応じて適応し、トレンド時は素早く反応し、レンジ時はノイズを抑えて安定した動きを示します。常に「正しい側」に立てるよう設計されています。 特徴 出来高加重型アダプティブエンジン 実際のティック出来高が増えると KAMA ラインが加速し、出来高が減ると減速します。強いトレンドに乗り、偽の動きを避けることができます。 視認性の高いネオンリボン 明るく滑らかなラインで、下に濃い影が描かれています。緑=上昇、赤=下降、灰色=レンジ/ノートレード。遠くからでも一目でトレンドが分かります。 トレンドカラーのローソク足 ローソク足自体がトレンド色に塗られ、チャート全体が一つのストーリーとして視覚的にまとまります。 自動エントリー/SL
このインジケーターは、市場で 関心が示されたゾーン をハイライトし、その後に 注文の蓄積ゾーン を表示します。 これは、大規模な**板情報(オーダーブック)**のように機能します。 これは、 巨大な資金 のためのインジケーターです。その性能は卓越しています。 市場にどんな関心が存在していても、 必ず目に見えるようになります 。 (これは 完全に再設計され、自動化されたバージョン です。もはや手動分析は必要ありません。) トランザクションスピード(取引速度) は新しい概念のインジケーターで、市場で大口注文が どこに・いつ 集中しているかを示し、それに基づいたチャンスを提供します。 トレンドの変化を 非常に早い段階 で察知することができます。 FXでは「出来高」と呼ばれているものは誤解されています。実際には、これは 時間あたりの価格変動量 です。したがって、正しい名称は トランザクションスピード です。 考え方・行動・分析の仕方すべてが問われます。 分析パラダイムの転換は非常に重要です。 このインジケーターは、FXにおける出来高の考え方を 根本から再定義 し、論理的な形で正確に活用する、
このインディケータは、選択した期間における強気と弱気の不均衡を測定し、2 点間の直線を示す。 強気派が弱気派より出来高が多ければ、線は緑色に変わる。 ベアの方が出来高が多い場合、線は赤になる。 線は、出来高の差のパーセンテージも示します。 このインジケーターは、同じデータを別ウィンドウで表示します。また、分割された出来高を見ることもできます。 このインジケーターには2つのモードがあります。 そのために、左上にボタンがあります、  - ボタンを押さなければ、市場の任意のポイントと現在の価格との間の不均衡を測定します。 - ボタンを押すと、市場の任意の2点間のバランスを測定できます。 このインディケータは、選択した期間における強気と弱気の不均衡を測定し、2 点間の直線を示す。 強気派が弱気派より出来高が多ければ、線は緑色に変わる。 ベアの方が出来高が多い場合、線は赤になる。 線は、出来高の差のパーセンテージも示します。 このインジケーターは、同じデータを別ウィンドウで表示します。また、分割された出来高を見ることもできます。 このインジケーターには2つのモードがあります
このインジケーターは、価格の動きとMACDヒストグラムの間の強気および弱気のダイバージェンスを正確に識別します。使用する指数移動平均(EMA)の期間は、5(速い)、34(遅い)、および信号線の期間は5です。このインジケーターは、モメンタムが弱まるポイントを強調表示し、トレンドの反転の可能性を示唆します。 正しいダイバージェンスの識別ルール: 強気のダイバージェンスは、価格がより低い安値を形成し、MACDヒストグラムがゼロラインの上で同時により高い安値を形成する場合に有効です。 弱気のダイバージェンスは、価格がより高い高値を形成し、MACDヒストグラムがゼロラインの下で同時により低い高値を形成する場合に有効です。 ヒストグラムの極値と価格の極値がゼロラインの同じ側に一致していない場合、ダイバージェンス信号は無効となります。これは誤った信号を引き起こす可能性があります。 このアプローチは、MACDダイバージェンス分析を適用するための最も正確で信頼性の高い方法です。 インジケーターの特徴: 確認された強気および弱気のダイバージェンスを明確にマークします。 MACDダイバージェンス検証ルール
FREE
マーケットメーカーのためのツール。 Meravith は次の機能を提供します: すべての時間足を分析し、現在有効なトレンドを表示します。 強気と弱気の出来高が等しくなる流動性ゾーン(出来高均衡)を強調表示します。 異なる時間足のすべての流動性レベルをチャート上に直接表示します。 テキスト形式の市場分析を生成し、参考情報として表示します。 現在のトレンドに基づいて目標値、サポートレベル、ストップロスを計算します。 取引のリスクリワード比を算出します。 口座残高に基づいてポジションサイズを計算し、潜在的な利益を推定します。 また、市場に大きな変化があった場合には警告を表示します。 インジケーターの主要ライン: 強気/弱気の出来高エグゾーストライン ― 目標値として機能します。 市場のトレンドを示すライン。市場が強気か弱気かによって色が変わり、トレンドのサポートとして機能します。主にその色が市場センチメントを示します。 出来高均衡ライン(Eq)。Eq(Volume Equilibrium)ラインはシステムの中核です。これは買い手と売り手の出来高のバランスポイントを表します。市場の流動性を示し
KAMA Confluence Engine トレンドに沿って取引し、反転した瞬間にエントリー、ストップ、ターゲットを即座に把握する。 KAMA Confluence Engine は、カウフマン適応型移動平均(KAMA)を中心に構築されたオールインワンのトレンド指標であり、ティック出来高の加重、マルチタイムフレーム確認、自動トレードレベルを組み合わせています。市場環境に応じて適応し、トレンド時は素早く反応し、レンジ時はノイズを抑えて安定した動きを示します。常に「正しい側」に立てるよう設計されています。 特徴 出来高加重型アダプティブエンジン   実際のティック出来高が増えると KAMA ラインが加速し、出来高が減ると減速します。強いトレンドに乗り、偽の動きを避けることができます。 視認性の高いネオンリボン   明るく滑らかなラインで、下に濃い影が描かれています。緑=上昇、赤=下降、灰色=レンジ/ノートレード。遠くからでも一目でトレンドが分かります。 トレンドカラーのローソク足   ローソク足自体がトレンド色に塗られ、チャート全体が一つのストーリーとして視覚的にまとまります。 自動エン
FREE
RSI Divergence Pulse は、ダイバージェンス検出、マルチタイムフレーム分析、視覚ツールを1つの軽量アプリケーションに統合した包括的なRSIインジケーターです。RegularおよびHiddenダイバージェンスを自動的に識別し、ライブマルチタイムフレームRSIパネルを表示し、OB/OSゾーンを視覚的に認識しやすく塗りつぶし、価格チャートとRSIサブウィンドウの両方にダイバージェンス線を描画し、Buy/Sell矢印を配置し、リアルタイムアラートを提供します。 Features Color-Coded RSI Line RSIラインは現在のゾーンに基づいて色が変わります。青は中立ゾーン(30〜70)を示します。緑はオーバーボートゾーン(70以上)を示します。赤はオーバーソールドゾーン(30以下)を示します。 RSI Signal Line RSIのSMA(デフォルト期間9)がシグナルラインとして機能します。RSIとシグナルのクロスオーバーがタイミング情報を提供します。差分(Diff)はダッシュボードに表示されます。 Automatic Divergence Detectio
Enigmera
Ivan Stefanov
5 (9)
ENIGMERA: 市場の中心 重要:MQL5.comのデモはStrategy Testerで実行されており、Enigmeraの機能を完全には反映していない場合があります。詳細については、説明、スクリーンショット、ビデオをご確認ください。質問があれば、遠慮なくメッセージを送ってください! インジケーターのコードは完全に書き直されました。バージョン3.0は新機能を追加し、インジケーターの開始以来蓄積されたバグを修正しました。 紹介 このインジケーターとトレーディングシステムは、金融市場への注目すべきアプローチです。ENIGMERAはフラクタルサイクルを使用して、サポートとレジスタンスのレベルを正確に計算します。真の蓄積フェーズを示し、方向と目標を提供します。トレンドでも修正でも機能するシステムです。 動作方法 インジケーターのほとんどの機能は、チャートの左側にあるボタンで制御され、市場の状況に迅速に対応できるようになっています。 ボタン ON/OFF – インジケーター全体を表示または非表示にします。 Channel – サポートチャネルを有効にし、許容範囲の偏差を示します。 Dev
このインジケーターは、価格の動きとMACDヒストグラムの間の強気および弱気のダイバージェンスを正確に識別します。使用する指数移動平均(EMA)の期間は、5(速い)、34(遅い)、および信号線の期間は5です。このインジケーターは、モメンタムが弱まるポイントを強調表示し、トレンドの反転の可能性を示唆します。 正しいダイバージェンスの識別ルール: 強気のダイバージェンスは、価格がより低い安値を形成し、MACDヒストグラムがゼロラインの上で同時により高い安値を形成する場合に有効です。 弱気のダイバージェンスは、価格がより高い高値を形成し、MACDヒストグラムがゼロラインの下で同時により低い高値を形成する場合に有効です。 ヒストグラムの極値と価格の極値がゼロラインの同じ側に一致していない場合、ダイバージェンス信号は無効となります。これは誤った信号を引き起こす可能性があります。 このアプローチは、MACDダイバージェンス分析を適用するための最も正確で信頼性の高い方法です。 インジケーターの特徴: 確認された強気および弱気のダイバージェンスを明確にマークします。 MACDダイバージェンス検証ルールに
FREE
TIMES はあなたの分析に「時間」という次元を加える指標です。これはトレーディング三位一体の三つ目の要素です。Meravith は公正価格を示し、TransactionSpeed は公正な出来高を示し、そして TIMES は取引活動が「どの時間帯に集中しているか」を示します。これにより、モメンタムが蓄積されているのか、あるいは弱まっているのかが明らかになります。 何を描画するのか:ゾーン(矩形) チャートを線で散らかす代わりに、TIMES は分析結果を価格チャート上に直接描画される色付きの矩形に凝縮します。各矩形は、インジケーター内部の時間構造によって生成された重要な価値ゾーンを示します。これは、取引活動が集中した価格帯であり、市場が反応しやすい領域です。 色の読み方 緑 / ティールの矩形 → 強気ゾーン(ここでモメンタムが形成された。サポート / 継続ゾーンとして機能)。 赤 / クリムゾンの矩形 → 弱気ゾーン(ここでモメンタムが弱まった。レジスタンス / 継続ゾーンとして機能)。 ゾーンの挙動(スマートな部分) 色の反転(ブレイク確定時) 価格がゾーンの片側を完全に抜けて
2 SNAKES  is a first class scalping system. As the entries are quite precise, you are likely to become addicted to this system very quickly.  You have 2 snakes. When you see a candle above or below them that does not touch them - that is your scalping signal. Then buy or sell at the green line or close. If you use a larger time frame, scalping can become trend following. The snakes are calculated precisely in relation to the current state of the market. They ARE NOT moving averages.  You decide
Levelss
Ivan Stefanov
5 (1)
LEVELSSインディケータが示す: - 日足の強気ゾーンと弱気ゾーン。毎日00:00から23:59まで表示。 - 週足の強気・弱気ゾーン。毎週月曜日0:00から金曜日23:59まで表示されます。 - 特定のタイムフレームから特別に計算されたチャネルで、他のすべてのタイムフレームに表示されます。デフォルトでは、これは4時間のタイムフレームで、取引したい他のタイムフレームに変更することができます。これはノンストップで計算されます。 画面の左上には、ゾーンとチャネルが強気、弱気、中立のいずれであるかが表示されています。この3つすべてが強気の場合、現在のローソク足に緑の点が表示されます。3つとも弱気の場合、ピンクの点が表示されます。 このインディケータに制限はありません。
GANNの正確な目標は、彼の時代を超えた方法に基づいて計算され、目の前に提示されます。このツールは、取引をよりスムーズで直感的にするために設計されています。白いラインを上に、または緑のラインを下に動かすことで、なぜGANNの技法が取引の世界で今なお影響力を持っているのかがすぐにわかるでしょう。 GANNの戦略は、市場の動きを高精度で予測することに焦点を当てており、このツールはその力をあなたの手元に提供します。経験豊富なトレーダーであっても、初心者であっても、ラインを操作することで、彼の手法がなぜ時の試練に耐えてきたのかを深く理解することができるでしょう。 GANNの正確な目標は、彼の時代を超えた方法に基づいて計算され、目の前に提示されます。このツールは、取引をよりスムーズで直感的にするために設計されています。白いラインを上に、または緑のラインを下に動かすことで、なぜGANNの技法が取引の世界で今なお影響力を持っているのかがすぐにわかるでしょう。 GANNの戦略は、市場の動きを高精度で予測することに焦点を当てており、このツールはその力をあなたの手元に提供します。経験豊富なトレーダーであっ
Sense
Ivan Stefanov
5 (2)
SENSEは、厳選されたGANN手法とフラクタル計算を組み合わせた自動システムです。このシステムは、どこで取引を開始し、どこで決済するかを教えてくれます。もう複雑な計算に時間を費やす必要はありません。インジケータをインストールするだけです。 基本原則: 価格が白い線の上にある時、市場は強気である。 白い線の上で買い、下で止める 緑線は上値目標 白い線より下にあるときは弱気。 白い線より下で売り、上で止める。 赤線は下値目標 緑または赤の線が二重になっている場合は、強いエリアであることを示す。 なぜSENSEなのか? 利益目標 SENSEは自動的に利益確定のターゲットを設定し、取引の成功を最大化するお手伝いをします。 自動適応: このインディケータは、どのような時間枠に対しても自動的に再計算を行い、手動で調整する必要なく、正確で信頼性の高いシグナルを提供します。 スキャルピングにも最適です。 デモをチェック
Meravith
Ivan Stefanov
5 (3)
マーケットメーカーのためのツール。 Meravith は次の機能を提供します: すべての時間足を分析し、現在有効なトレンドを表示します。 強気と弱気の出来高が等しくなる流動性ゾーン(出来高均衡)を強調表示します。 異なる時間足のすべての流動性レベルをチャート上に直接表示します。 テキスト形式の市場分析を生成し、参考情報として表示します。 現在のトレンドに基づいて目標値、サポートレベル、ストップロスを計算します。 取引のリスクリワード比を算出します。 口座残高に基づいてポジションサイズを計算し、潜在的な利益を推定します。 また、市場に大きな変化があった場合には警告を表示します。 インジケーターの主要ライン: 強気/弱気の出来高エグゾーストライン ― 目標値として機能します。 市場のトレンドを示すライン。市場が強気か弱気かによって色が変わり、トレンドのサポートとして機能します。主にその色が市場センチメントを示します。 出来高均衡ライン(Eq)。Eq(Volume Equilibrium)ラインはシステムの中核です。これは買い手と売り手の出来高のバランスポイントを表します。市場の流動性を示し
The indicator displays support and resistance zones defined logically using the MACD. The entire concept is explained in the video, with specific examples shown. The indicator works on any instruments and timeframes. It does not repaint. After placing it on the chart, please go through all the timeframes sequentially, from monthly to 1-minute, so that all lines load correctly. After that, you can start using it. The concept is unique and has not been seen in other systems or indicators.
FIFTYインジケーターは、手動でレベルを描画する必要がない自動バージョンを提供するようになりました。このバージョンでは、日次、週次、月次、年次のレベルが自動的にチャート上に描画され、精度を確保しながら時間を節約できます。さらに、これらのレベルの表示を切り替えるボタンが用意されており、完全なカスタマイズが可能です。手動操作を好む方のために、無料版のインジケーターも引き続き利用可能で、完全な機能を備えています。トレーダーは、自分の取引スタイルに応じて手動ツールと自動ツールを選択できます。 最も論理的なインジケーターの一つ。 高い信頼性。 FIFTYインジケーターは、手動でレベルを描画する必要がない自動バージョンを提供するようになりました。このバージョンでは、日次、週次、月次、年次のレベルが自動的にチャート上に描画され、精度を確保しながら時間を節約できます。さらに、これらのレベルの表示を切り替えるボタンが用意されており、完全なカスタマイズが可能です。手動操作を好む方のために、無料版のインジケーターも引き続き利用可能で、完全な機能を備えています。トレーダーは、自分の取引スタイルに応じて手動ツ
「Naturu(ナチュル)」は自然の対称性をアルゴリズムとして用いる手動インジケーターです。 シンプルな戦略と隠された知恵でマーケットを制覇しましょう! インジケーターを読み込むと、上側(Top)と下側(Bottom)の2本のラインが表示されます。 ラインを一度クリックするとアクティブ化され、移動させたいローソク足をクリックするだけでその位置に移動できます。 高値ポイントと安値ポイントを設定すると、インジケーターが自動的に以下を計算します: マゼンタのゾーン:ブル(買い勢)とベア(売り勢)の関心が最も接近する、サポート/レジスタンスになりやすいエリア グレーのゾーン:次に注目されるエリア アクア色のライン:ブルの価格目標 ゴールド色のライン:ベアの価格目標 手動インジケーターは完全なコントロールと柔軟性を提供し、リアルタイムの相場状況や個人の直感に応じてラインを調整できます。 価格の動きを自ら深く分析することで、サポートやレジスタンス、チャートパターンの形成を本質的に理解できます。 人間の判断を活かすことで、自動システムが誤認しがちなノイズを除去し、誤シグナルを減らします。 また、自
RSI Divergence Pulse — Smart Divergence Scanner with MTF Panel, Zone Fill, Alerts & Dashboard SHORT DESCRIPTION Professional RSI indicator with automatic Regular & Hidden divergence detection, color-coded RSI line, Multi-Timeframe panel, OB/OS zone fills, Buy/Sell arrows, signal labels, real-time dashboard, and multi-channel alerts. Works on any symbol and timeframe. FULL DESCRIPTION
こちらが 日本語訳 です。追加のコメントは一切ありません。 インジケーターは、マーケットで「関心が示されている」ゾーンを強調表示し、その後に注文の蓄積ゾーンを示します。 Transaction Speed は、大規模なオーダーブックのように機能します。 これは最も大口の資金向けのインジケーターです。性能は卓越しており、市場にどんな関心があっても必ず見えるようになります。 Transaction Speed は新しい概念のインジケーターで、市場で大口注文がどこで、いつ蓄積されているかを示し、その恩恵を得ることができます。非常に早い段階でトレンド転換を検出します。FXでは「出来高」と呼ばれていますが、実際には時間あたりの価格変動であり、正しい名称は「トランザクションスピード」です。考え方、行動、分析方法のすべてが重要であり、パラダイムの転換は極めて重要です。このインジケーターは FX の出来高の概念を完全に再定義し、論理的に正しい形で定義し直すことで、独自かつ精密なツールとなっています。 使い方: デフォルトではインジケーターは自動モードで設定されており、どの時間足でも単独で使用できます
Enigmera MT5
Ivan Stefanov
3.67 (3)
ENIGMERA:市場の核心 (これは手動インジケーターであり、MetaTrader の現在のテスト環境では一部の機能がサポートされない場合があります) イントロダクション このインジケーターおよびトレーディングシステムは、金融市場に対する独自のアプローチを提供します。ENIGMERA はフラクタルサイクルを利用して、サポートおよびレジスタンスレベルを正確に算出します。実際の蓄積フェーズを示し、方向性と目標を明確にします。トレンド相場でも調整局面でも機能するシステムです。 仕組み インジケーターのほとんどの機能は、チャート左側のボタンを通じて操作され、市場の変化に素早く対応できます。 ボタン ON/OFF – インジケーター全体の表示/非表示を切り替えます。 Support – トレンドのメインサポートライン。 Ch – サポートチャネルを有効にし、許容される乖離範囲を示します。 Dev1(第1偏差)– サポート範囲内の価格変動を示し、市場の停滞またはエネルギー蓄積を示唆します。 Dev2(第2偏差)– 偏差間の価格変動を示し、トレンド形成と方向性を示します。 Dev3(第3偏差)–
価格のみに基づいてレベルを計算する、非常に珍しいインジケーターの一つです。このインジケーターは、時間足やトレンド、市場サイクルの影響を受けません。これまでに作られた中で最も論理的なインジケーターの一つです。 FIFTY インジケーターは、現在自動化バージョンとして登場し、レベルを手動で描画する必要がなくなりました。このバージョンでは、日足・週足・月足・年足のレベルが自動でチャートに描画され、正確さと時間の節約を実現します。さらに、各レベルの表示を切り替えるためのボタンも用意されており、完全にカスタマイズが可能です。手動を好む方のために、無料版も引き続き利用可能で、十分に機能します。トレーダーは自分の取引スタイルに応じて、手動と自動のツールを選ぶことができます。 非常に信頼性が高く、強くおすすめします!手動版の FIFTY インジケーターをご希望の方は、お問い合わせください
伝説のウィリアム・ギャン(William Gann)レベルを完全自動で表示するMT5用インジケーター。GANN Masterは日足・週足・月足のデータに基づき、価格が反転またはトレンド継続しやすい重要ゾーンを瞬時にプロットします。 主な機能 ワンクリック期間選択 :Daily/Weekly/Monthlyボタンをクリックするだけで、当日・当週・当月のゾーンを即時表示 自動&手動モード 自動モード :GANN Masterがスイング高値・安値を自動検出し、すべてのギャンレベルを計算 手動モード :チャート上のTopラインとBottomラインをドラッグして任意のスイングポイントを設定、レベルが即座に再計算 強気/弱気レベル :買い/売りそれぞれのレベルを表示。線が接近すると強固なサポート/レジスタンスゾーンを示唆 幅広い銘柄対応 :Forex、貴金属(例:ゴールド)、株価指数、暗号資産など高額商品にも対応。設定でアセットクラスを切り替えるだけでスケールと乗数が自動調整 ユーザーフレンドリーなインターフェース :鮮やかな配色、見やすいラベル、直感的なボタン操作でリアルタイムにレベルを調整 ト
SPEKULATORは、重要なサポートゾーンと市場の方向性を特定するのに役立つ手動取引システムおよびインジケーターです。 シンプルな戦略と隠れた知恵で市場をマスターしましょう。 グラフ上で任意のトップ(TOP)とボトム(BOTTOM)を選択すると、インジケーターは次のように描画します: あなたのトレンドに対するサポートゾーン。 強気トレンドの場合、緑色のゾーンが表示され、弱気トレンドの場合、赤色のゾーンが表示されます。サポートゾーンの感度はインジケーターの設定で調整可能です。このゾーンは、選択したトレンドに基づいてサポートが現れる可能性のある場所を示します。 高い偏差線と低い偏差線 W.D. ガンの9のスクエアに基づいて計算された角度線 取引に入るタイミング: 高い偏差線を上に突破した場合、ロングポジションを取ります。 低い偏差線を下に突破した場合、ショートポジションを取ります。 市場が偏差線の間にある場合、その間で買いと売りを行いながら、サポートゾーンを尊重します。 ガンの角度線は利益確定ゾーンとしてガイドラインとして使用されます。 360度線が重要なレベルです: 価格がその上にある
Naturu
Ivan Stefanov
5 (1)
「Naturu(ナチュル)」は自然の対称性をアルゴリズムとして用いる手動インジケーターです。 シンプルな戦略と隠された知恵でマーケットを制覇しましょう! インジケーターを読み込むと、上側(Top)と下側(Bottom)の2本のラインが表示されます。 ラインを一度クリックするとアクティブ化され、移動させたいローソク足をクリックするだけでその位置に移動できます。 高値ポイントと安値ポイントを設定すると、インジケーターが自動的に以下を計算します: マゼンタのゾーン:ブル(買い勢)とベア(売り勢)の関心が最も接近する、サポート/レジスタンスになりやすいエリア グレーのゾーン:次に注目されるエリア アクア色のライン:ブルの価格目標 ゴールド色のライン:ベアの価格目標 手動インジケーターは完全なコントロールと柔軟性を提供し、リアルタイムの相場状況や個人の直感に応じてラインを調整できます。 価格の動きを自ら深く分析することで、サポートやレジスタンス、チャートパターンの形成を本質的に理解できます。 人間の判断を活かすことで、自動システムが誤認しがちなノイズを除去し、誤シグナルを減らします。 また、自分
市場のボラティリティに応じて計算期間を自動的に調整し、より正確な買われ過ぎ・売られ過ぎのシグナルを提供する高度なモメンタム・オシレーターです。 仕組み このインジケーターは適応型の期間計算を使用しており、ボラティリティが高いときは期間を短くし、低いときは期間を長くします。この動的な調整により、トレンド相場ではより速いシグナルを提供し、レンジ相場ではダマシを減らします。 RSI の値はこの可変期間に基づいて計算されるため、現在の市場状況により敏感に反応します。従来の 30(売られ過ぎ)と 70(買われ過ぎ)の水準を使用しますが、適応型であるため、これらの水準に到達する際の重要性が高まります。 主な特徴: 市場のボラティリティに基づいて計算期間を自動調整 売買タイミングを示す矢印をチャートに表示 カラーオシレーター:50 以上は緑、50 未満は赤 トレンド相場での高速な反応 レンジ相場でのダマシの減少 リペイントなしのインジケーター ― ローソク足確定後に値は固定 すべての時間足およびすべての市場で使用可能
Institutional Sniper — インスティテューショナルオーダーフロー + スマートマネー構造 + 精密シグナル Institutional Sniper は、プロ仕様のトレンドエンジン、サポート/レジスタンスおよび需要/供給ゾーン、スマートマネーコンセプト(BOS / CHoCH + オーダーブロック)、マルチタイムフレームのダッシュボード、そして自動トレードプラン(エントリー/ストップロス/TP1/TP2)をひとつに統合した、完全なオールインワンのチャートインジケーターです。 本ツールはリペイントしない、洗練された高級インターフェースを備えています。 このインジケーターは、すべてのトレーダーが抱える3つの疑問に答えるために設計されています: 市場は今何をしているのか? 重要なレベルはどこにあるのか? どこでエントリーし、どこがターゲットなのか? 機能 トレンドエンジン — ADX と ATR によってフィルタリングされた二重 EMA を使用して市場方向を読み取り、弱く不安定な動きは無視し、実際のトレンドのみを強調します。 レベル(S/R + 需要/供給) — 最もテ
フィルタ:
Mase
1794
Mase 2026.07.04 09:03 
 

like all of Ivans Indicators big value add. In this case its masterpiece, highly recommend it. As always Ivan is very supportive and steady improving, its big joy with him. Big thx Ivan

Valeriu-alexandru Petrache
183
Valeriu-alexandru Petrache 2026.03.24 21:53 
 

The best system on the market. I recommend it with pleasure. Ivan has the best indicators and the most profitable systems. He is a wonderful man, who is happy to help you and who works on improvements every day.

レビューに返信