So Easy Indicator
- Indicators
-
AL MOOSAWI ABDULLAH JAFFER BAQER
 To trade successfully we need to go through the proven path that others had gone and reached!
Here are 17 quotes from such successful investors:
1- Limit your size in any position so that fear does not become the prevailing instinct guiding your judgment.
Joe Vidich - Version: 1.0
- Activations: 5
| • Please test the product in the Strategy Tester before purchasing to understand how it works. • If you face any issues, contact me via private message—I’m always available to help. • After purchase, send me a screenshot of your order to receive a FREE EA as a gift. |
|---|
Unlock a clearer view of the market with the So Easy Indicator, a powerful yet intuitive tool designed to simplify your trading decisions. For just $30, you can add this robust indicator to your MetaTrader platform and start identifying potential market turning points with greater confidence. Forget chart clutter and confusing signals; the So Easy Indicator focuses on the core dynamics of market volatility and momentum to provide clean, non-repainting buy and sell arrows directly on your chart.
The Logic Behind the Signals
The So Easy Indicator is not a black box. Its strength lies in its transparent and logical approach to market analysis, which is based on tracking the rate of change in market volatility. Here is a detailed breakdown of how it works:
-
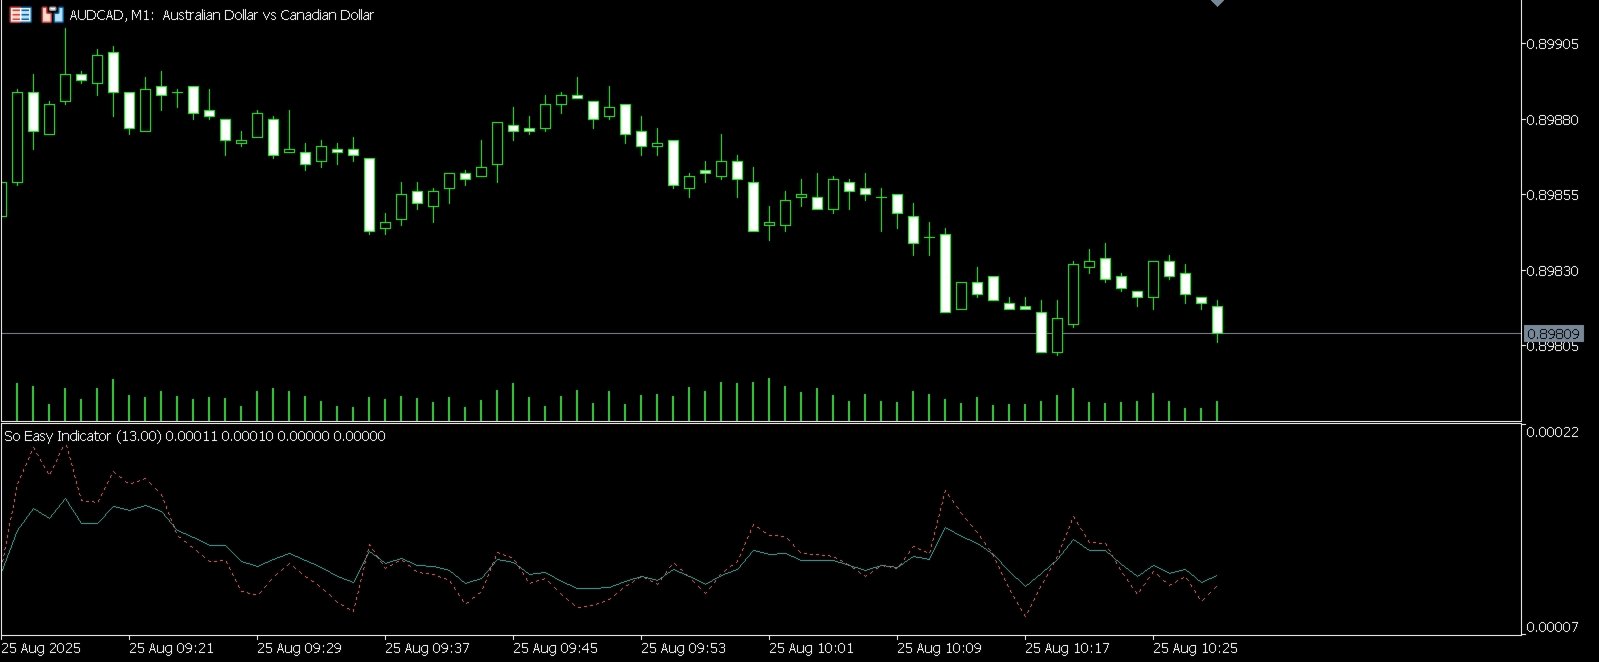
Measuring Market Volatility: At its core, the indicator first calculates the "true range" of each price bar. This is a classic measure of volatility that considers the high, low, and the previous bar's close. It then smooths this data using an Exponential Moving Average (EMA) to create the Range Average line (the green line). This line represents the baseline or the average level of volatility for the period you define.
-
Tracking Volatility Momentum: The indicator goes a step further by calculating the change in volatility from one bar to the next. This "delta" is then also smoothed into an EMA to understand the momentum behind the volatility shifts.
-
Generating the Deviation Line: The key to the signals is the Deviation Offset line (the red dotted line). This line is calculated by taking the baseline volatility (Range Average) and adding the volatility momentum to it. In essence, this line shows you where the volatility is heading based on its recent acceleration or deceleration.
-
The Signal Cross: A trading signal is generated when these two lines cross, indicating a significant shift in market dynamics:
-
A Buy Signal is triggered when the Deviation line crosses above the Range Average line. This indicates that the momentum of volatility is increasing, suggesting that a potential upward move is gaining strength.
-
A Sell Signal is triggered when the Deviation line crosses below the Range Average line. This suggests that the momentum of volatility is waning, signaling a potential loss of steam and a possible downward move.
-
This elegant logic allows the indicator to effectively filter out market noise and pinpoint moments where a real shift in market sentiment is taking place.
Key Features
-
Clear Buy & Sell Signals: Non-repainting arrows provide straightforward entry and exit points, removing guesswork from your trading.
-
Fully Customizable: Easily adjust the averaging period, signal sensitivity, arrow size, colors, and placement to perfectly match your trading strategy and chart aesthetics.
-
Intelligent Signal Filtering: The indicator includes a built-in threshold setting to prevent signals from triggering on insignificant market fluctuations, helping you avoid false positives.
-
Built-in Trade Frequency Control: A unique "Bars Delay" feature allows you to set the minimum number of bars between signals. This is an excellent tool for reducing over-trading and focusing only on the highest-quality setups.
-
Advanced Logging Options: For advanced users, the indicator includes a detailed logging system to monitor its behavior and performance, which can be invaluable for strategy backtesting and optimization.
Who Is This Indicator For?
-
Beginner Traders: The simple and clear visual signals make it an ideal tool for those new to the markets.
-
Experienced Traders: It serves as a powerful confirmation tool that can be integrated into any existing trading system to improve timing and accuracy.
-
Scalpers and Day Traders: The indicator's sensitivity to momentum makes it highly effective for identifying short-term trading opportunities.
Input Parameters
-
Averaging Period: The main period used for the EMA calculations. Higher values result in smoother lines and fewer signals.
-
Signal Threshold: The minimum distance required for a cross to be considered a valid signal. Helps filter out noise.
-
Arrow Size: Adjust the size of the buy and sell arrows (from 1 to 5).
-
Signal Arrow Offset: Controls the distance of the arrow from the indicator line in points.
-
Buy/Sell Signal Color: Customize the colors for the up and down arrows.
-
Enable bars between signals: Turn the signal frequency filter on or off.
-
Bars to wait between signals: Set the minimum number of bars that must pass before a new signal can appear.
Take the next step in your trading journey. Add the So Easy Indicator to your toolkit today and experience a simpler, more logical way to trade.