Visual Multi Frame Volatility Gauge Indicator
- Indicators
- AL MOOSAWI ABDULLAH JAFFER BAQER
- Version: 1.21
- Activations: 5
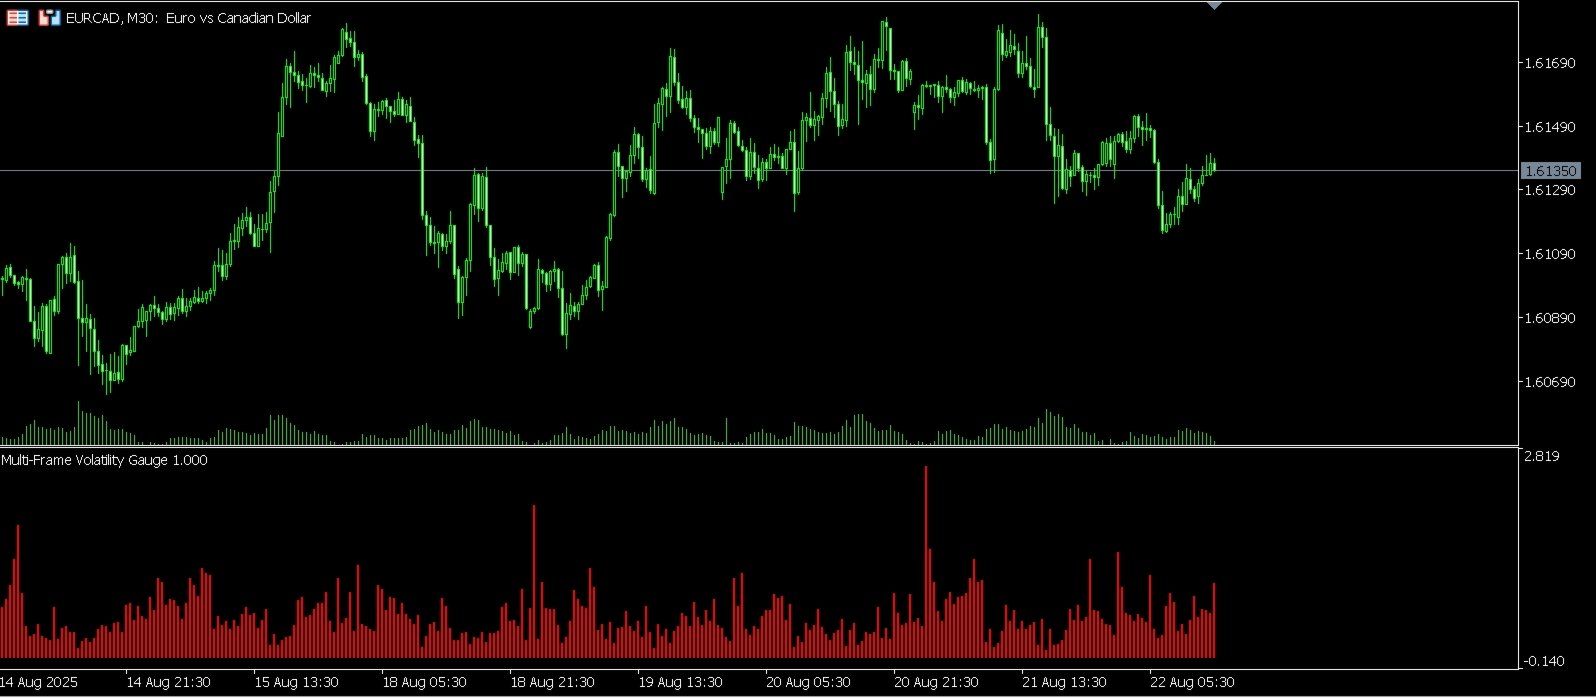
Visual Multi-Frame Volatility Gauge: See Inside the Market's Moves
Unlock a deeper understanding of market dynamics with the Visual Multi-Frame Volatility Gauge. Standard indicators show you what happened, but this powerful tool shows you how it happened. It answers the critical question every trader asks: Is this a strong, directional trend or a volatile, uncertain battle? By visualizing the internal structure of each price bar, you gain a unique edge in confirming trends, spotting exhaustion, and identifying choppy markets.
The Logic Explained in Detail
The core of the Visual Multi-Frame Volatility Gauge lies in a sophisticated comparison between two different timeframes: the timeframe of your current chart and a lower timeframe that you select. It measures price movement on both levels and calculates a ratio to reveal the true nature of volatility.
Here is how it works:
-
Higher Timeframe Measurement: For each candle on your main chart (e.g., a one-hour candle), the indicator first measures its total price movement.
-
Lower Timeframe Measurement: It then looks at all the smaller candles (e.g., fifteen-minute candles) that make up that single one-hour candle. It sums up the price movement of each of these smaller candles individually.
-
The Volatility Ratio: Finally, it divides the summed movement of the lower timeframe candles by the total movement of the single higher timeframe candle.
This ratio is displayed as a simple histogram, giving you an instant visual reading of market efficiency.
-
A low ratio value indicates an efficient, directional move. The price traveled from point A to point B with little deviation. This is characteristic of a strong, healthy trend.
-
A high ratio value indicates an inefficient, volatile move. The price fought back and forth, creating a lot of movement on the lower timeframe but covering little ground on the higher timeframe. This signals indecision, consolidation, or market exhaustion.
How to Use the Gauge for Smarter Trading
-
Trend Confirmation: In a strong uptrend or downtrend, you should see consistently low values on the gauge. This confirms the trend is stable and efficient, giving you the confidence to hold your position.
-
Exhaustion and Reversal Signals: A sudden, sharp spike in the histogram at the peak of a trend is a powerful warning sign. It shows that intense fighting between buyers and sellers is occurring, which often precedes a reversal or a significant pullback.
-
Ranging Market Detection: Persistently high and erratic histogram bars indicate a choppy, sideways market. This is a clear signal to avoid trend-following strategies and consider range-bound tactics instead.
Fully Customizable Features
This indicator is built for flexibility and can be adapted to your specific trading style.
-
Lower Time Frame Selection: You can choose any lower timeframe to compare against your main chart, allowing you to fine-tune the analysis to your preferred trading horizon.
-
Two Volatility Calculation Modes:
-
High Minus Low: This mode measures the full range of each candle, including the wicks. It gives you a complete picture of all price activity.
-
Close Minus Open: This mode focuses only on the candle's body, representing the net momentum of the price move.
-
-
Customizable Alert Level: A visual level line can be set on the histogram, allowing you to instantly see when the internal volatility exceeds your defined threshold.
The Visual Multi-Frame Volatility Gauge is more than just an indicator; it is a new lens through which to view the market, providing clarity and insight that traditional tools cannot offer.