Quarterly Theory ICT Indicator SSMT Divergence MT4
- Indicators
- Eda Kaya
- Version: 1.5
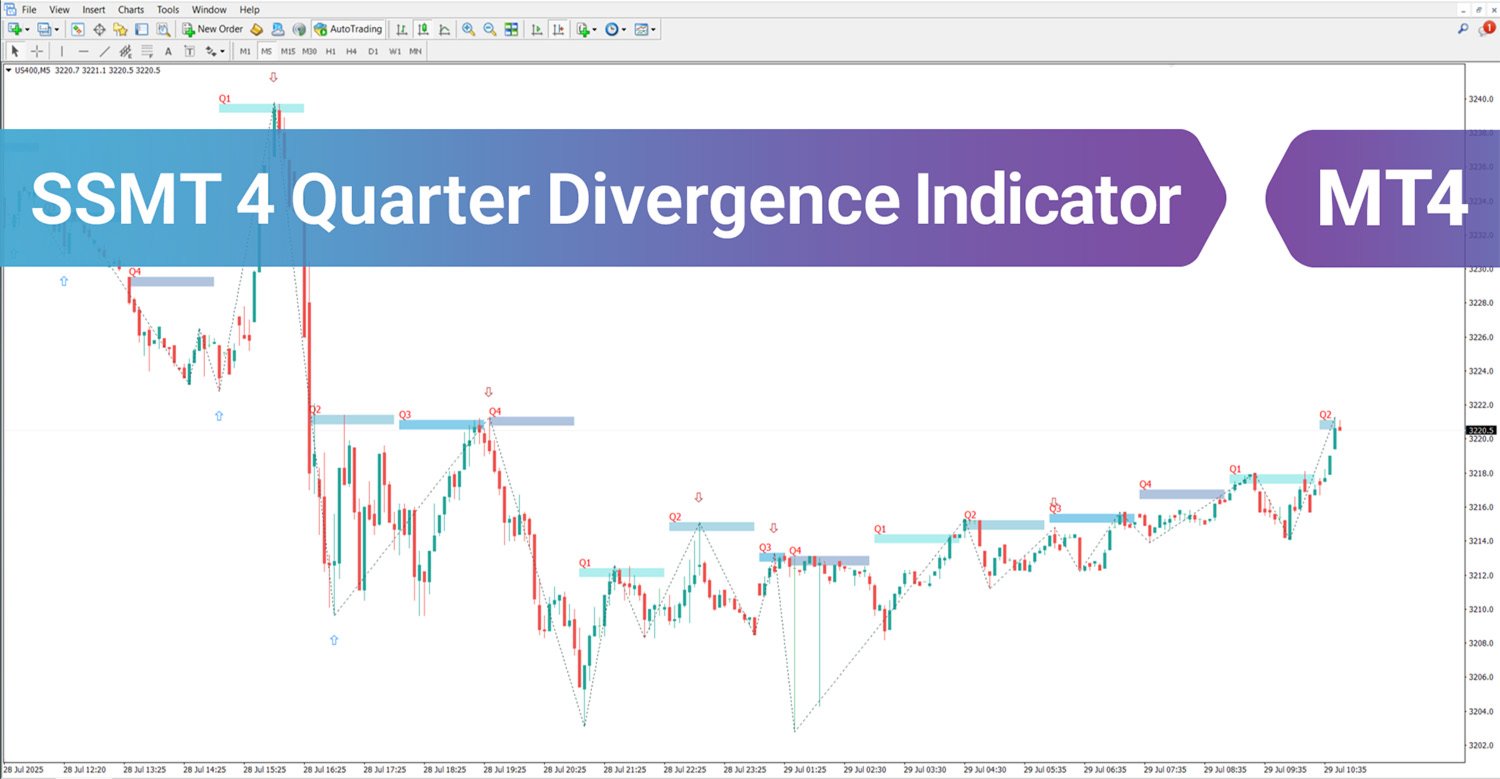
Quarterly Theory ICT 04 SSMT 4 Quarter Divergence Indicator MT4
The SSMT 4 Quarter Divergence Smart Money Sequential Tool is built on advanced principles of technical market analysis, focusing on structural patterns and institutional trading behavior.
By applying detailed time-cycle evaluation and structural mapping, this indicator detects divergence across correlated assets within four distinct quarterly phases (Q1–Q4). To function properly, the tool compares two related instruments, such as NQ100 and US400, making correlation a key requirement.
«Indicator Installation & User Guide»
MT4 Indicator Installation | SSMT 4 Quarter Divergence ICT Indicator MT5 | ALL Products By TradingFinderLab | Best MT4 Indicator: Refined Order Block Indicator for MT4 | Best MT4 Utility: Trade Assistant Expert TF MT4 | TP & SL Tool: Risk Reward Ratio Calculator RRR MT4 | Prop Firm Protector: Prop Draw Down Protector Expert Advisor MT4 | Money Management: Easy Trade Manager MT4
SSMT 4 Quarter Divergence Indicator Table
| Category | ICT – Smart Money – Trading Tool |
| Platform | MetaTrader 4 |
| Skill Level | Advanced |
| Indicator Type | Continuation – Reversal |
| Timeframe | Multi Timeframe |
| Trading Style | Intraday Trading |
| Market Scope | All Markets |
SSMT 4 Quarter Divergence Indicator Overview
This indicator pinpoints critical shift phases by measuring divergence between correlated assets and aligning them with quarterly cycles. When divergences emerge during quarter transitions, the chance of institutional capital flow and possible trend reversals increases significantly.
Final trade confirmation is derived from pivot identification and structural breaks on smaller timeframes. Buy and sell opportunities are highlighted using arrows: blue for bullish setups and red for bearish scenarios.
Indicator in Bullish Market Conditions
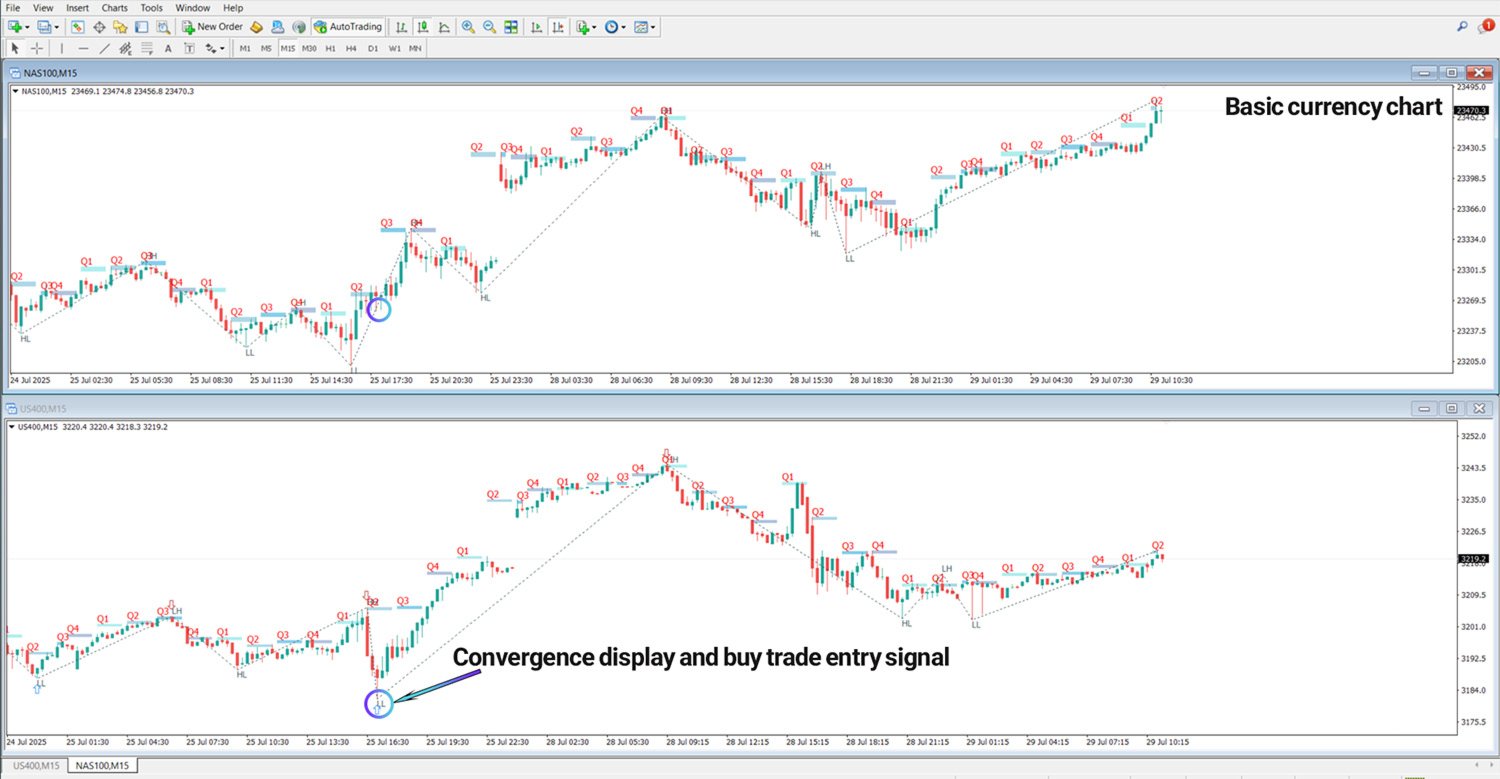
On the 5-minute charts of NAS100 and US400, a bullish divergence develops when US400 pierces the prior swing low while NAS100 maintains structure. This mismatch reflects smart money absorption of selling activity. A confirmed bullish candle and break of lower timeframe structure offer precise long entries, indicated with a blue arrow.
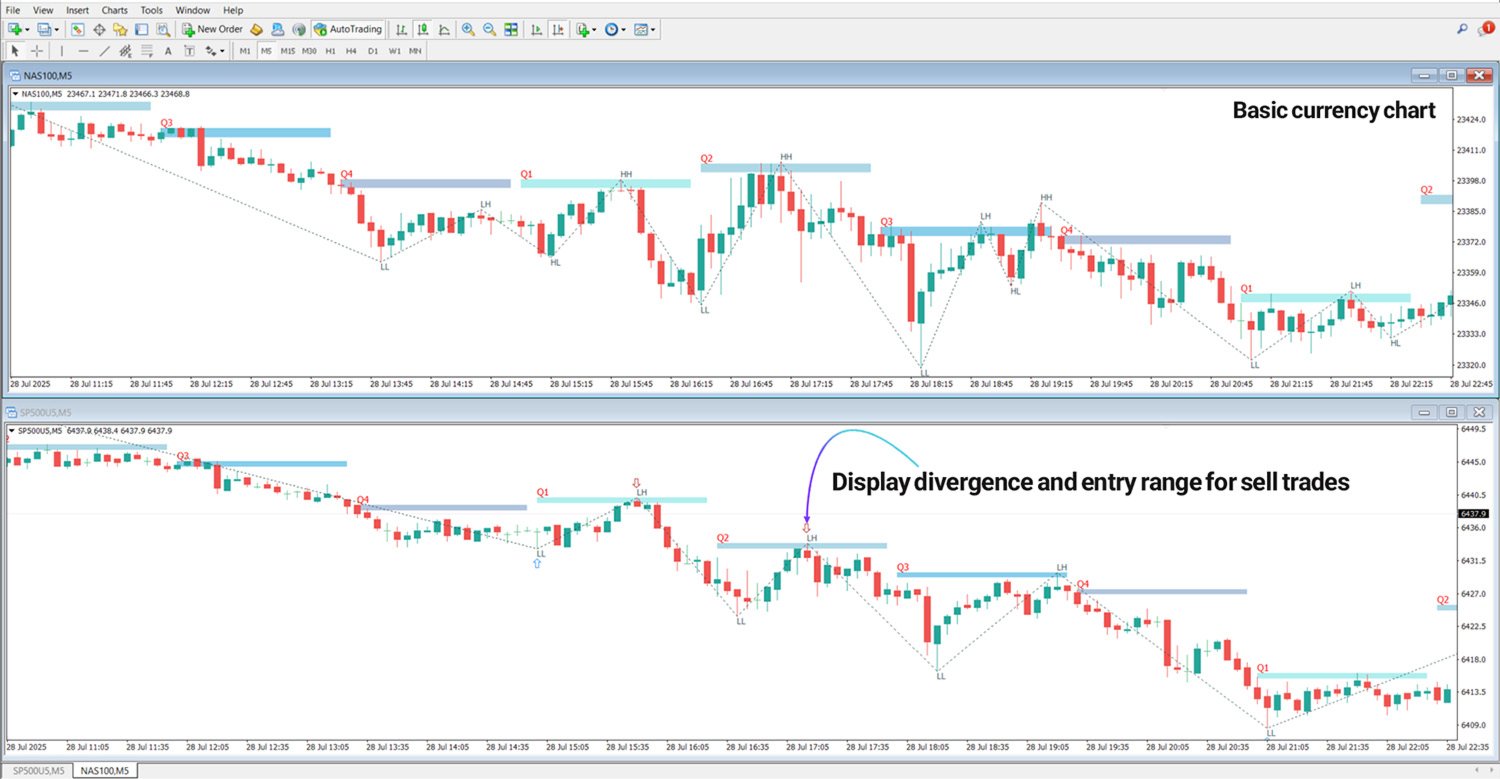
Indicator in Bearish Market Conditions
During bearish setups, divergence is observed between the Nasdaq 100 and S&P 500 when the S&P 500 clears the prior quarter’s high but the Nasdaq 100 fails to follow. This behavior reflects weakening demand and gradual exit of institutional liquidity.
Once validated by a strong bearish candle and structure break, a high-probability short signal form.
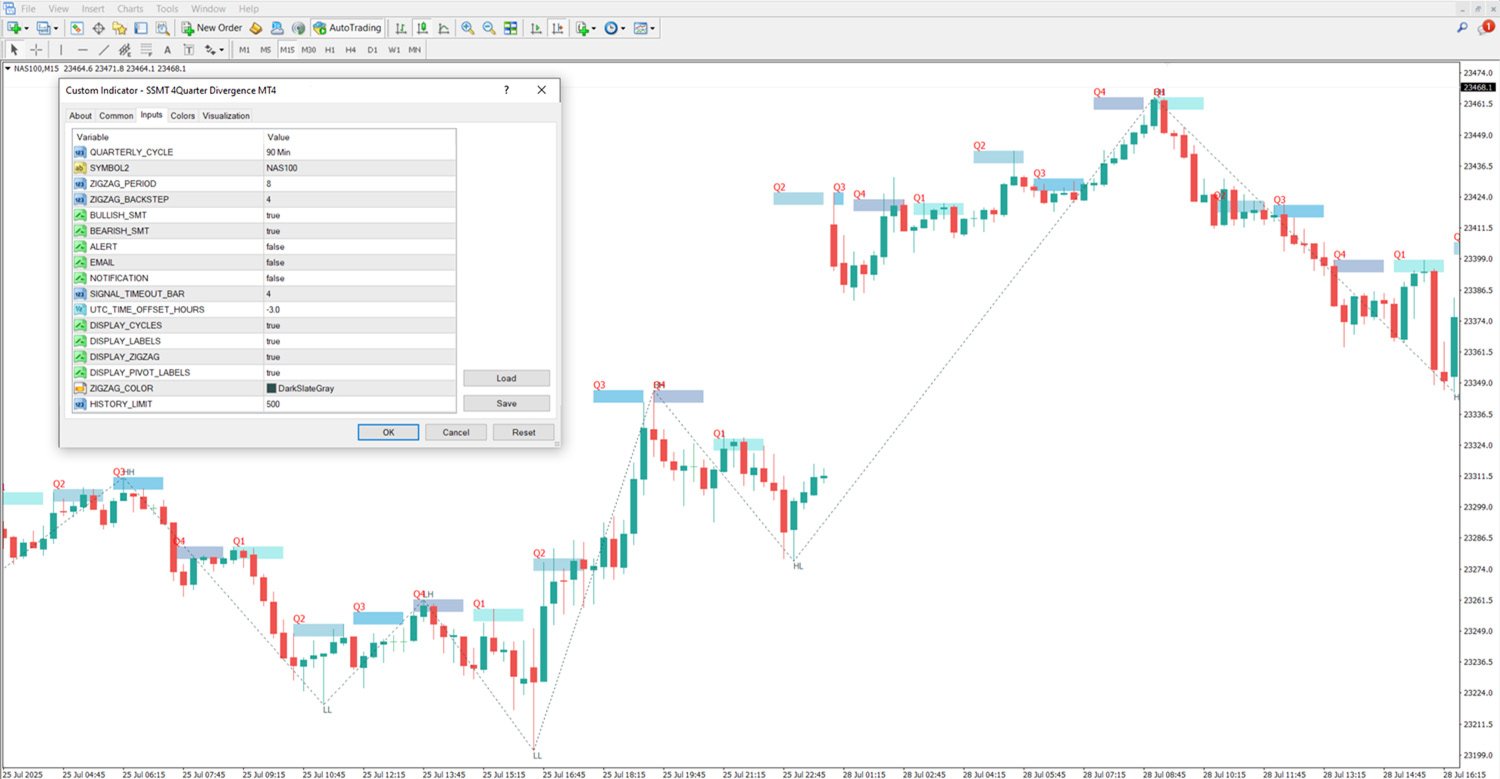
SSMT 4 Quarter Divergence Settings
Key adjustable parameters include:
- QUARTERLY CYCLE: Type of quarterly segmentation
- SYMBOL2: Secondary correlated instrument
- ZIGZAG PERIOD: Sensitivity for zigzag formation
- ZIGZAG BACKSTEP: Required retracement candles for pivot confirmation
- BULLISH SMT: Signal alert for bullish divergence
- BEARISH SMT: Signal alert for bearish divergence
- ALERT / EMAIL / NOTIFICATION: Customizable alerts for desktop, email, and push notifications
- SIGNAL TIMEOUT BAR: Duration of signal validity (candles)
- UTC TIME OFFSET HOURS: Time offset adjustment for alerts
- DISPLAY CYCLES / LABELS / ZIGZAG / PIVOT LABELS: Options for visual elements
- ZIGZAG COLOR: User-defined zigzag line color
- HISTORY LIMIT: Maximum number of candles analyzed and displayed
Conclusion
In the Quarterly Theory ICT 04 SSMT 4 Quarter Divergence Indicator MT4, a “quarter” divides any given timeframe (daily, weekly, etc.) into four equal phases for a detailed study of market cycles.
This structured approach enhances the ability to detect divergences between correlated pairs. Since market transitions often align with these quarter shifts, quarterly analysis is a crucial element in spotting potential smart money accumulation or distribution phases.