MACD 2 Color Histogram Indicator MT4
- Indicators
- Eda Kaya
- Version: 1.3
MACD 2 Color Histogram Indicator MT4
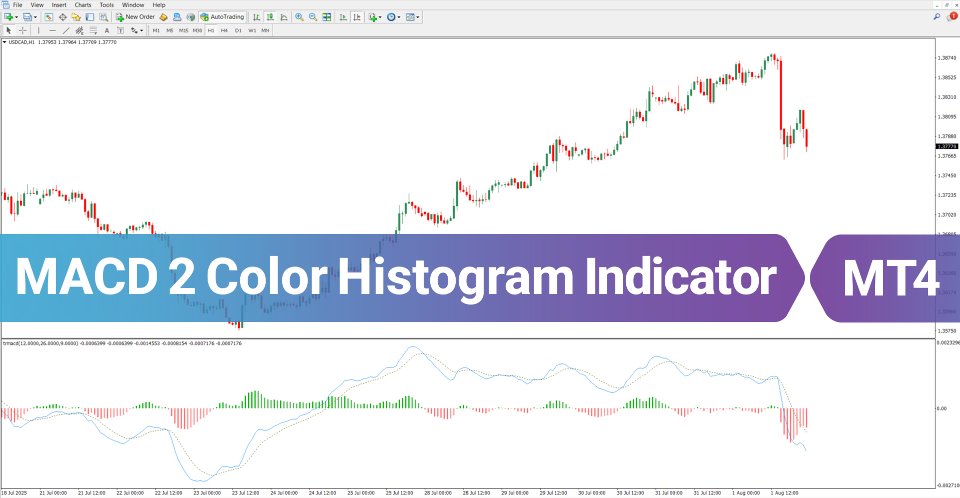
The MACD 2 Color Histogram Indicator MT4 is designed to measure price momentum and highlight potential entry signals in trading. This indicator presents histograms in two distinct colors: green bars signal bullish momentum, while red bars highlight bearish momentum.
«Indicator Installation & User Guide»
MT4 Indicator Installation | MACD 2 Color Histogram Indicator MT5| ALL Products By TradingFinderLab | Best MT4 Indicator: Refined Order Block Indicator for MT4 | Best MT4 Utility: Trade Assistant Expert TF MT4 | TP & SL Tool: Risk Reward Ratio Calculator RRR MT4 | Prop Firm Protector: Prop Draw Down Protector Expert Advisor MT4 | Money Management: Easy Trade Manager MT4
MACD 2 Color Histogram Oscillator Specifications Table
The following table outlines the key parameters of the MACD 2 Color Histogram Indicator:
| Category | Oscillator – Signal & Prediction – Strength |
| Platform | MetaTrader 4 |
| Skill Level | Beginner |
| Indicator Type | Reversal – Continuation |
| Timeframe | Multi Timeframe |
| Trading Style | Scalping – Day Trading – Swing Trading |
| Market | All Financial Markets |
MACD 2 Color Histogram Indicator in Action
Signals within this oscillator are generated when the MACD line intersects with the signal line.
- Bullish crossover (upward) = possible buy setup.
- Bearish crossover (downward) = potential sell setup.
Buy Example
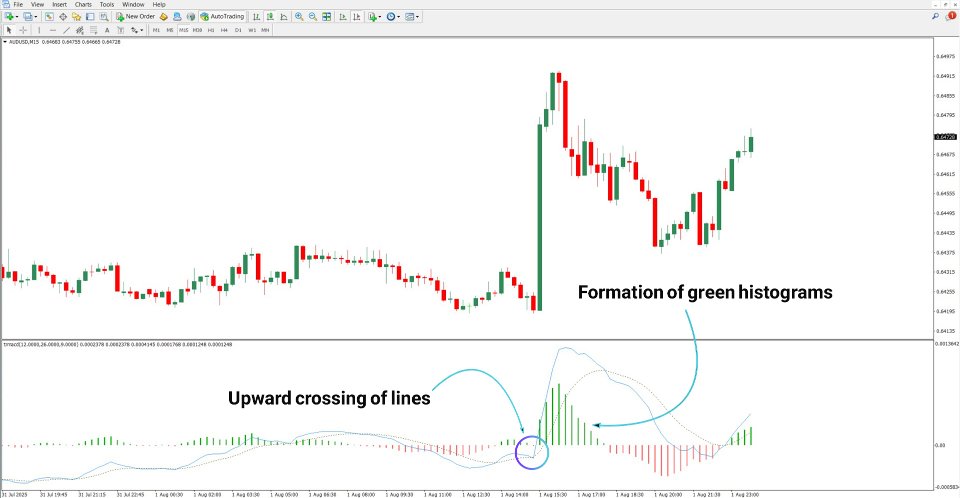
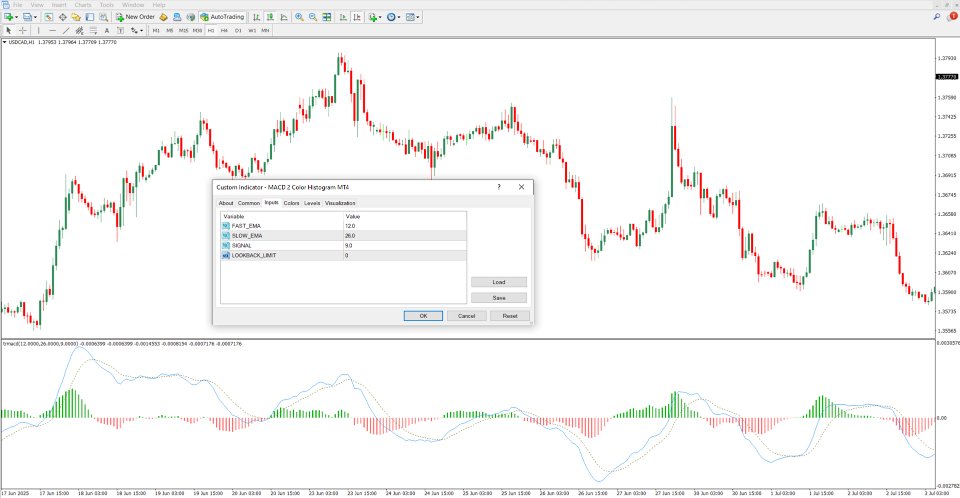
On the 15-minute AUD/USD chart, an upward cross of the MACD line above the signal line indicates a valid buying signal. The simultaneous appearance of green histograms reinforces the bullish sentiment.
Sell Example
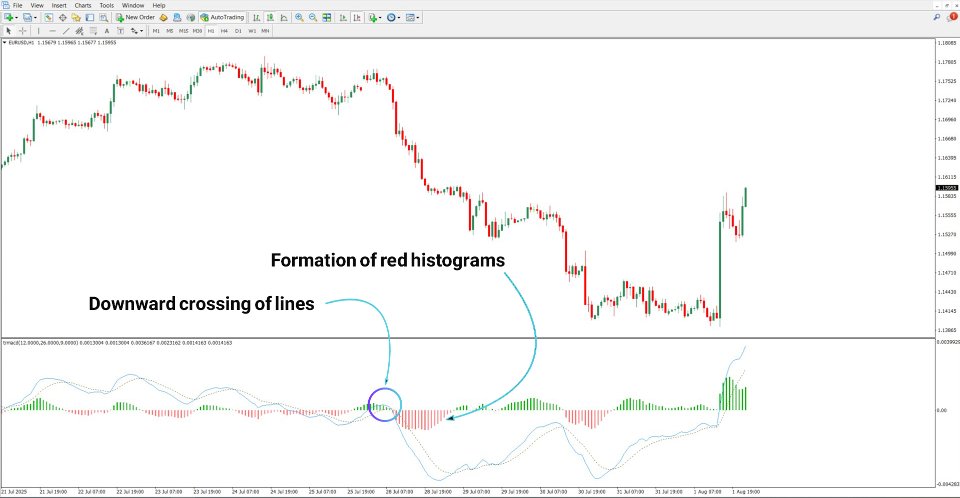
On the 1-hour EUR/USD chart, a downward MACD crossover identifies a selling signal. As long as red histograms continue to appear, the bearish phase is expected to remain intact.
MACD 2 Color Histogram Indicator Settings
Key adjustable inputs for this indicator include:
- FAST_EMA: Defines the short-term moving average calculation.
- SLOW_EMA: Determines the long-term moving average calculation.
- SIGNAL: Sets the EMA for the signal line.
- LOOKBACK_LIMIT: Restricts the historical range for calculation or visualization.
Conclusion
The MACD 2 Color Histogram Indicator MT4 provides traders with an easy way to interpret market momentum by switching histogram colors between bullish and bearish phases. Along with MACD line crossovers against the signal line, it offers clear entry points for both buy and sell opportunities.
Furthermore, traders can fine-tune parameters such as fast EMA, slow EMA, and signal EMA to match their preferred strategy.
