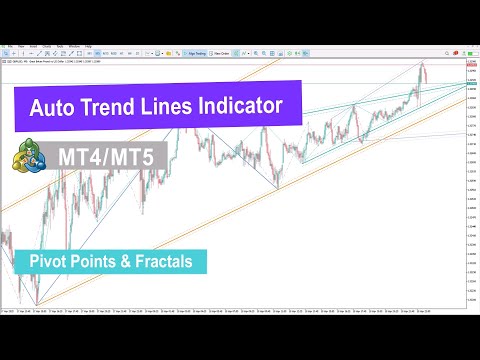
Auto Trend Lines Indicator MT4
- Indicators
- Eda Kaya
- Version: 2.1
Auto Trend Lines Indicator MetaTrader 4
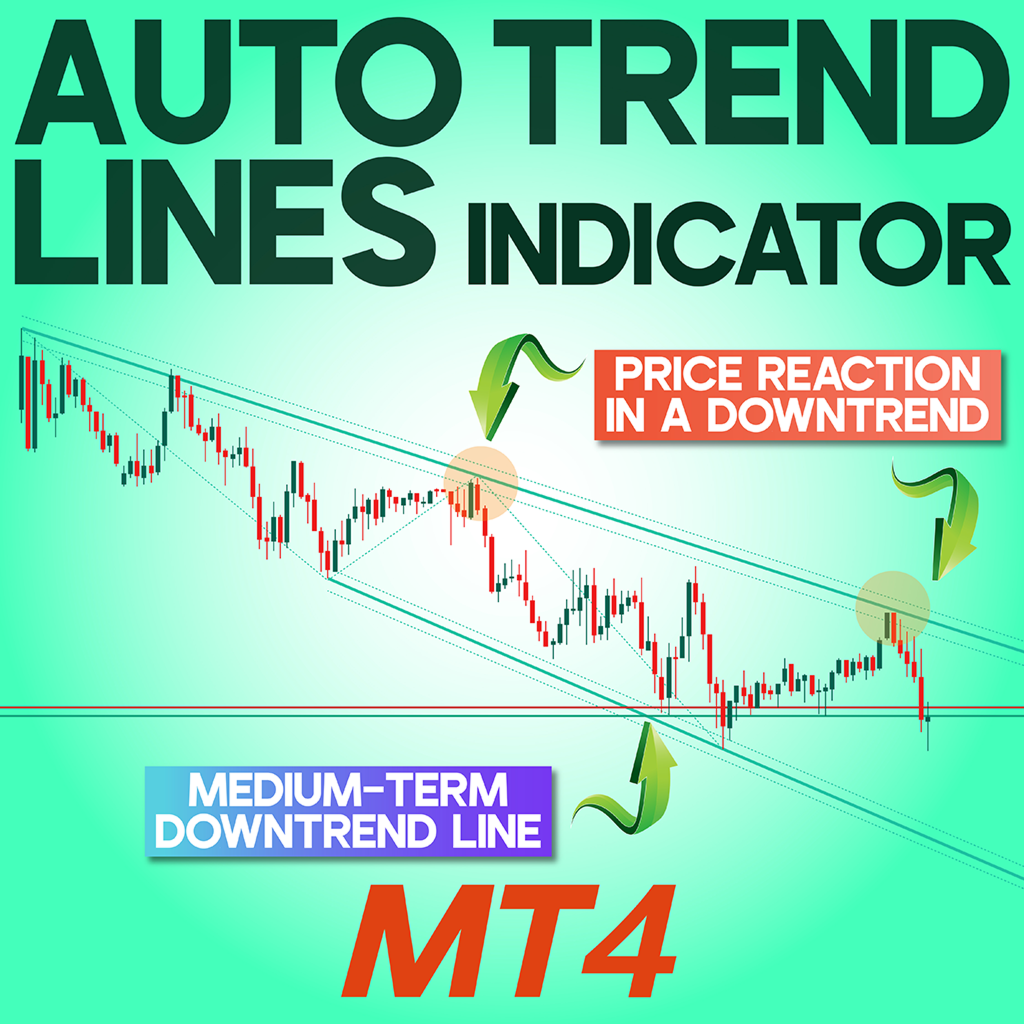
The Auto Trend Lines Indicator (ATL) is one of the pivot point and fractal indicators available for MetaTrader 4. This tool automatically draws trend lines based on three distinct timeframes:
• Long Term – Orange color
• Medium Term – Green color
• Short Term – Gray color
Using the zigzag pattern to connect the most recent highs and lows, the ATL Indicator calculates and draws trend lines based on the selected timeframes. This helps traders more efficiently and accurately identify key market trends and price levels.
«Indicator Installation & User Guide»
MT4 Indicator Installation | Auto Trend Lines Indicator for MT5 | ALL Products By TradingFinderLab | Best MT4 Indicator: Refined Order Block Indicator for MT4 | Best MT4 Utility: Trade Assistant Expert TF MT4 | TP & SL Tool: Risk Reward Ratio Calculator RRR MT4 | Prop Firm Protector: Trade Assist Prop Firm Plus TF Expert MT4 | Money Management + DrawDown Protector: Trade Panel Prop Firm Drawdawn Limiter Pro MT4
Auto Trend Lines Indicator Table
| Category | Bands and Channels – Support and Resistance – Pivot Points and Fractals |
| Platform | MetaTrader 4 |
| Skill Level | Beginner |
| Indicator Type | Continuation – Reversal |
| Timeframe | 15 Minutes – 30 Minutes – 1 Hour – 4 Hours |
| Trading Style | Scalping – Day Trading – Intraday Trading |
| Trading Markets | Forex – Cryptocurrencies – Indices |
Indicator at a Glance
The Auto Trend Lines Indicator is an advanced analysis tool designed to identify market trends. By using zigzag lines across different timeframes, the indicator plots three types of trend lines, giving traders a clearer perspective on short-, medium-, and long-term market movements.
This multi-timeframe analysis helps traders make more informed and targeted trading decisions.
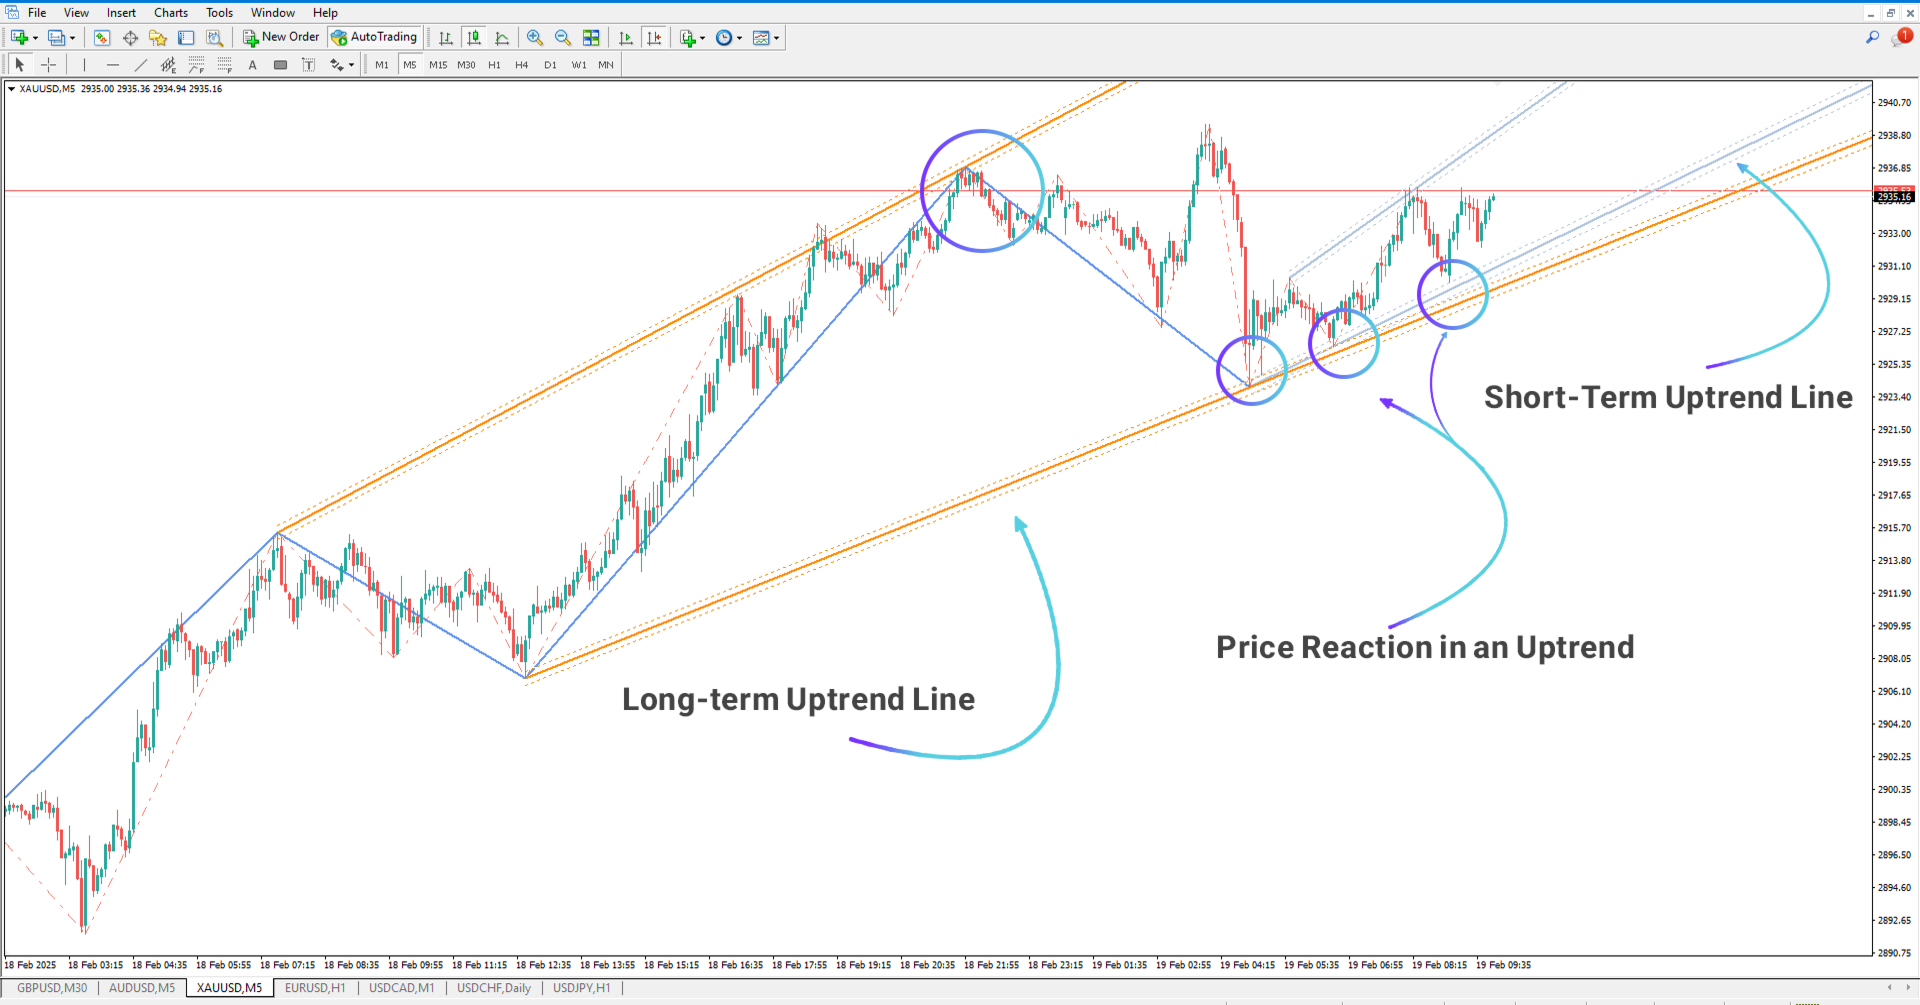
Bullish Trend
In the 5-minute Gold chart, the ATL successfully displays two ascending channels. Through analyzing and drawing trend lines across both short-term and long-term timeframes, the indicator reveals the underlying market trend in these periods. This multi-timeframe perspective enables traders to perform deeper technical analysis and execute trades with greater confidence.
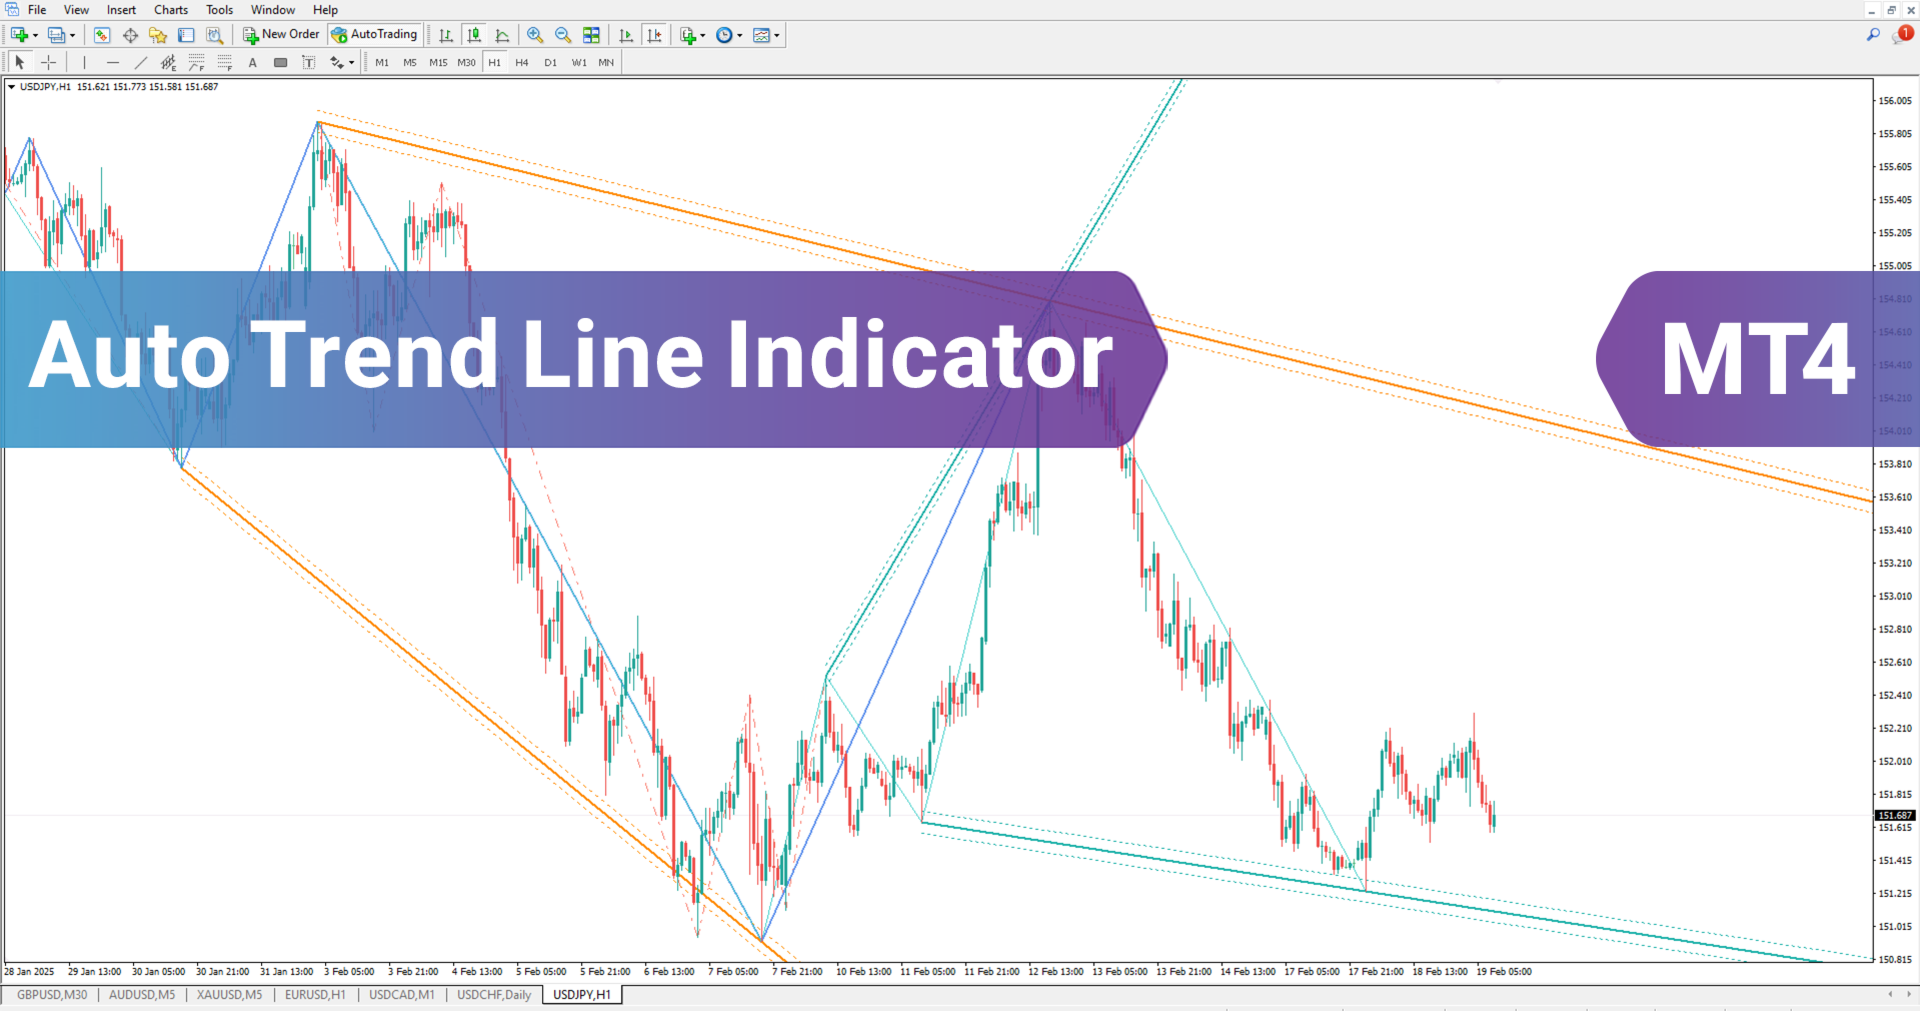
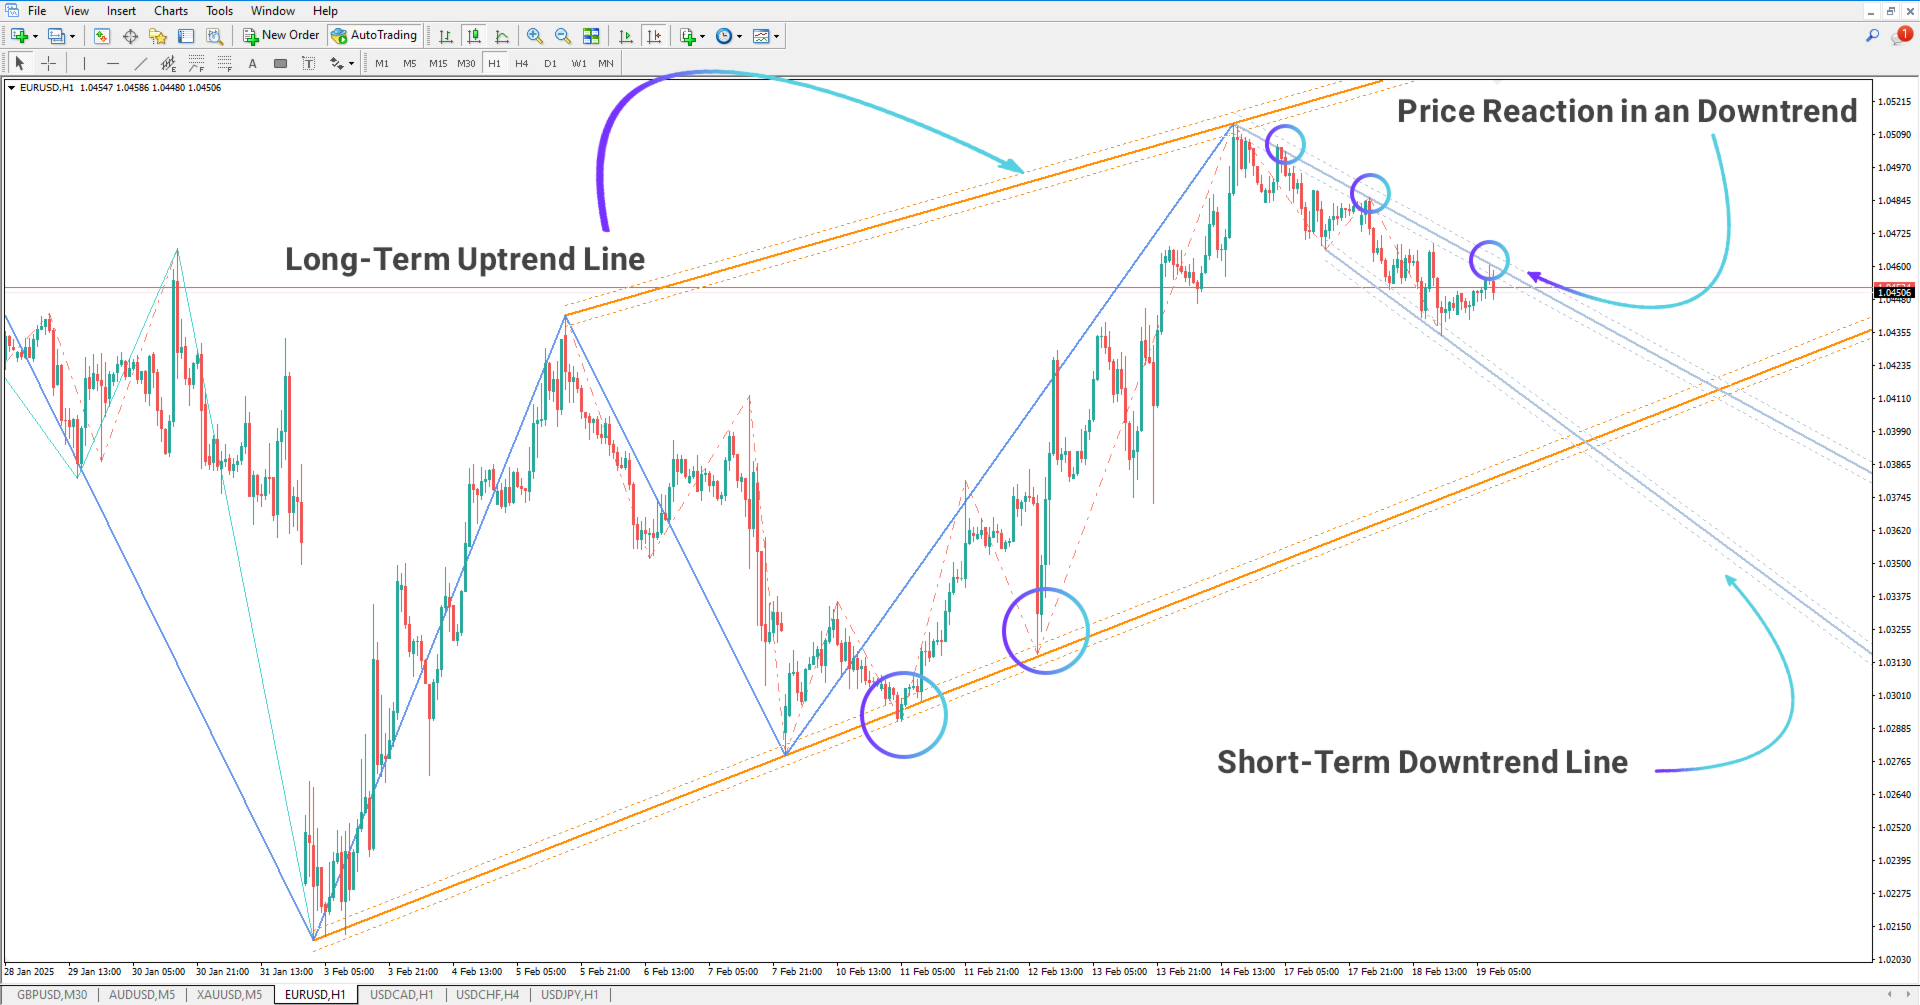
Bearish Trend
On the 1-hour EUR/USD chart, the ATL has drawn three descending channels. By evaluating price action across short-, medium-, and long-term timeframes, the indicator clearly illustrates the bearish market structure. As shown in the chart, the price reacts to these drawn lines, moving within the defined channels.
This allows traders to identify key support and resistance zones and plan more strategic entries and exits.
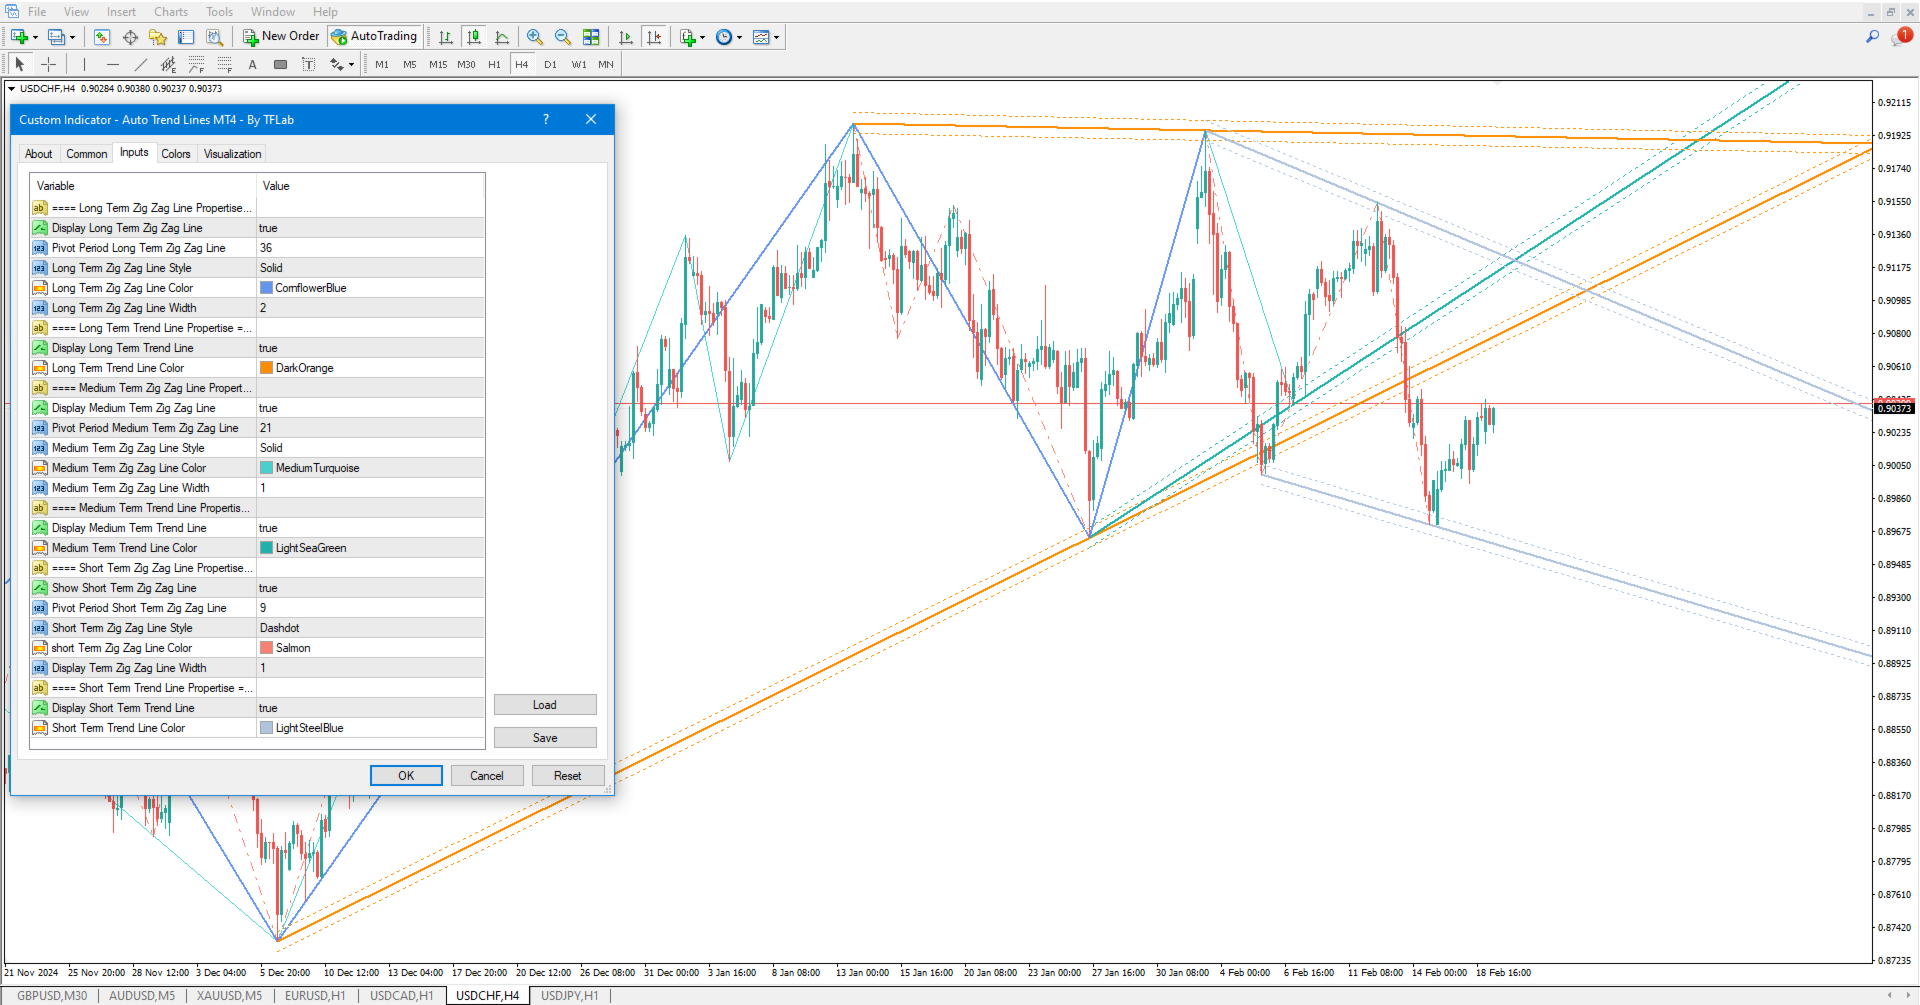
Auto Trend Lines Indicator Settings
The indicator includes a wide range of customizable settings:
Long Term Zig Zag Line Properties:
- Show Long Term Zig Zag Line: Enable or disable the line.
- Pivot Period: Set the pivot period for the long-term zigzag.
- Line Style: Choose the visual style (e.g., dash, dot).
- Line Color: Define the color (e.g., orange).
- Line Width: Adjust line thickness.
Long Term Trend Line Properties:
- Show Long Term Trend Line: Enable or disable.
- Trend Line Color: Choose the color.
Medium Term Zig Zag Line Properties:
- Show Medium Term Zig Zag Line: Enable or disable.
- Pivot Period: Set the period.
- Line Style: Choose the style.
- Line Color: Define the color (e.g., green).
- Line Width: Adjust the width.
Medium Term Trend Line Properties:
- Show Medium Term Trend Line: Enable or disable.
- Trend Line Color: Choose the color.
Short Term Zig Zag Line Properties:
- Show Short Term Zig Zag Line: Enable or disable.
- Pivot Period: Set the pivot period.
- Line Style: Select the style.
- Line Color: Define the color (e.g., gray).
- Line Width: Adjust line thickness.
Short Term Trend Line Properties:
- Show Short Term Trend Line: Enable or disable.
- Trend Line Color: Set the desired color.
Conclusion
The Auto Trend Lines Indicator (ATL) is a powerful tool in the bands and channels category for MetaTrader 4. It automatically visualizes bullish and bearish trends, helping traders identify trend directions and price reaction levels with ease.
One of its key strengths is the ability to draw trend lines and price channels across three different timeframes, providing a well-rounded perspective of market conditions. This capability helps traders enhance the accuracy of their strategies and make better-informed trading decisions.