MA Color Candles
- 지표
- 버전: 2.0
- 업데이트됨: 10 5월 2025

MA Color Candles Indicator
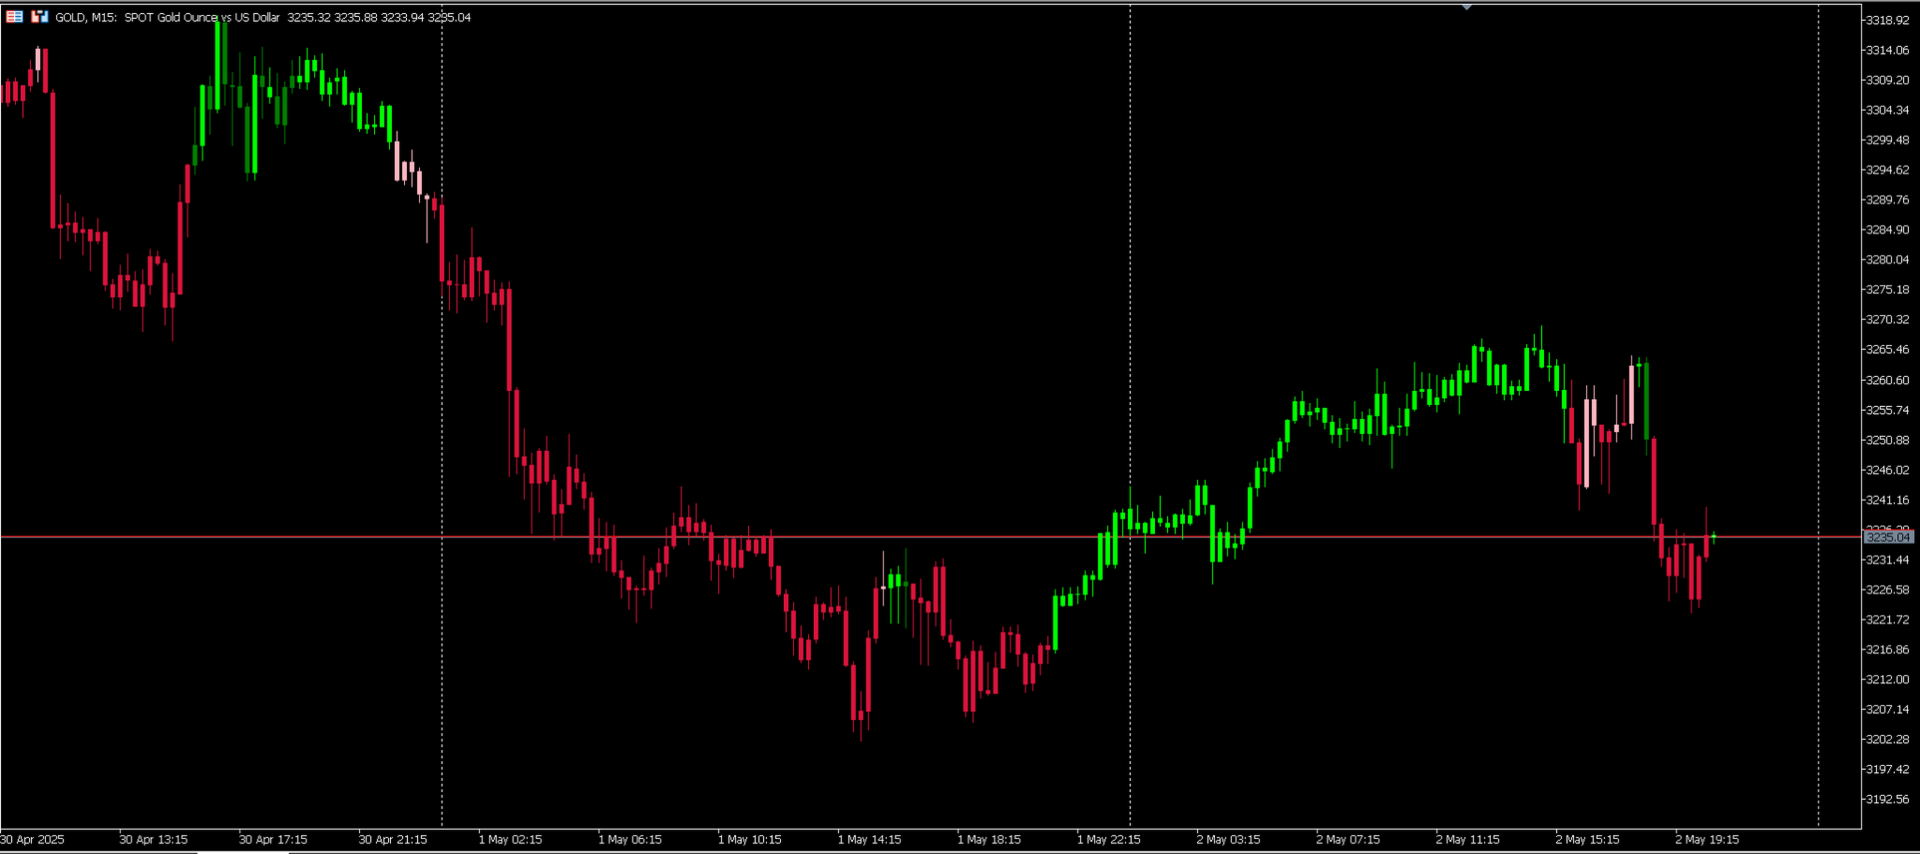
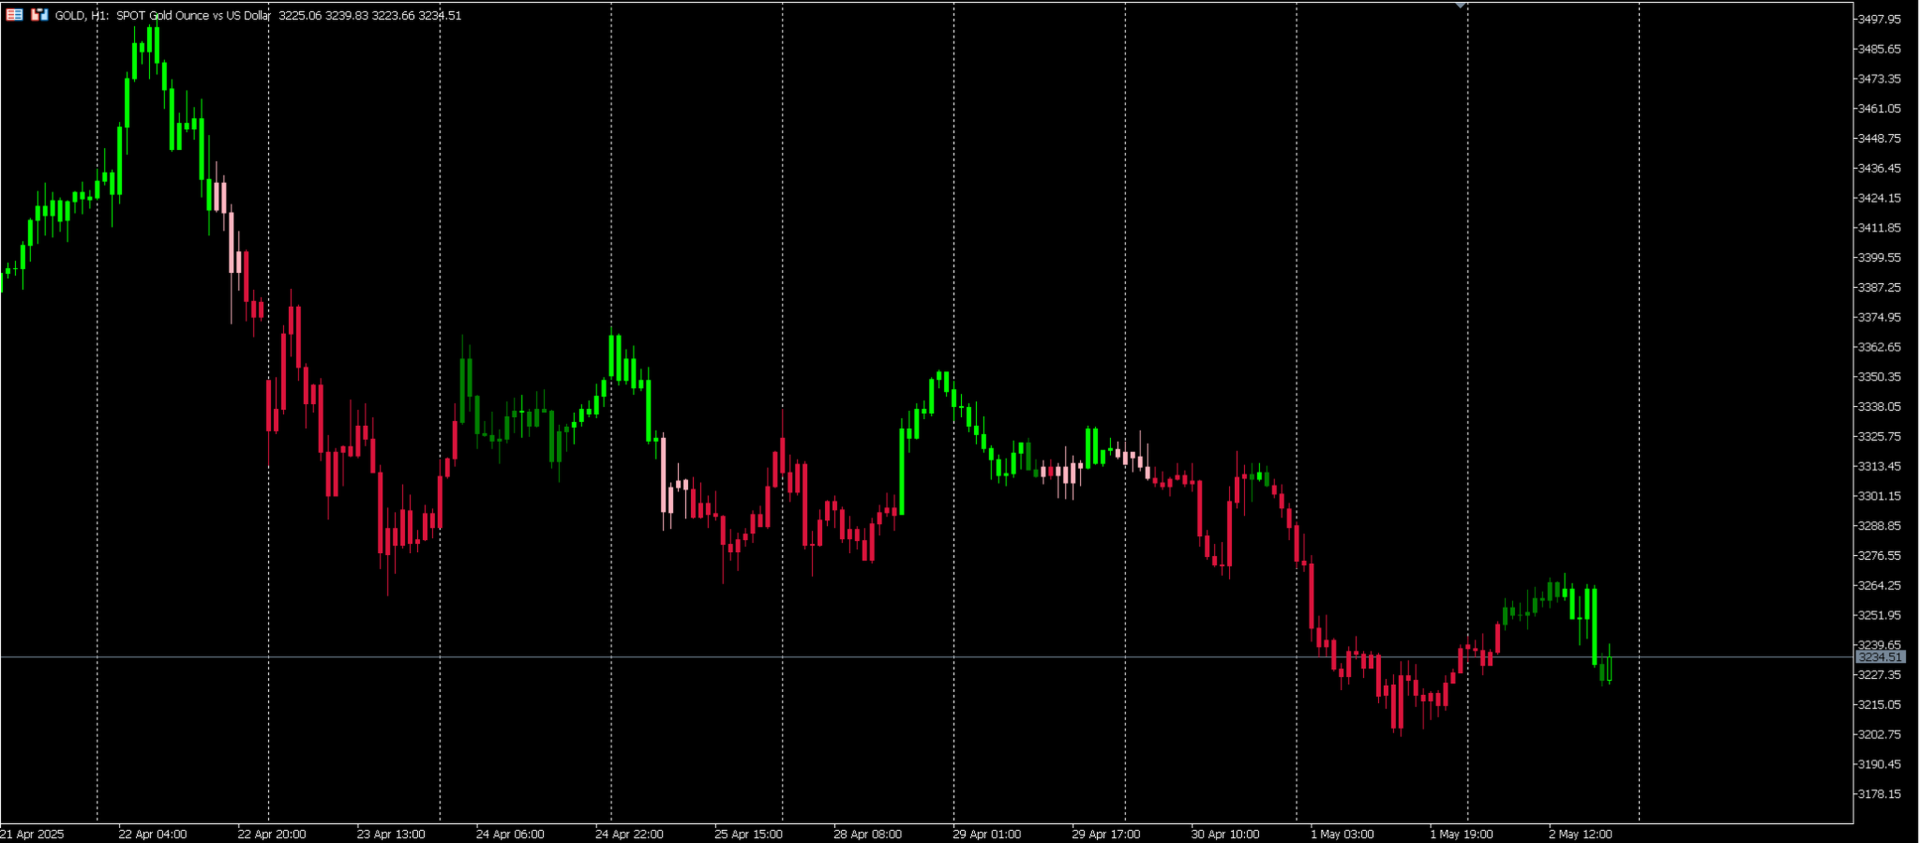
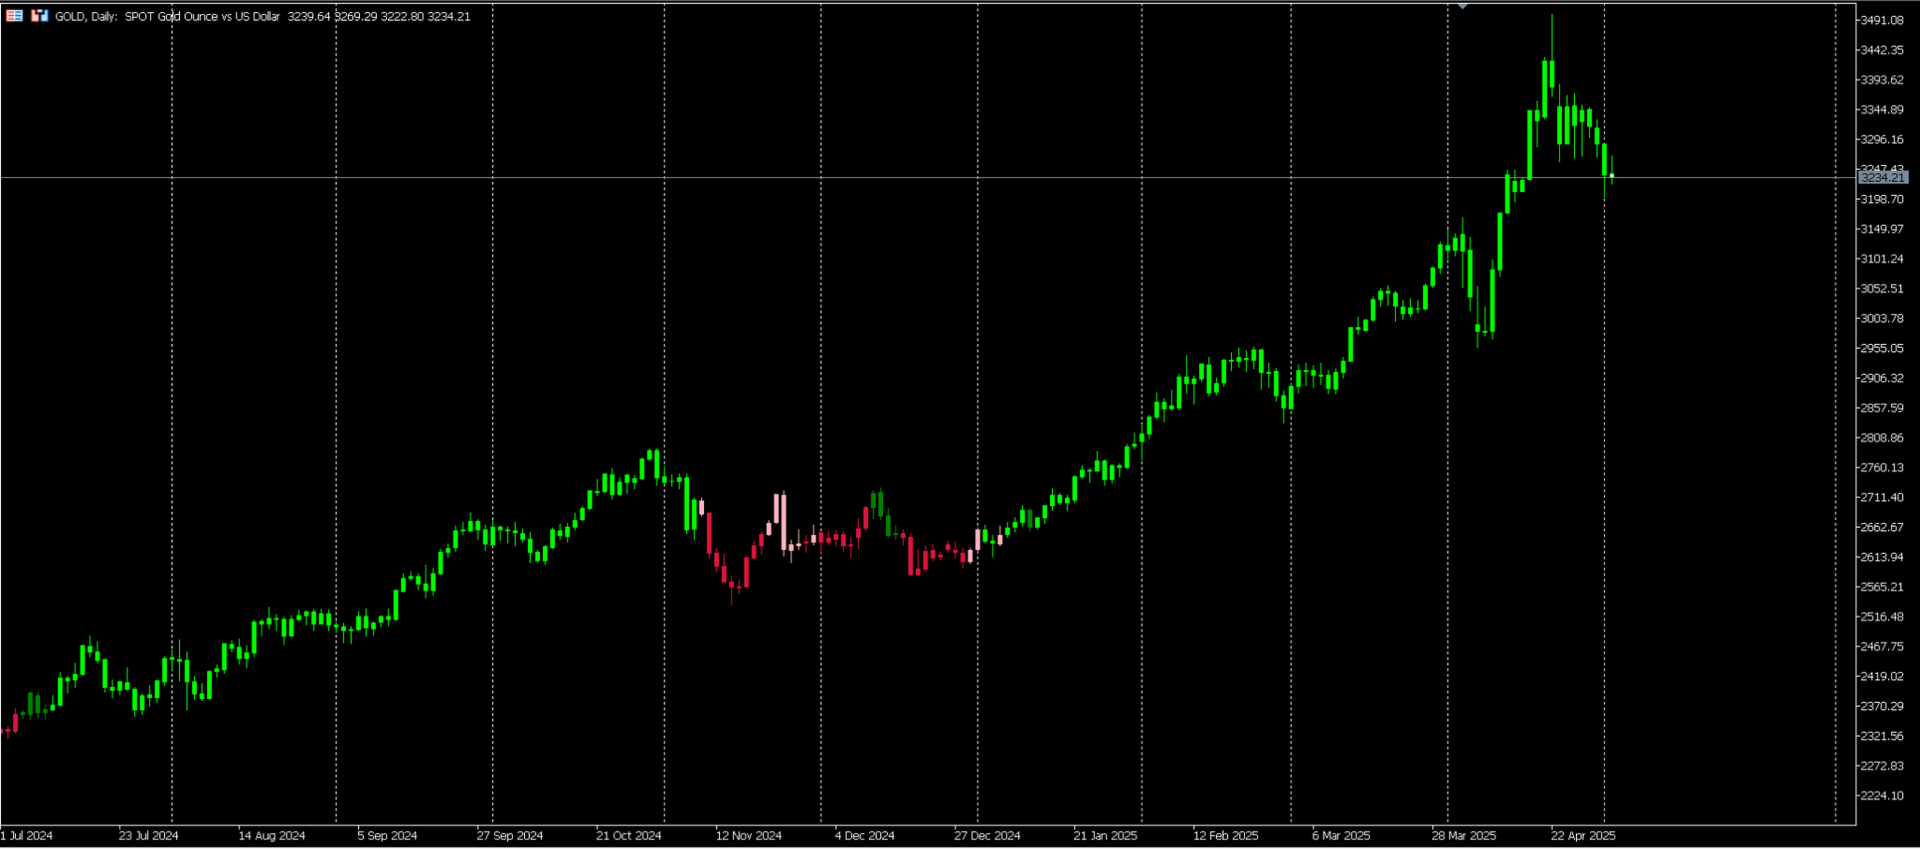
MA Color Candles is an indicator for visually displaying market trends by coloring chart candles. It does not add objects or distort price data, instead coloring real candles based on the state of two moving averages. This enables quick trend assessment and use as a filter in trading strategies.
How It Works
- Bullish trend: Fast MA above slow MA, slow MA rising (green candles).
- Bearish trend: Fast MA below slow MA, slow MA falling (red candles).
- Neutral state: Candles retain their default color.
Key Features
- Colors real chart candles
- Supports SMA, EMA, SMMA, LWMA
- Customizable periods and price type
- Clean chart without clutter
- Simple trend visualization
Parameters
- Fast and slow MA periods
- Averaging method
- Price type (Close, Open, etc.)
- Bullish and bearish candle colors
Recommendations
- Optimal timeframes: M15–H4
- Suitable for trending assets
- Compatible with other indicators
Additional Information
Detailed parameter setup instructions are available in the comments section or the author’s blog on MQL5.com.
Disclaimer
This indicator is intended for visual analysis and does not guarantee profits. The author is not responsible for trading outcomes. Test thoroughly before using on a live account.