Short Intermediate Long Terms Low Indicator MT4
- Indicators
- Eda Kaya
- Version: 1.11
Short Intermediate Long Terms Low Indicator MT4
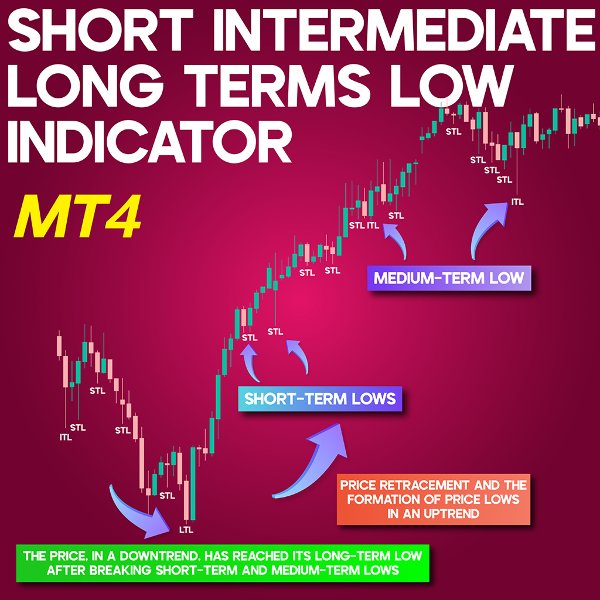
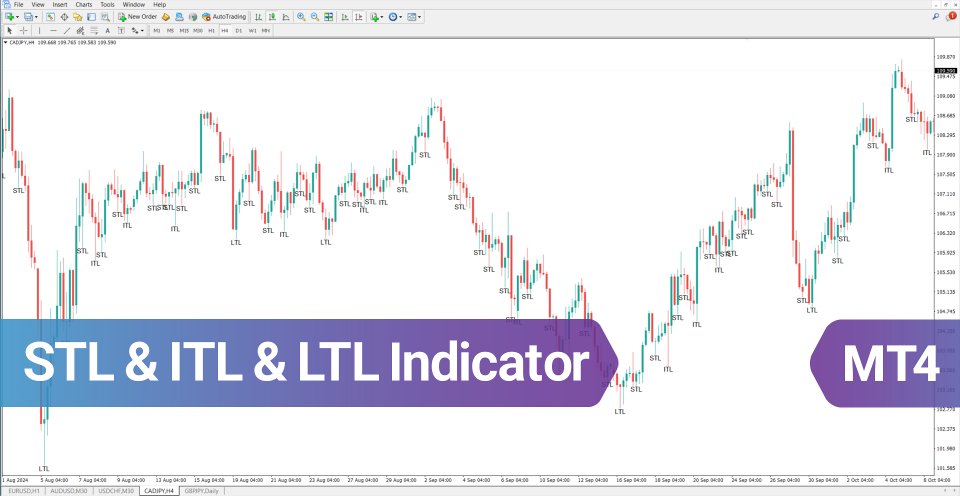
The STL, ITL, and LTL Indicator for MetaTrader 4 is a valuable tool for traders looking to pinpoint short-term lows (STL), intermediate-term lows (ITL), and long-term lows (LTL). Built on the ICT (Inner Circle Trader) methodology, this indicator assists in identifying critical points where market reversals are likely to occur.
«Indicator Installation & User Guide»
MT4 Indicator Installation | Short Intermediate Long Terms Low Indicator MT5 | ALL Products By TradingFinderLab | Best MT4 Indicator: Refined Order Block Indicator for MT4 | Best MT4 Utility: Trade Assistant Expert TF MT4 | TP & SL Tool: Risk Reward Ratio Calculator RRR MT4 | Money Management: Easy Trade Manager MT4 | Trade Copier: Free Fast Local Trade Copier MT4
Indicator Table
| Category | ICT - Liquidity - Trend Strength |
| Platform | MetaTrader 4 |
| Skill Level | Intermediate |
| Indicator Type | Trend Continuation - Reversal |
| Timeframe | Multi-Timeframe |
| Trading Style | Intraday Trading |
| Market | Forex - Crypto - Stocks |
Indicator Overview
This indicator detects significant swing lows in price action, helping traders recognize zones where price might change direction. These key levels emerge due to shifts in market supply and demand.
By assessing price lows across different time horizons—ranging from short-term to long-term—the indicator offers traders a clearer perspective on overall price movement and trend direction.
Indicator in an Uptrend
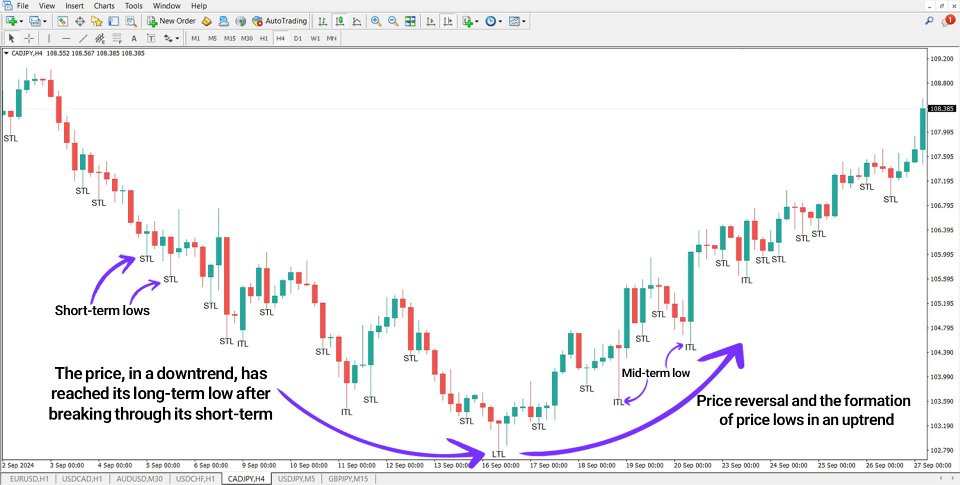
In the bullish trend of the CAD/JPY currency pair, the price systematically breaks through short-term and mid-term lows before reaching a long-term low (LTL). This formation signals the potential for a price reversal. Maintaining the trend requires the price to hold above the newly established long-term low; if broken, the risk of a trend reversal increases.
Traders confirming the trend direction can set their stop-loss below the long-term low (LTL) and look for buying opportunities.
Indicator in a Downtrend
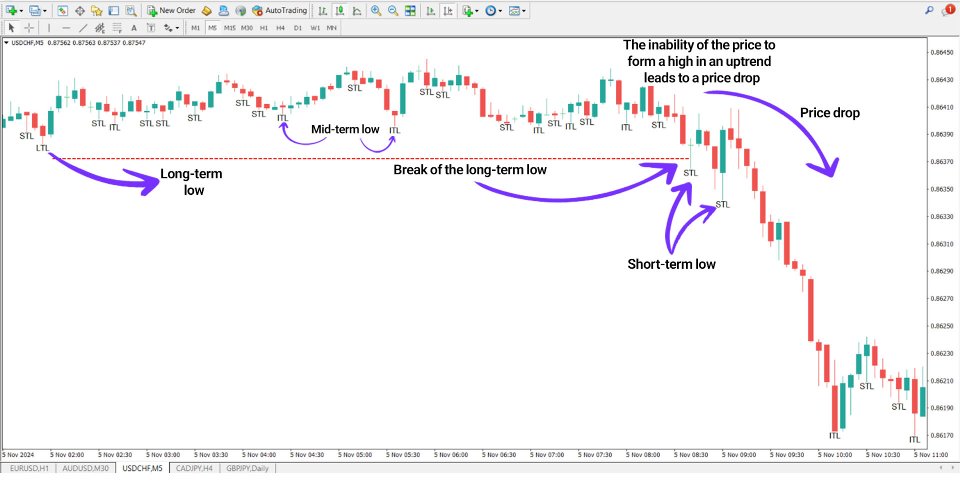
On a 5-minute USD/CHF price chart, the price initially forms a long-term low (LTL) but struggles to reach a new high. After failing to establish a higher price level, the market breaks below the most recent long-term low, confirming a bearish continuation.
Indicator Settings
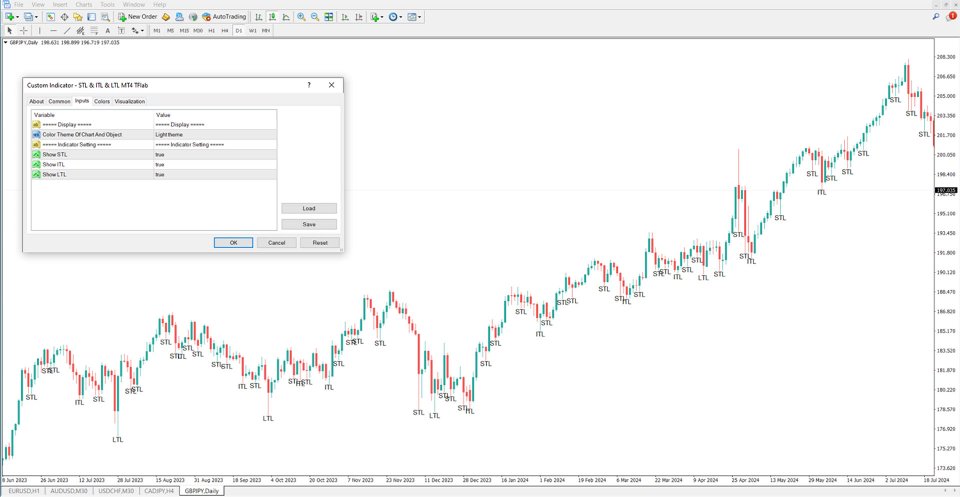
- Chart & Object Color Theme: Defines the background color of the chart.
- Show STL: Enables the display of short-term lows.
- Show ITL: Enables the display of mid-term lows.
- Show LTL: Enables the display of long-term lows.
Conclusion
By leveraging STL, ITL, and LTL, traders can identify essential support and resistance levels, potential price reversals, and trend confirmations. Understanding how these lows interact within the market allows traders to make informed decisions, develop strategic trade entries, and improve profitability.
