OBV Divergence Indicator MT4
- Indicators
- Eda Kaya
- Version: 2.1
OBV Divergence Indicator for MetaTrader4
The OBV Divergence Indicator for MetaTrader4 is a smart analytical tool designed to automatically highlight divergences between On Balance Volume (OBV) and price movement.
This indicator is widely used in momentum-based strategies and eliminates the need for manual detection of divergence patterns. It provides clear visual cues by marking potential buy zones with blue signals and potential sell zones with pink markers.
«Indicator Installation & User Guide»
MT4 Indicator Installation | OBV Divergence Indicator MT5 | ALL Products By TradingFinderLab | Best MT4 Indicator: Refined Order Block Indicator for MT4 | Best MT4 Utility: Trade Assistant Expert TF MT4 | TP & SL Tool: Risk Reward Ratio Calculator RRR MT4 | Prop Firm Protector: Trade Assist Prop Firm Plus TF Expert MT4 | Money Management + DrawDown Protector: Trade Panel Prop Firm Drawdawn Limiter Pro MT4
Indicator Table
| Indicator Category | Oscillator – Momentum – Signal Generator |
| Platforms | MetaTrader 4 |
| Trading Skills | Beginner-Friendly |
| Indicator Types | Trend Reversal – No Repaint |
| Timeframe | 5m, 15m, 30m, 1H, 4H |
| Trading Style | Scalping – Intraday – Short-Term |
| Trading Instruments | Forex – Crypto – Equities |
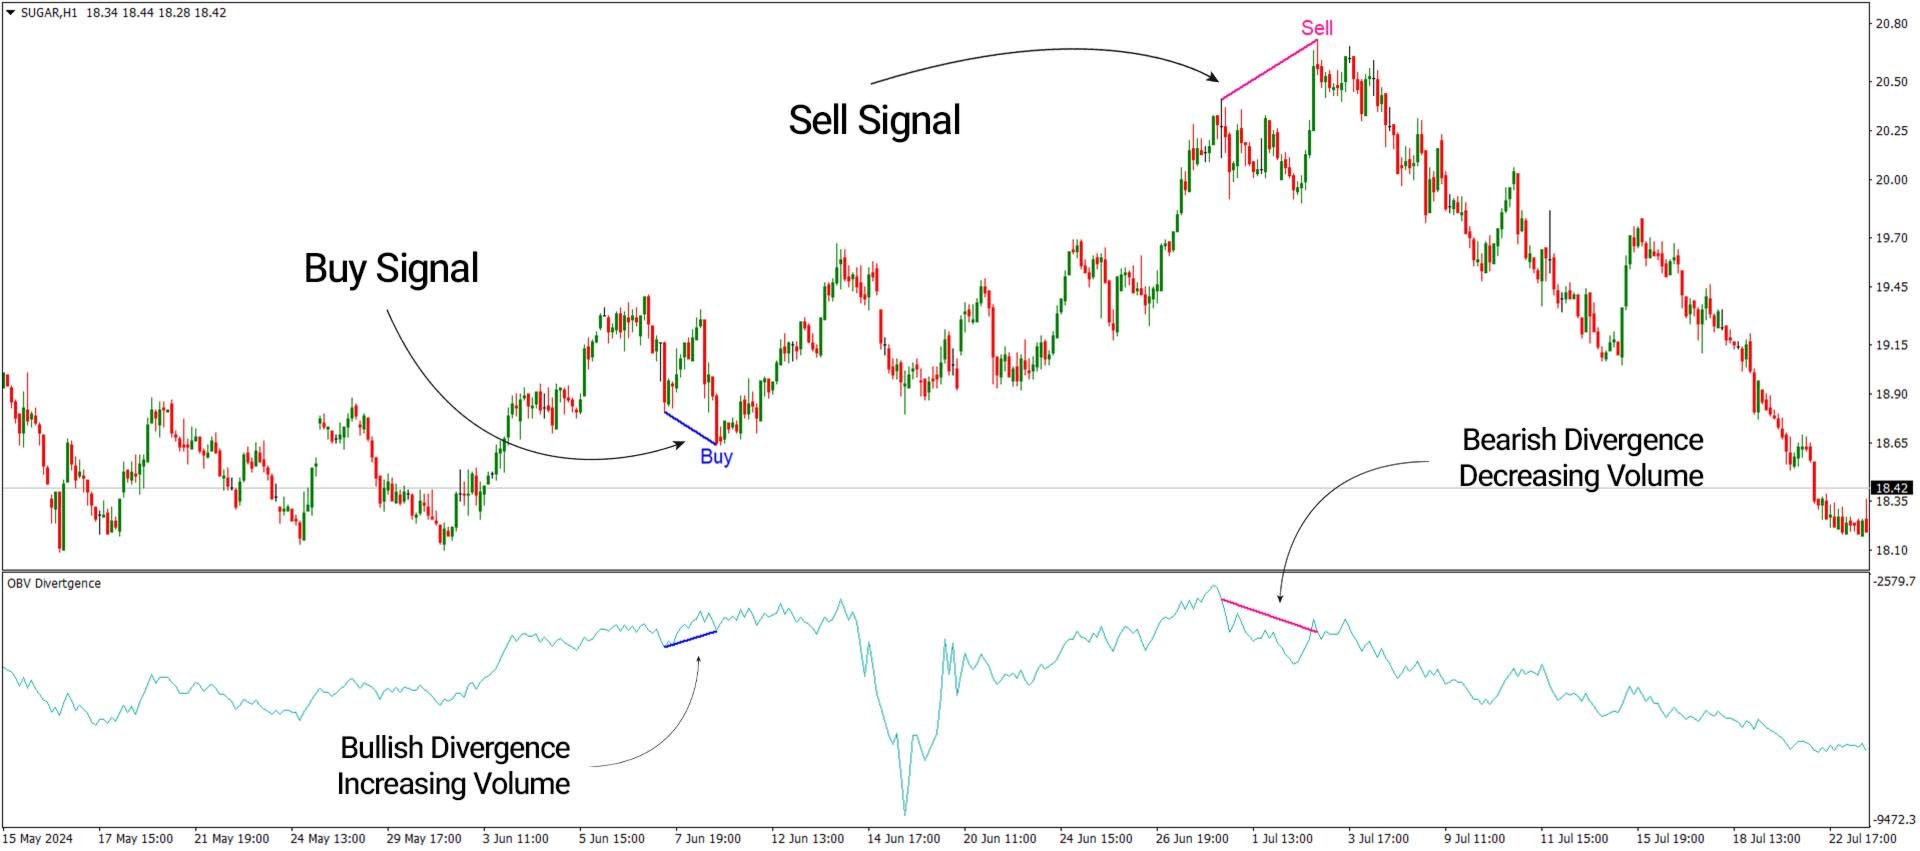
In the chart below, the 1-hour price action of [SUGAR] is displayed. After a downward correction, a new lower low (LL) forms, yet the OBV indicator trend is upward—suggesting a bullish divergence. This behavior often precedes a price reversal, which is confirmed by a blue buy signal.
Conversely, in an upward trend, when a higher high (HH) is formed but OBV is moving down, a bearish divergence is detected, leading to a pink sell signal on the chart.
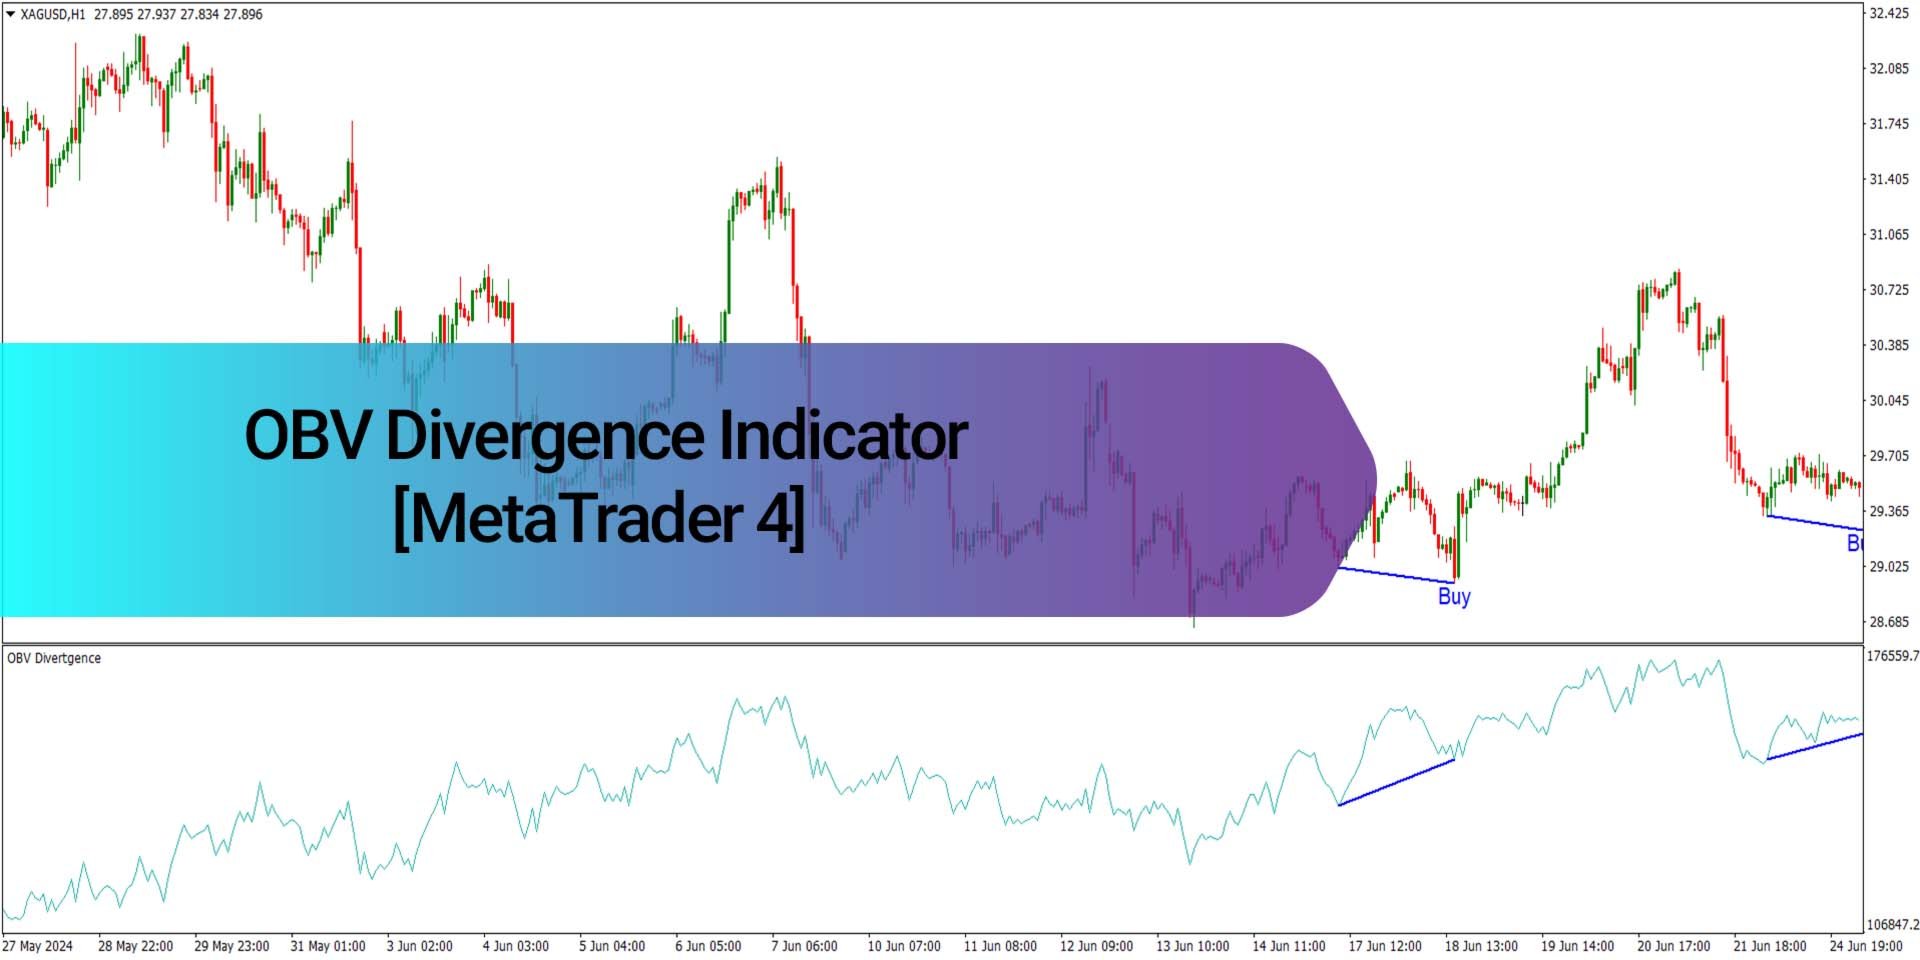
Overview
The OBV Divergence Indicator for MetaTrader4 works by scanning mismatches between volume flow and price action to flag high-probability turning points. These divergences signal potential entry or exit opportunities, especially useful for those trading based on volume-price dynamics.
It helps traders understand when market sentiment is weakening, even if the price continues in the same direction temporarily.
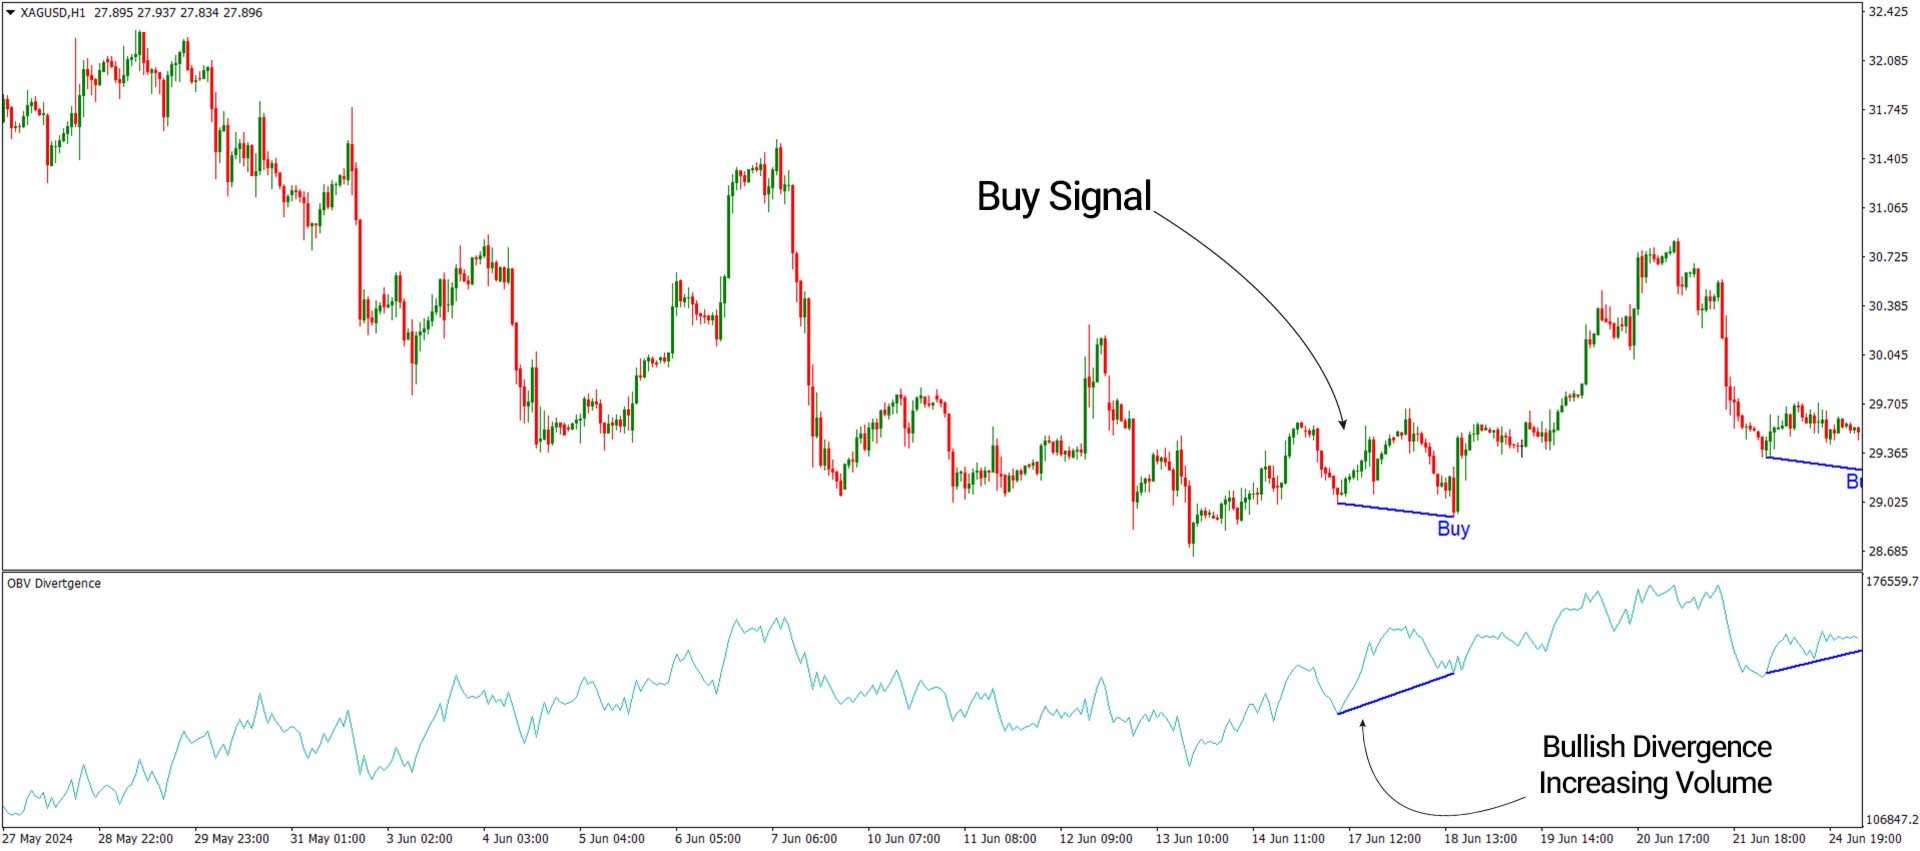
Buy Signal (Long Entry)
In the 1-hour chart of Silver (symbol: XAGUSD), a fresh lower low in price is contrasted by an upward movement in the OBV line. This inconsistency often reflects hidden buying strength. When this divergence appears, a blue signal is triggered to mark a potential bullish reversal zone.
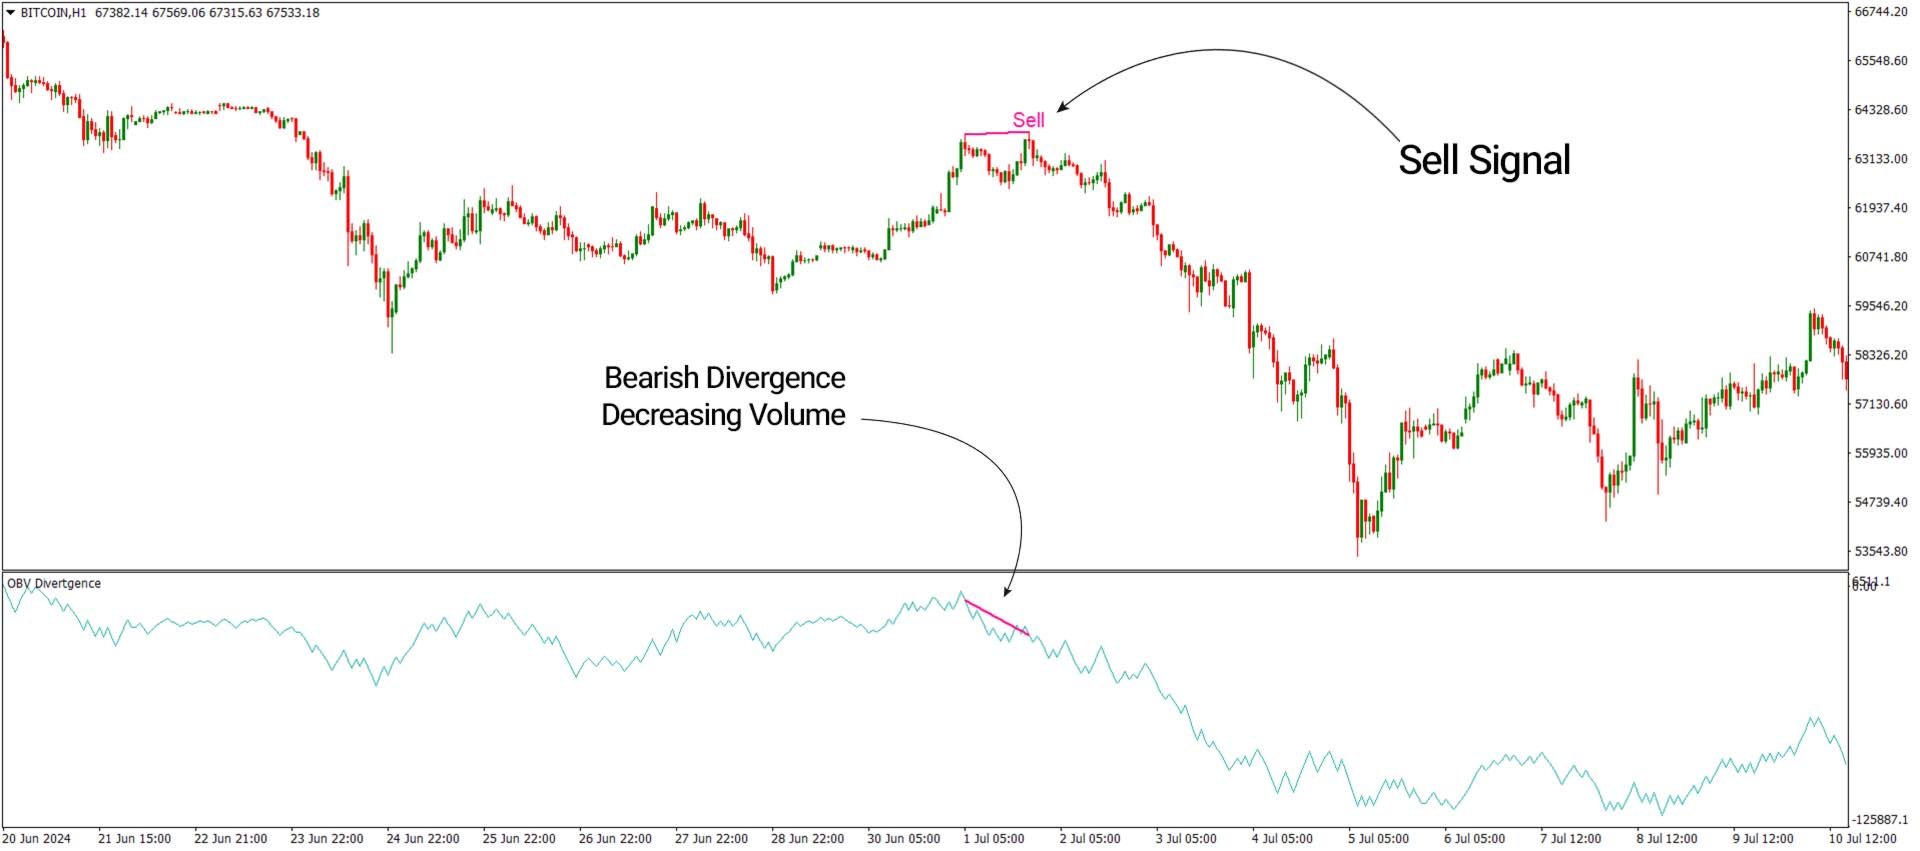
Sell Signal (Short Entry)
The chart below shows Bitcoin (symbol: BITCOIN) on a 1-hour timeframe. During the final stages of a rally, the price makes a new higher high while the OBV line begins to decline. This behavior reveals underlying selling pressure, triggering a pink sell signal to anticipate a potential price drop.
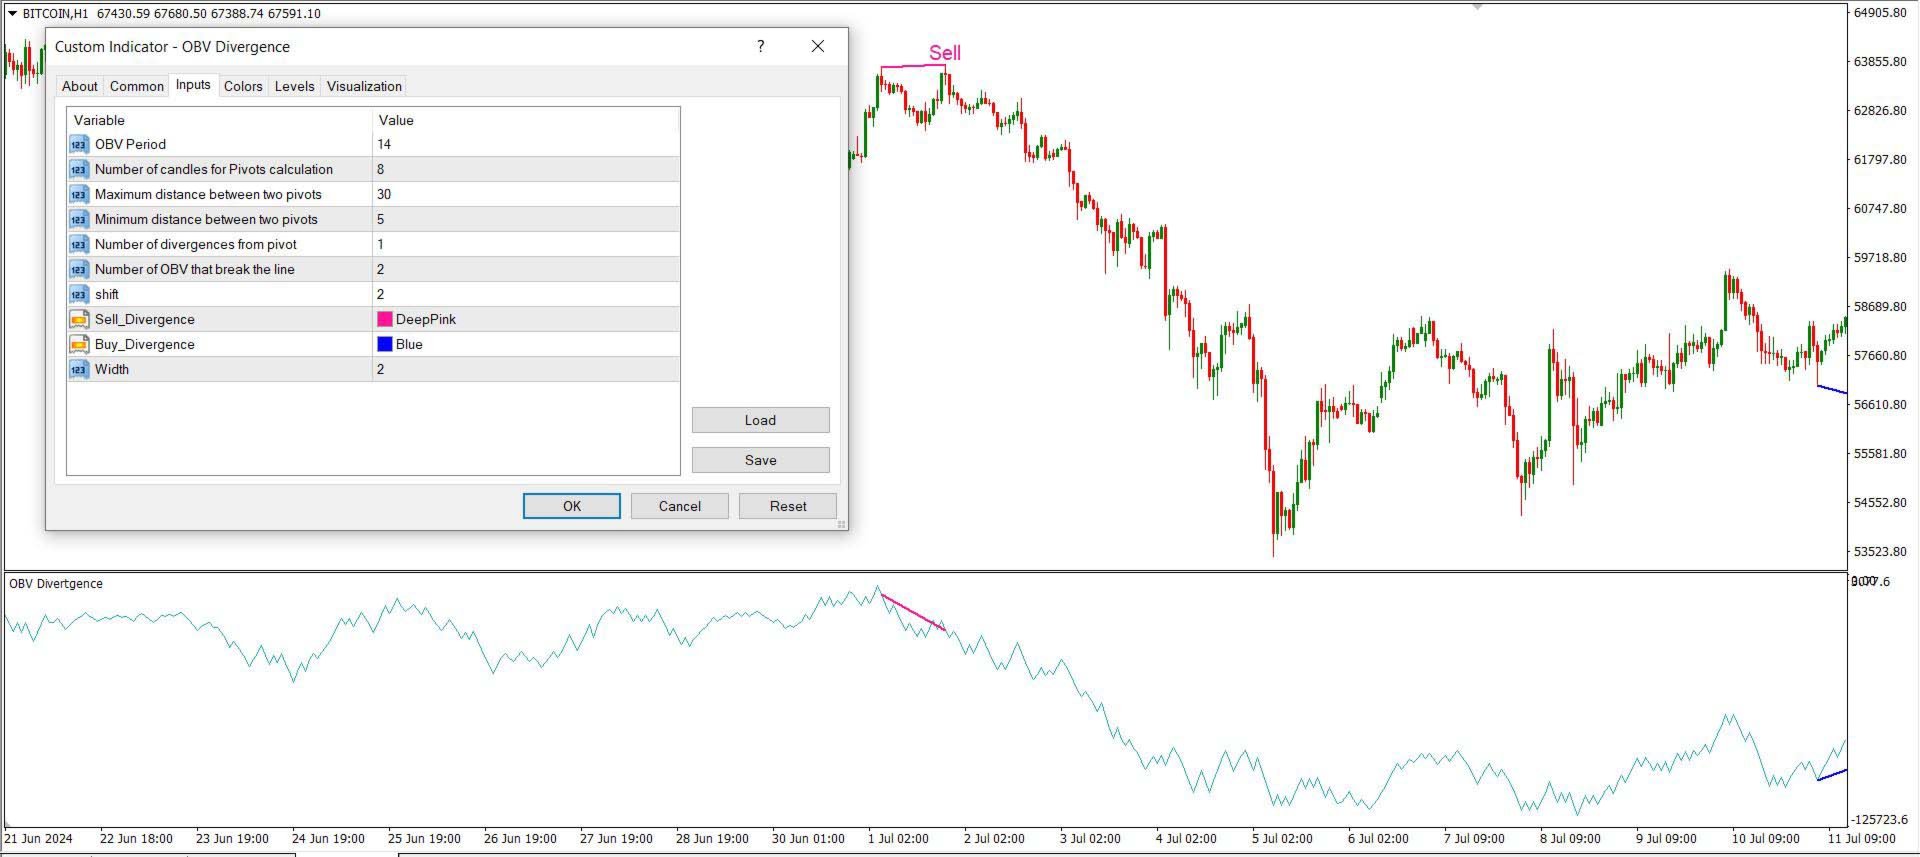
Settings of the OBV Divergence Indicator
- OBV Period: Default value is 14.
- Candles for Pivot Calculation: Set to 8 bars.
- Maximum Pivot Gap: 30 candles between pivot points.
- Minimum Pivot Gap: 5 candles minimum.
- Divergences Per Pivot: Set to detect 1 divergence per pivot.
- Breaks of OBV Line: Set to 2 breakouts.
- Shift: Applied with a value of 2.
- Sell_Divergence: Choose pink or preferred color for sell markers.
- Buy_Divergence: Choose blue or any alternate color for buy markers.
- Width: The thickness of the divergence line is customizable (default is 2).
Summary
The OBV Divergence Indicator for MetaTrader4 is a robust divergence detection tool that helps identify subtle shifts in market dynamics before they become visible on the price chart.
It's ideal for traders who rely on volume-based signals for confirming trend reversals. While highly effective in trending markets, caution is advised in sideways or ranging conditions, where false signals may occur. Use it in conjunction with other indicators or confirmation tools for best results.