MAYER Crosshair
- Indicators
- Version: 1.0
- Activations: 5
Synced Crosshair & Extreme Lines Indicator
🔹 Simple Explanation (For Everyone)
This indicator makes it super easy to analyze charts by syncing a crosshair across multiple charts of the same symbol. It helps you track price movements on different timeframes simultaneously.
Main Features:
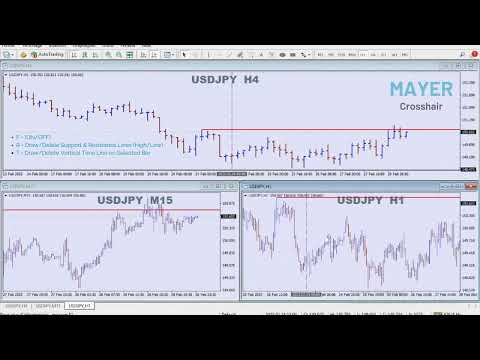
✅ Sync Crosshair Across Charts: Move the crosshair on one chart, and it updates on all other open charts with the same symbol.
✅ Toggle Crosshair with Hotkey: Press "F" to show or hide the crosshair.
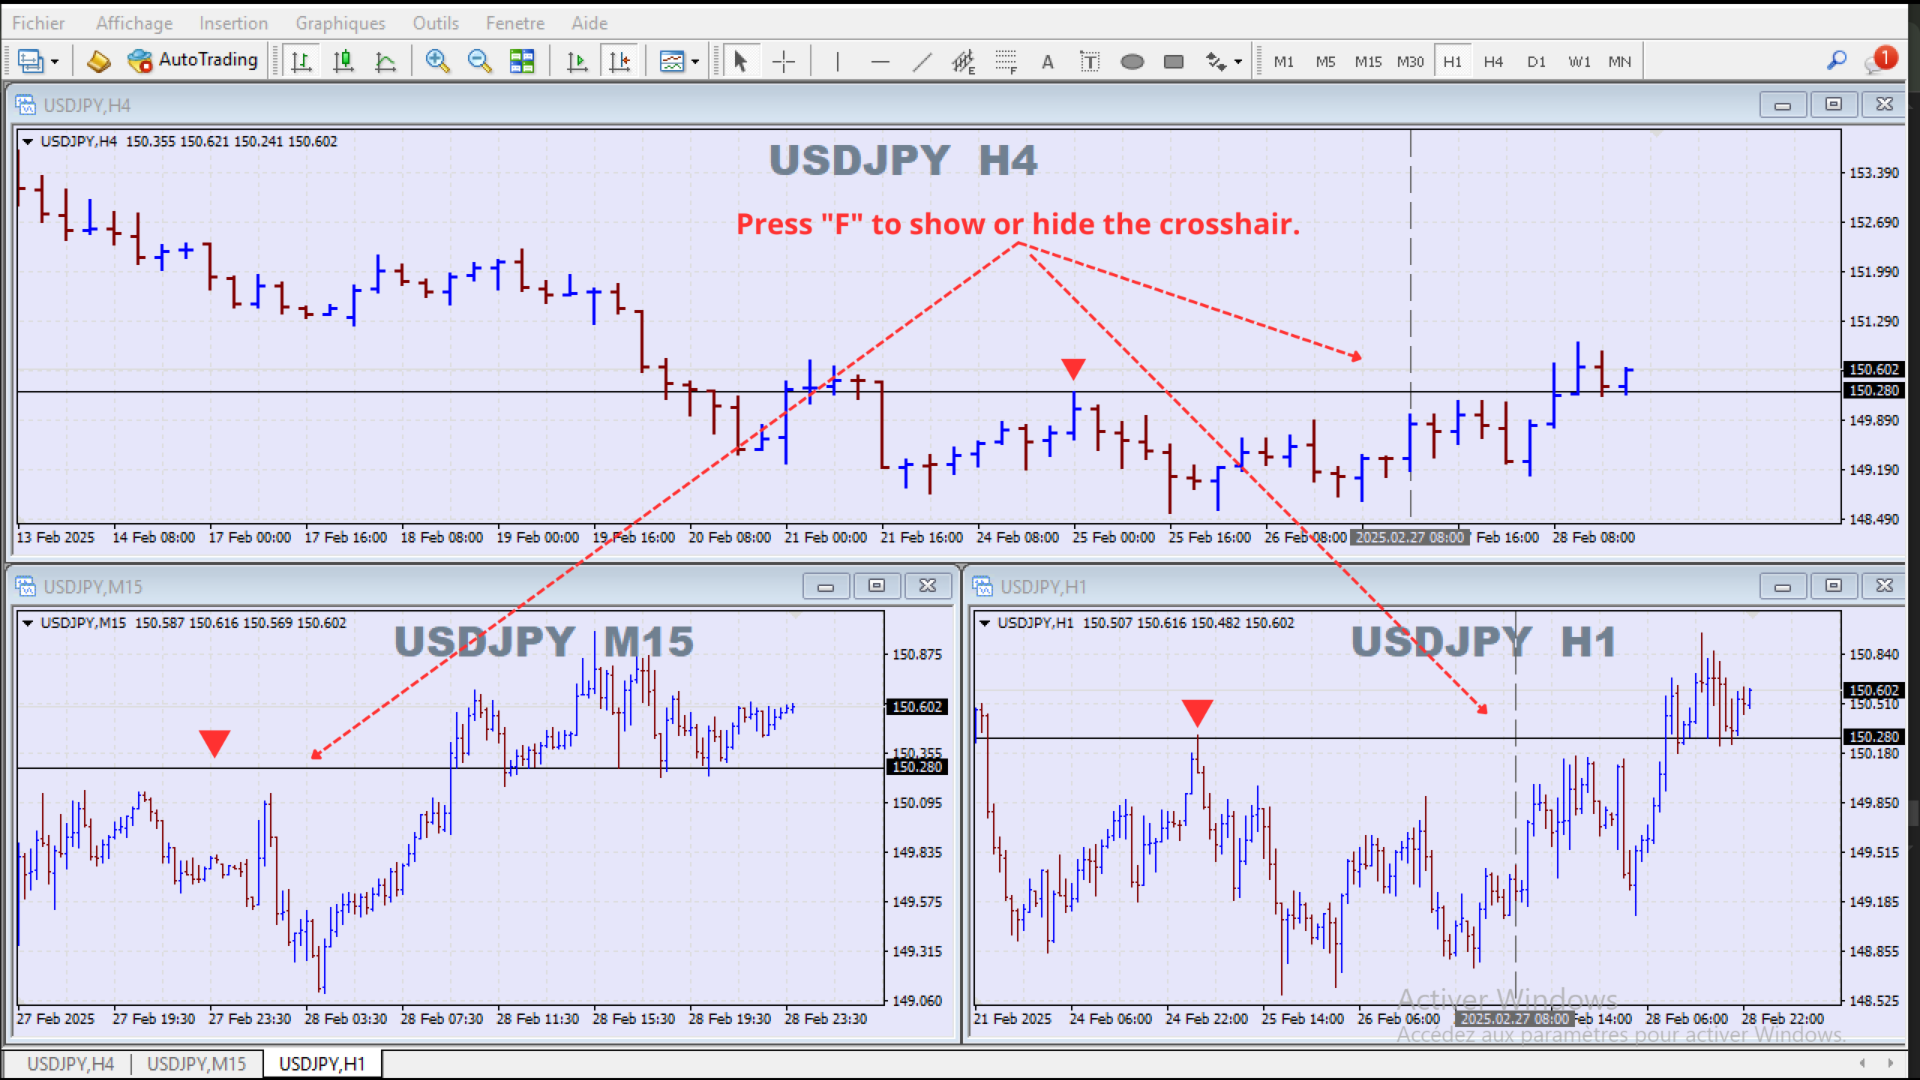
✅ Extreme High & Low Marking: Press "R" to place special horizontal lines at extreme price levels (highs/lows) for better trend analysis.
✅ Vertical Line on Target Bar: Press "T" to place a vertical line on the selected bar across all charts.
✅ Fully Customizable: Change colors, line styles, and thickness to match your preferences.
This tool is perfect for traders who want to analyze price action across multiple timeframes quickly without manually adjusting their crosshair every time.
🔹 Advanced Explanation (For Experienced Traders & Developers)
The Synced Crosshair & Extreme Lines Indicator is a multi-chart synchronization tool designed for precision technical analysis. It allows traders to seamlessly track price levels across multiple timeframes by synchronizing a crosshair and placing key support/resistance markers.
Key Functionalities:
-
Synchronized Crosshair:
- A vertical and horizontal crosshair is placed on the active chart.
- When moved, it updates in real-time across all other open charts of the same symbol.
- The crosshair can be toggled on/off using the "F" hotkey.
-
Extreme Line Feature:
- Pressing "R" creates horizontal "extreme lines" at the highest high or lowest low of the selected bar.
- The extreme line consists of two elements:
- Primary Reference Line (dotted) for visibility.
- Confirmation Line (solid) that extends historically.
- If the selected bar is already marked, pressing "R" removes the lines.
-
Vertical Line Placement:
- Pressing "T" places a synchronized vertical line on the selected bar across all charts of the same symbol.
- If the vertical line already exists, pressing "T" again removes it.
Customization & Flexibility:
- The indicator allows users to modify:
- Crosshair colors, styles, and thickness (separate settings for horizontal and vertical lines).
- Extreme line colors & styles (high and low levels can have different colors).
- Vertical line appearance (color, width, and style).
- Compatible with all timeframes and chart types (candlestick, bar, and line charts).
Why Use This Indicator?
- Enhanced Multi-Timeframe Analysis: Instantly compare price action across multiple timeframes without manually aligning your crosshair.
- Efficient Price Level Marking: Quickly highlight extreme price levels and key moments in the market.
- Fast & Intuitive Interface: Simple hotkeys make it easy to toggle features without navigating through complex settings.
This indicator is a must-have tool for price action traders, allowing you to stay focused on the market without distractions. 🚀