MAYER Crosshair
- 지표
- 버전: 1.0
- 활성화: 5
📌 동기화된 십자선 & 극단선 인디케이터
🔹 간단한 설명 (모든 트레이더를 위한 설명)
이 인디케이터는 같은 종목의 여러 차트에서 십자선을 자동으로 동기화하여 여러 시간 프레임에서 동시에 가격 움직임을 추적할 수 있도록 도와줍니다.
주요 기능:
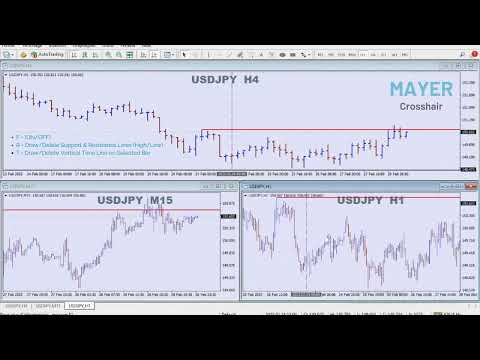
✅ 동기화된 십자선: 한 차트에서 십자선을 이동하면 같은 종목의 다른 차트에서도 자동으로 업데이트됩니다.
✅ 핫키(단축키) 지원:
- "F" – 십자선 표시/숨기기.
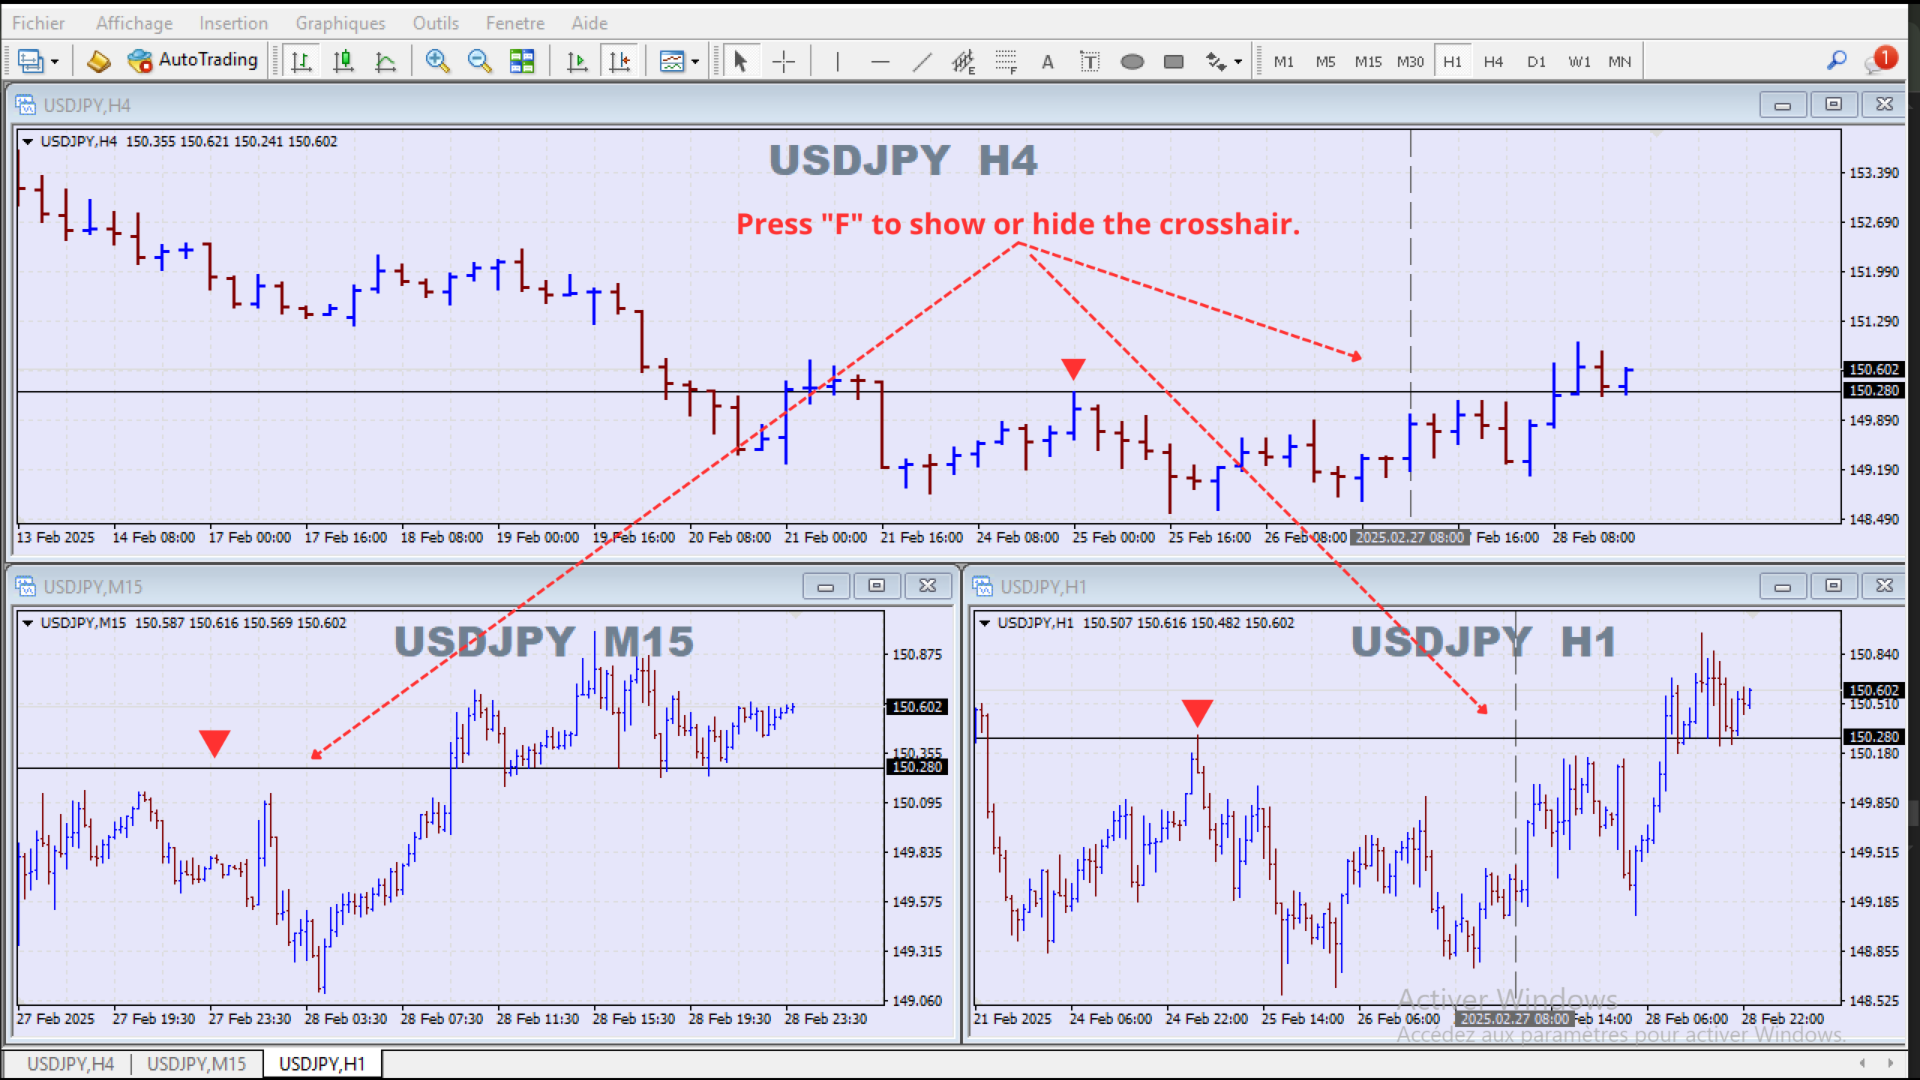
- "R" – 극단선(최고가/최저가) 추가 또는 삭제.
- "T" – 선택한 캔들에 수직선 추가 또는 삭제.
✅ 완전한 사용자 지정 가능: 선 색상, 스타일, 두께 등을 조정할 수 있습니다.
이 도구는 멀티 타임프레임 분석을 쉽게 수행할 수 있도록 도와주며, 수동으로 차트를 조정하는 번거로움을 줄여줍니다.
🔹 상세한 설명 (고급 트레이더 & 개발자를 위한 설명)
동기화된 십자선 & 극단선 인디케이터는 멀티 차트 분석을 위한 강력한 도구로, 정밀한 기술 분석을 위해 설계되었습니다.
이 인디케이터를 사용하면, 여러 시간 프레임에서 가격 수준을 쉽게 추적하고, 중요한 지지 및 저항 수준을 동기화할 수 있습니다.
주요 기능 상세 설명:
-
동기화된 십자선:
- 수평선과 수직선이 포함된 십자선을 차트에 표시합니다.
- 한 차트에서 십자선을 이동하면, 같은 종목의 모든 차트에서 자동으로 십자선이 업데이트됩니다.
- "F" 키를 사용하여 십자선을 표시하거나 숨길 수 있습니다.
-
극단선(최고가/최저가 표시):
- "R" 키를 누르면 선택한 캔들의 최고가 또는 최저가에 극단선이 추가됩니다.
- 극단선은 두 개의 요소로 구성됩니다:
- 기본 기준선(점선) – 중요한 가격 수준을 강조 표시.
- 확인선(실선) – 해당 수준이 과거에도 중요한 지점이었는지 확인 가능.
- 특정 캔들에 극단선이 이미 존재하는 경우, 다시 "R" 키를 누르면 삭제됩니다.
-
선택한 캔들에 수직선 추가:
- "T" 키를 누르면 선택한 캔들에 수직선이 추가되며, 동일한 종목의 모든 차트에서 자동으로 표시됩니다.
- 이미 수직선이 있는 경우, "T" 키를 다시 누르면 삭제됩니다.
사용자 지정 & 유연한 설정:
- 다음과 같은 설정 변경 가능:
- 십자선의 색상, 스타일, 두께 (수평선 및 수직선을 개별적으로 조정 가능).
- 극단선 색상 및 스타일 (최고가와 최저가를 각각 다르게 설정 가능).
- 수직선 스타일 조정 (색상, 두께, 스타일 변경 가능).
- 모든 시간 프레임 및 차트 유형(캔들 차트, 바 차트, 라인 차트)과 호환 가능.
이 인디케이터를 사용해야 하는 이유?
✅ 효율적인 멀티 타임프레임 분석: 여러 시간 프레임에서 가격 움직임을 쉽게 비교할 수 있음.
✅ 중요한 가격 수준을 빠르게 표시: 최고가 및 최저가를 신속하게 식별 가능.
✅ 직관적이고 사용하기 쉬움: 핫키를 활용하여 빠르게 기능을 활성화하거나 비활성화할 수 있음.
이 인디케이터는 프라이스 액션(Price Action) 기반 트레이딩을 하는 트레이더들에게 필수적인 도구로, 시장 분석을 더욱 효과적으로 할 수 있도록 도와줍니다! 🚀