MAYER Crosshair
- インディケータ
- バージョン: 1.0
- アクティベーション: 5
📌 同期クロスヘア & 極値ライン インジケーター
🔹 シンプルな説明(すべてのトレーダー向け)
このインジケーターは、同じ銘柄の複数のチャートでクロスヘアを同期し、異なる時間軸の価格動向を同時に追跡できる便利なツールです。
主な機能:
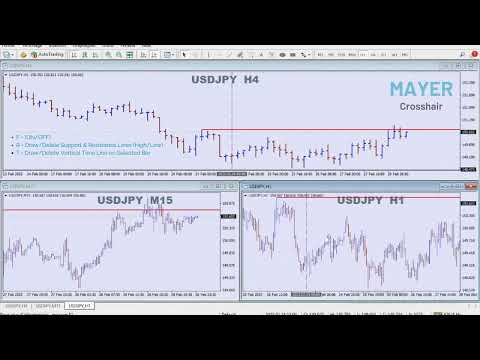
✅ 同期クロスヘア: 1つのチャートでクロスヘアを動かすと、他の同じ銘柄のチャートでも自動的に更新されます。
✅ ショートカットキーで簡単操作:
- "F" – クロスヘアの表示/非表示を切り替え。
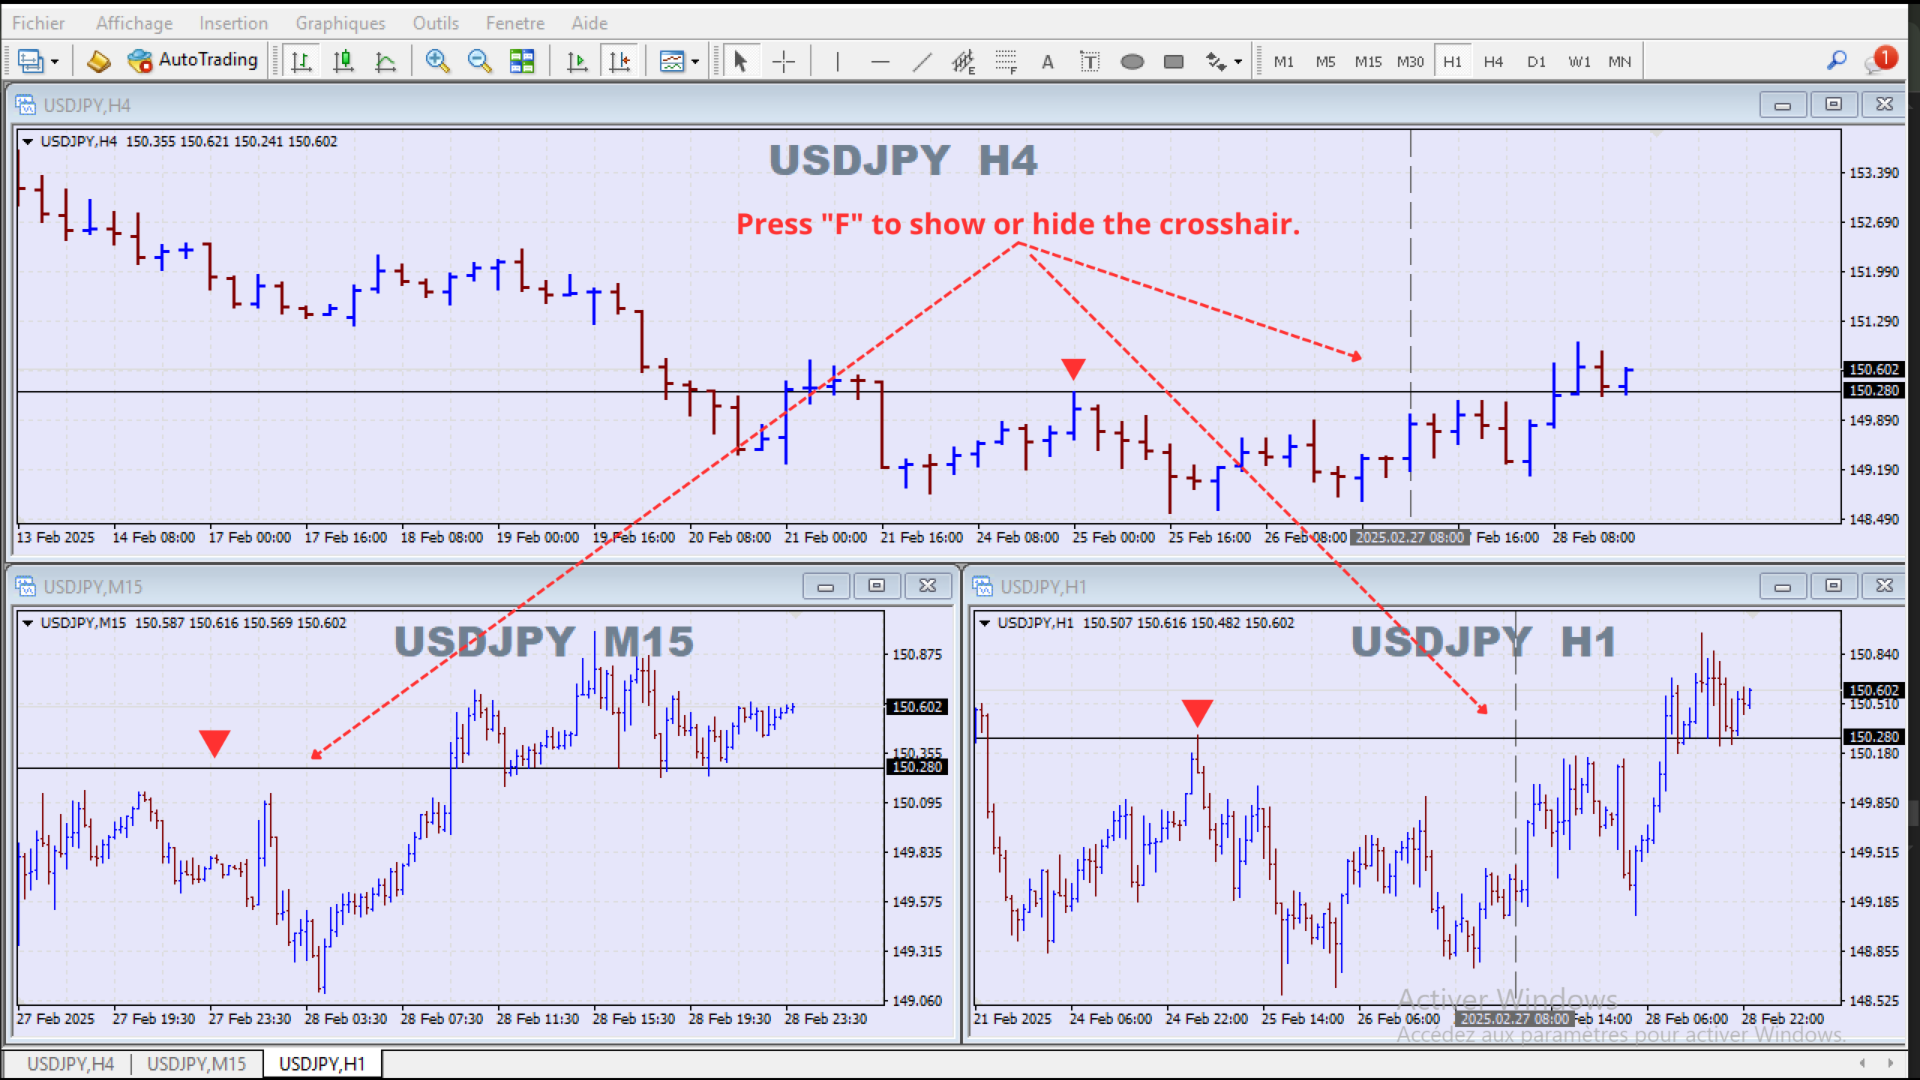
- "R" – 最高値/最安値に極値ラインを追加・削除。
- "T" – 選択したバーに垂直ラインを追加・削除。
✅ 完全カスタマイズ可能: カラー、ラインスタイル、幅などを自由に調整可能。
このツールは、手動でチャートを調整する手間を省き、マルチタイムフレーム分析をスムーズに行うのに最適です。
🔹 詳細な説明(経験豊富なトレーダー & プログラマー向け)
同期クロスヘア & 極値ライン インジケーターは、複数のチャートを同期する高度なツールで、テクニカル分析の精度を向上させます。
このインジケーターを使うことで、異なる時間軸のチャートにおいて、価格の重要なポイントを素早く確認できます。
主な機能詳細:
-
クロスヘア同期機能:
- 水平線と垂直線で構成されたクロスヘアがチャート上に表示されます。
- 1つのチャートでクロスヘアを移動すると、同じ銘柄の他のチャートでも自動更新されます。
- "F"キーで表示/非表示を切り替え可能。
-
極値ライン(最高値・最安値の記録):
- "R"キーを押すと、選択したバーの最高値または最安値にラインを追加。
- 極値ラインは以下の2種類で構成:
- メインライン(点線) – 重要な価格レベルを視覚的に強調。
- 確認ライン(実線) – 過去の価格動向と比較しやすいように延長表示。
- すでにラインがある場合は "R"キーで削除可能。
-
選択バーへの垂直ラインの追加:
- "T"キーを押すと、選択したバーに垂直ラインが追加され、同じ銘柄の他のチャートでも同期されます。
- すでにラインがある場合、"T"を押すと削除されます。
カスタマイズと柔軟性:
- 以下の設定を変更可能:
- クロスヘアの色、スタイル、太さ(水平線・垂直線を個別設定)。
- 極値ラインの色とスタイル(最高値・最安値を別々に設定可能)。
- 垂直ラインの色、太さ、スタイル。
- すべての時間軸・チャートタイプ(ローソク足、バー、ラインチャート)に対応。
なぜこのインジケーターを使うべきか?
✅ マルチタイムフレーム分析が効率的にできる: 価格の動向を異なる時間軸で簡単に比較。
✅ 重要な価格レベルを素早くマーキング: 最高値や最安値を瞬時に記録。
✅ 直感的で使いやすい: ショートカットキーで素早く切り替え、煩雑な操作不要。
このインジケーターは、プライスアクションを重視するトレーダーにとって必須のツールであり、マーケット分析をよりスムーズに行えます!🚀