• Overview
  • Reviews
  • Comments
  • What's new

MACD Color Indicator

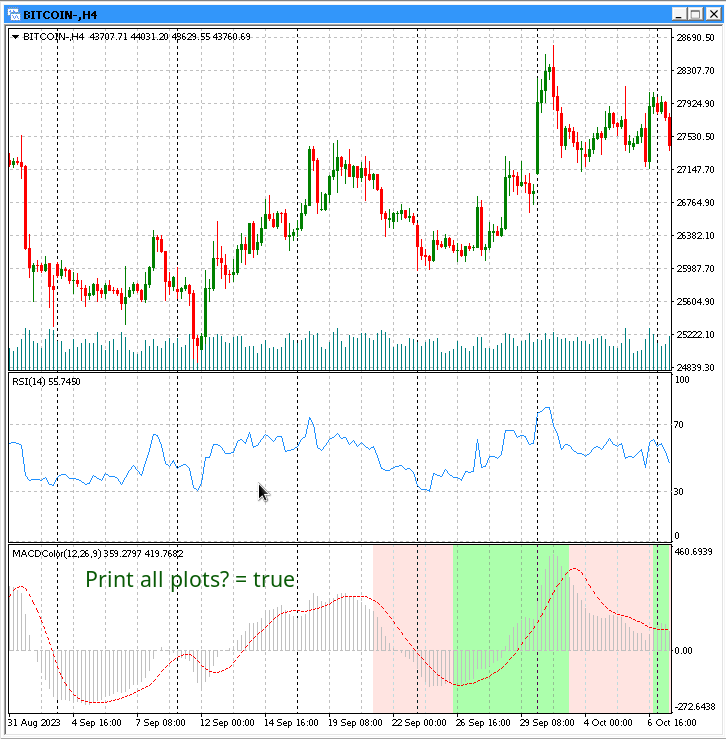
MACD Indicator with color background based on buy or sell trend


This indicator colors the background based on the value of the MACD (Moving Average Convergence Divergence) indicator, depending on its buying or selling tendency. The background color is determined based on the stochastic oscillator parameters, painting only the last 400 bars (see notes) and is used to measure the strength of a trend and the probability of a reversal.

The parameters you can modify are the same as those provided by the Metatrader MACD indicator and additionally those needed to edit the colors you decide are the most suitable for you. The following are the parameters you can modify:

  • Fast EMA: Period for the fast exponential moving average.
  • Slow EMA: Period for the slow exponential moving average.
  • MACD SMA: Simple moving average to calculate the MACD signal line.
  • Apply To: (Close price, Open price, High price, Low price, Median price, Typical price, Weighted price).
  • Color Positive Trend: Background color for an uptrend.
  • Color Negative Trend: Background color for a downtrend.
  • Color Neutral Trend: Background color for a neutral trend.
  • Print all plots?: By default, only the indicator values for up to two weeks are drawn. If you want more values, from the beginning of the bars, you will need to use the "true" value (see notes).


How to use the indicator

It works like any other Metatrader indicator that is dragged and dropped onto the chart.
Conclusion

This indicator is a useful tool for traders who use the MACD indicator. It makes it easy to identify bullish, bearish, and neutral trends in real time.

Notes

  1. If you are a market analyst or your trading uses different timeframes, it is recommended to use the free tool: https://www.mql5.com/en/market/product/109511
  2. Due to high resource consumption and fast execution, it is recommended to use the parameter "Print all plots? = false". This will limit the values obtained by the indicator to a maximum of two weeks (or the bars defined in your Metatrader Options).
  3. The restriction to 400 bars is because a market trader usually needs quick visual data, hence this limitation. (Please leave any comments on this matter in the corresponding section). In any case, if you want to overcome this limitation momentarily, you can also use the free tool mentioned in the first note to use it from the bars where you are interested to the current time, both tools were developed to be compatible.


Recommended products
Introducing the Consecutive Green/Red Candle Alert Indicator for MT4 - Your Trend Spotting Companion! Are you ready to take your trading to the next level? We present the Consecutive Green/Red Candle Alert Indicator, a powerful tool designed to help you spot trends and potential reversals with ease. Whether you're a new trader looking for clarity in the market or an experienced pro seeking additional confirmation, this indicator is your trusted companion. Key Features of the Consecutive Green/Re
FREE
DeM Candles AM
Andriy Matviyevs'kyy
The indicator identifies the strength of the trend based on the points where the DeMarker indicator exceeds the overbought and oversold levels. The indicator does not redraw. This indicator: Suitable for all markets;  Not redrawn; Intuitive and simple; It can be useful for both beginners and experienced traders; Allows you to identify market entry points where there is a high probability of a significant price movement sufficient for a successful transaction; Settings: Ind_Period (>1)   - peri
FREE
MACD EXPLANATION Moving average convergence divergence (MACD, or MAC-D) is a   trend-following   momentum   indicator that shows the relationship between two   exponential moving averages   (EMA's) of a price. The MACD is calculated by subtracting the 26-period   exponential moving average   (EMA) from the 12-period EMA. macd is one of the best momentum indicators  macd is used by a lot of professional traders when it comes to continuous trade macd is the best choice  if used properly even a ne
Hull Signal AM
Andriy Matviyevs'kyy
The presented indicator marks signals on the price chart with arrows in accordance with the data of the Hull Momentum AM indicator. The indicator gives a signal and sends a notification to the mobile terminal and email. The indicator is part of a series of indicators -  Hull Line AM, Hull Momentum AM, Hull Candles AM, Hull Signal AM . For a better understanding of the operation of each of the indicators, it is recommended to start working with them by using them together on one chart. The Hull M
FREE
OsMA Arrow MTF
Pavel Shutovskiy
3.92 (12)
The indicator displays crossing zero level by Moving Average of Oscillator (OsMA) in the form of arrows. The this is a multi-timeframe indicator, and it displays signals from other timeframes. The indicator notifies about a signal by means of a pop-up Alert window, or sending notification to e-mail. Parameters Time-frame - select timeframe to show indicator signals. Fast EMA Period - fast EMA. This is an exponential moving average from a price with a short period. Slow EMA Period - slow EMA. T
FREE
MACD Divergence MT4
KEENBASE SOFTWARE SOLUTIONS
KT MACD Divergence shows the regular and hidden divergences build between the price and oscillator. If your trading strategy anticipates the trend reversal, you can include the MACD regular divergence to speculate the potential turning points. And if your trading strategy based on the trend continuation, MACD hidden divergence would be a good fit. Limitations of KT MACD Divergence Using the macd divergence as a standalone entry signal can be a risky affair. Every divergence can't be interpr
MACD (short for Moving Average Convergence/Divergence) is one of the most famous and oldest indicators ever created and is widely used among beginners . However, there is a newer version of the MACD that is named Impulse MACD  which have less false signals than the standard MACD. Classic MACD helps us to identify potential trends by displaying crossovers between two lines. If MACD line crosses above the Signal line it shows us that the market is potentially up trending and that it would be a go
PLEASE NOTE:   You can  customize the settings of all 3 EMA as per your requirement. The accuracy will change as per your settings. 100% Non repaint Pre-alert (get ready) signals Non-delay indications 24/7 signals 100% No lag No recalculating Lifetime license This is a EMA crossover indicator and its 100% non repaint indicator. The EMA_1 and the EMA_2 is based on which signal is generated. EMA_3 is a Higher EMA value which will remain below or above the candle (market) to identify the trend. M
With the MACD Multi Time Frame indicator, you can spot divergences of higher timeframes while you are searching for pinpointed entries on lower timeframes. This FREE version of the indicator works only on EURUSD and GBPUSD. The full version of the indicator can be found here: MACD Multi Time Frame This blog post gives you REAL-TIME MACD Divergence Analysis for FREE and tips how to trade the divergences: REAL-TIME MACD Divergence Analysis The MACD Multi Time Frame gives you a very good overview o
FREE
MACDivergence MTF
Pavel Zamoshnikov
4.29 (7)
Advanced ideas of the popular MACD indicator: It detects and displays classic and reverse divergences (three methods of detecting divergences). It uses different color to highlight an uptrend and a downtrend. Two methods of determining a trend: а) MACD crosses the 0 level (classic signal); б) MACD crosses its own average (early signal). This is a multi-timeframe indicator: it can display MACD data from other timeframes. Two methods of drawing: classic histogram and line. It generates sound and v
Bolinger Band Arrows
Humphrey Kebaya Mwamba
A visual tool to assist in trading and analysing bolinger bands.  Arrows are not to be used for entry but rather assist in developing potential bias. Repaints in lower timeframes. Predicts if price will be higher or lower than the signal candle. Perfect for mean reversion trading, binary options or futures contracts on larger time frames. The indicator was backtested on 5 years of data and has a 90% accuracy for predicting price reversals over time.
FREE
A trend indicator based on the Ichimoku Kinko Hyo and MACD. The ICloud Scalper Trend Indy is an improved variant of the Ichimoku Kinko Hyo and MACD, which shows the moment of trend following quite accurately. It is often used as a signal filter. Combination of two indicators makes a better use of these advantages: Ichimoku Kinko Hyo identifies the trend, while MACD determines the short-term movements and signals in the trend direction. Messages/Sounds (Notifications and sound settings) ON/OFF
Indicator for binary options arrow is easy to use and does not require configuration works on all currency pairs, cryptocurrencies buy signal blue up arrow sell signal red down arrow tips do not trade during news and 15-30 minutes before their release, as the market is too volatile and there is a lot of noise it is worth entering trades one or two candles from the current period (recommended for 1 candle) timeframe up to m 15 recommended money management fixed lot or fixed percentage of the depo
GTAS STrend
Riviera Systems
4 (4)
GTAS S-Trend is a momentum indicator that helps to determine trends using combination of MACD, RSI and moving averages. This indicator was created by Bernard Prats Desclaux, proprietary trader and ex-hedge fund manager, founder of E-Winvest. Description The indicator oscillates between -65 and +65 with a neutral zone between -25 and +25 around a 0 equilibrium line. S-Trend between -25 and +25 indicates congestion zones with a bullish bias between 0 and +25, and a bearish bias between 0 and -25
FREE
Download the free version   here. Divergence Divergence refers to when the price of a currency pair moves in one direction while the trend indicator is moving in the opposite direction. With divergence, there can be positive and negative signals. Divergences in Forex trading are quite common signals of technical analysis. These are basic early Forex signals indicating the trend reversal and filter false signals. Application of this indicator It is usually not easy to detect divergences by the t
This scanner shows the trend values of the well known indicator SuperTrend for up to 30 instruments and 8 time frames. You can get alerts via MT4, Email and Push-Notification as soon as the direction of the trend changes. This is the FREE version of the indicator: SuperTrend Scanner The free version works only on EURUSD and GBPUSD! Important Information How you can maximize the potential of the scanner, please read here: www.mql5.com/en/blogs/post/718074 With the following FREE indicator you
FREE
MTF Stochastic and RSI
Georgiy Gazaryan
5 (2)
A simple but effective helper that will allow you to track both global and local market trends. The indicator combines the work of two oscillators: Stochastic and RSI. Both indicators can be set to any timeframe. Advantages of Use Multitimeframe - you can adjust both indicators to the desired timeframes. To obtain the entry points, you can use the Elder's triple screen system. Highly customizable - you can configure not only the parameters of the indicators, but also their appearance (color an
FREE
Convergence is when the higher highs and higher lows of an uptrend are also confirmed by our indicator making lower lows which helps us confirm that momentum is increasing and so the trend is likely to continue. Vice versa for a downtrend. Divergence is when we get higher highs on an uptrend but which are not supported by our indicator which makes lower highs and therefore signals the underlying momentum is failing and so a reversal might occur. Vice versa for downtrend. I have combined these me
This Cross Trend Signal indicator uses Donchian channel and ATR indicators. This trend tracking system uses historical data to buy and sell. This indicator does not repaint. The point at which the signal is given does not change. You can use it in all graphics. You can use it in all pairs. This indicator shows the input and output signals as arrows and alert. Open long deals on blue arrows Open short deals on red arrows When sl_tp is set to true, the indicator will send you the close long and cl
IMA Finder MT4
Mubashir Mohamed Quraish Albarakat
5 (1)
This indicator is designed based on the Moving Origin indicator When the moving origin indicator breaks the price, this indicator gives a signal It is useful for better viewing of signals and analysis on them Attributes: Can be used in all symbols Can be used in all time frames Too many signals Simple and quick settings Easy way to work Settings: period: like moving average settings alarmShow: If you want to receive an alert in Metatrader after receiving the signal, enable this setting a
FREE
Based on MACD indicator waves with standard parameters Applies Fibonacci levels to the last two MACD waves, positive and negative respectively, if at the moment the MACD indicator runs out of negative Wave - the color is green, if at the moment the MACD indicator runs out of positive Wave - the color is red. The Wave termination criterion is two ticks with a different MACD sign. Applies trend lines on the last four MACD Waves. Works well with the expert Figures MACD   https://www.mql5.com/ru/mar
CCI Signal 2 AM
Andriy Matviyevs'kyy
This indicator displays the moment when the CCI oscillator crosses the zero value, and the moment when the CCI oscillator crosses its smoothed value. Crossing the zero value by the CCI oscillator is a buy/sell signal. If the CCI oscillator crosses its smoothed value, it is a signal of a trend change. The signal is given after the end of the formation of the candle. The signal is confirmed when the price crosses the high/low of the bar on which the signal was given. The indicator does not redraw.
FREE
Real Magic Trend
Muhammed Emin Ugur
This   Real Magic Trend   indicator is designed for signal trading. This indicator generates trend signals. It uses many algorithms and indicators to generate this signal. It tries to generate signals from the points with the highest trend potential. This indicator is a complete trading product. This indicator does not need any additional indicators. The indicator is never repainted. The point at which the signal is given does not change.      Features and Recommendations Time Frame
An indicator that will help you trade. This indicator will show trend reversals as well as pullbacks. When the arrow appears, it will mean that now the trend will either change its direction, or there will be a rollback from the main movement. In any of the cases, if the trader knows about it in advance, it is possible to open trades effectively. This indicator does not redraw its values. The arrow appears at the beginning of the candle and stays there. How to trade with this indicator: W
KF Trix MT4
Sevgi Hilal Kilic
5 (2)
KF Trix V1.00 The triple exponential average (TRIX) indicator is an oscillator used to identify oversold and overbought markets and is also a momentum indicator. The triple smoothing of moving averages is designed to filter out price movements that are considered insignificant or unimportant. About Software details and MQL login link Copyright 2022, Forex KRAL
FREE
Email Drawdown Alert
Roman Starostin
5 (15)
Free informative Indicator-helper. It'll be usefull for traders who trade many symbols or using grid systems (Averaging or Martingale). Indicator counts drawdown as percent and currency separate. It has a number of settings: Count deposite drawdown according equity value and send e-mail or notifications to user if DD more than set; Sending e-mail when max open orders reached; Shows price and remaining pips amount before MarginCall on current chart and Account generally; Display summary trade lot
FREE
Sto Signal AM
Andriy Matviyevs'kyy
This indicator displays Stochastic osc signals on the price chart and allows the user to receive notifications of such signals. The Stochastic indicator is a classic and proven indicator of the technical analysis of the markets. Despite its age, it is still relevant today. Depending on the settings, the indicator allows you to work effectively on various TFs and any markets. Signals are given on fully formed bars and are not redrawn. Custom Parameters: Stochastic_Price (0-1) - The applied pric
FREE
Ultimate Trend Finder (Multi Pair And Multi Time Frame) :   ---LIMITED TIME OFFER: NEXT 25 CLIENTS ONLY ---46% OFF REGULAR PRICE AND 2 FREE BONUSES ---SEE BELOW FOR FULL DETAILS Institutional traders use moving averages more than  any  other indicator. As moving averages offer a quick  and clear indication of the institutional order flow. And serve as a critical component in the decision making  within numerous institutional trading rooms. Viewing the market through the same lens as the i
RSI Signal 2 AM
Andriy Matviyevs'kyy
This indicator displays the moment when the RSI oscillator crosses the zero value, and the moment when the RSI oscillator crosses its smoothed value. Crossing the zero value by the RSI oscillator is a buy/sell signal. If the RSI oscillator crosses its smoothed value, it is a signal of a trend change. The signal is given after the end of the formation of the candle. The signal is confirmed when the price crosses the high/low of the bar on which the signal was given. The indicator does not redraw.
FREE
User friendly indicator.  This indicator will help you catch the trend an fast as possible. Indicator developed based on moving averages. User can select which type of moving averages they want to use. Indicator draws an arrow when the moving average crosses. The moving average cross over arrow can be filtered with RSI, OsMA, and Parabolic Sar. There are options for selecting specific criteria for the filters.  Such as period of Rsi and Rsi levels. OsMA and Parabolic Sar criteria can also be sel
Buyers of this product also purchase
Gann Made Easy
Oleg Rodin
4.92 (60)
Gann Made Easy is a professional and easy to use Forex trading system which is based on the best principles of trading using the theory of mr. W.D. Gann. The indicator provides accurate BUY and SELL signals including Stop Loss and Take Profit Levels. You can trade even on the go using PUSH notifications. PLEASE CONTACT ME AFTER PURCHASE TO GET MY TRADING TIPS PLUS A GREAT BONUS! Probably you heard already many times about Gann trading methods. Usually Gann's theory is very complex thing not only
This indicator I use with RENKO and RangeBar candle Discover the Secret to Successful Forex Trading with Our Custom MT4 Indicator! Have you ever wondered how to achieve success in the Forex market, consistently earning profits while minimizing risk? Here is the answer you've been searching for! Allow us to introduce our proprietary MT4 indicator that will revolutionize your approach to trading. Unique Versatility Our indicator is specially designed for users who prefer Renko and Rangebar candle
Atomic Analyst
Issam Kassas
5 (3)
First of all Its worth emphasizing here that this Trading Indicator is   Non-Repainting ,   Non-Redrawing   and   Non-Lagging   Indicator, Which makes it ideal from both manual and robot trading.  User manual: settings, inputs and strategy . The Atomic Analyst  is a PA Price Action Indicator that uses Strength and Momentum of the price to find a better edge in the market. Equipped with Advanced filters which help remove noises and false signals, and Increase Trading Potential. Using Multiple la
CURRENTLY 26% OFF Best Solution for any Newbie or Expert Trader! This Indicator is a unique, high quality and affordable trading tool because we have incorporated a number of proprietary features and a new formula. With only ONE chart you can read Currency Strength for 28 Forex pairs! Imagine how your trading will improve because you are able to pinpoint the exact trigger point of a new trend or scalping opportunity? User manual: click here That's the first one, the original! Don't buy a worthle
Advanced Supply Demand
Bernhard Schweigert
4.92 (310)
CURRENTLY 26% OFF !! Best Solution for any Newbie or Expert Trader! This indicator is a unique, high quality and affordable trading tool because we have incorporated a number of proprietary features and a new formula. With this update, you will be able to show double timeframe zones. You will not only be able to show a higher TF but to show both, the chart TF, PLUS the higher TF: SHOWING NESTED ZONES. All Supply Demand traders will love it. :) Important Information Revealed Maximize the potenti
TPSpro RFI Levels
Roman Podpora
5 (13)
A key element in trading is zones or levels from which decisions to buy or sell a trading instrument are made. Despite attempts by major players to conceal their presence in the market, they inevitably leave traces. Our task was to learn how to identify these traces and interpret them correctly. Reversal First Impulse levels (RFI)   -  Version MT5                INSTRUCTIONS                 RUS                 ENG                                       R ecommended to use with an indicator   -  
Break and Retest
Mohamed Hassan
4.56 (9)
‍You can visually backtest Break & Retest to see how it behaved in the past!     Manual guide:   Click here $65  for only 1  copy left! Next price is $120 .  This Indicator only places quality trades when the market is really in your favor with a clear break and retest. Patience is key with this price action strategy! Recommended timeframes: M1 for Scalpers.  M15 for Intraday traders. H1 & H4 for Day traders. Other timeframes are also excellent! After many months of hard w
ON Trade Optuma Astro
Abdullah Alrai
5 (4)
This is an astronomy indicator for the MT4 platform like optuma program that performs a variety of functions. It uses complex algorithms to perform its own calculations, which are so accurate. The indicator has a panel that provides astronomical information such as planets' geo/heliocentric cords, distance of sun/earth, magnitude, elongation, constellation, ecliptic cords, equatorial cords, and horizontal cords depending on  the vertical line that generated by the indicator depend on the time va
Introducing   Quantum Trend Sniper Indicator , the groundbreaking MQL5 Indicator that's transforming the way you identify and trade trend reversals! Developed by a team of experienced traders with trading experience of over 13 years,   Quantum Trend Sniper Indicator   is designed to propel your trading journey to new heights with its innovative way of identifying trend reversals with extremely high accuracy. ***Buy Quantum Trend Sniper Indicator and you could get Quantum Breakout Indicator fo
First of all Its worth emphasizing here that this Trading Tool is Non-Repainting Non-Redrawing and Non-Lagging Indicator Which makes it ideal for professional trading . Online course, user manual and demo. The Smart Price Action Concepts Indicator is a very powerful tool for both new and experienced traders . It packs more than 20 useful indicators into one combining advanced trading ideas like Inner Circle Trader Analysis and Smart Money Concepts Trading Strategies . This indicator focuses on
on free demo press zoom out button to see back.. cnt number is bar numbers.you can change up to 3000 related to chart bars numbers. minimum value is 500. there is g value set to 10000. sometimes need to lower or increase. and if they need can make small change on it. this indicator almost grail,no repaint and all pairs ,all timeframe indicator. there is red and blue histograms. if gold x sign comes on red histogram that is sell signal. if blue x sign comes on blue histogram that is buy signal.
Introducing ON Trade Waves Patterns Harmonic Elliot Wolfe, an advanced indicator designed to detect various market patterns using both manual and automated methods. Here's how it works: Harmonic Patterns: This indicator can identify harmonic patterns that appear on your chart. These patterns are essential for traders practicing harmonic trading theory, as popularized by Scott Carney's book "Harmonic Trading vol 1&2." Whether you draw them manually or rely on automated detection, ON Trade Waves
Trend Screener
STE S.S.COMPANY
4.83 (86)
Unlock the Power of  Trends trading with Trend Screener Indicator: Your Ultimate Trend Trading Solution powered by fuzzy logic and Multi-currencies System ! Elevate your trend trading with Trend Screener, the revolutionary trend indicator powered by   fuzzy logic.  It is a powerful trend-following indicator that combines over  13 premium tools and features and 3 trading strategies  , making it a versatile choice to   make your Metatrader a Trend Analyzer. LIMITED TIME OFFER : Trend Screener Indi
TPSproTREND PrO
Roman Podpora
5 (15)
TPSpro TRENDPRO  - is a trend indicator that automatically analyzes the market and provides information about the trend and each of its changes, as well as giving signals for entering trades without redrawing! The indicator uses each candle, analyzing them separately. referring to different impulses - up or down impulse. Exact entry points into transactions for currencies, crypto, metals, stocks, indices!  -  Version MT5               DETAILED DESCRIPTION        /       TRADING SETUPS           
Scalper Vault
Oleg Rodin
5 (28)
Scalper Vault is a professional scalping system which provides you with everything you need for successful scalping. This indicator is a complete trading system which can be used by forex and binary options traders. The recommended time frame is M5. The system provides you with accurate arrow signals in the direction of the trend. It also provides you with top and bottom signals and Gann market levels. The indicator provides all types of alerts including PUSH notifications. Please contact me aft
Advanced Currency IMPULSE with ALERT
Bernhard Schweigert
4.91 (494)
CURRENTLY 31% OFF !! Best Solution for any Newbie or Expert Trader! This indicator is a unique, high quality and affordable trading tool because we have incorporated a number of proprietary features and a secret formula. With only ONE chart it gives Alerts for all 28 currency pairs. Imagine how your trading will improve because you are able to pinpoint the exact trigger point of a new trend or scalping opportunity! Built on new underlying algorithms it makes it even easier to identify and confir
Currency Strength Wizard is a very powerful indicator that provides you with all-in-one solution for successful trading. The indicator calculates the power of this or that forex pair using the data of all currencies on multiple time frames. This data is represented in a form of easy to use currency index and currency power lines which you can use to see the power of this or that currency. All you need is attach the indicator to the chart you want to trade and the indicator will show you real str
The BB Reversal Arrows technical trading system has been developed to predict reverse points for making retail decisions. The current market situation is analyzed by the indicator and structured for several criteria: the expectation of reversal moments, potential turning points, purchase and sale signals. The indicator does not contain excess information, has a visual understandable interface, allowing traders to make reasonable decisions. All arrows appear to close the candle, without redr
Market Reversal Alerts
LEE SAMSON
4.21 (121)
Profit from market structure changes as price reverses and pulls back. The market structure reversal alert indicator identifies when a trend or price move is approaching exhaustion and ready to reverse. It alerts you to changes in market structure which typically occur when a reversal or major pullback are about to happen. The indicator identifies breakouts and price momentum initially, every time a new high or low is formed near a possible exhaustion point. The indicator draws in a rectangle on
Up down v6T
Guner Koca
5 (1)
Thise indicator is up down v6  comes with tradingwiev pinescript. purchased people, after installed on terminal ,contact me on mql5  to get BONUS  TradingView pinescript. up-down indicator is no repaint and works all pairs and lower than weekly time frames charts. it is suitable also 1 m charts for all pairs. and hold long way to signal. dont gives too many signals. when red histogram cross trigger line that is up signal.and price probably will down when blue histogram cross trigger line that
Entry Points Pro
Yury Orlov
4.7 (225)
Top indicator for MT4 providing accurate signals to enter a trade without repainting! Watch  the video  (6:22) with an example of processing only one signal that paid off the indicator! It can be applied to any financial assets:  forex, cryptocurrencies, metals, stocks, indices.  MT5 version is here   It will provide pretty accurate trading signals and tell you when it's best to open a trade and close it. Most traders improve their trading results during the first trading week with the help of t
Currently 20% OFF ! Best Solution for any Newbie or Expert Trader! This dashboard software is working on 28 currency pairs plus one. It is based on 2 of our main indicators (Advanced Currency Strength 28 and Advanced Currency Impulse). It gives a great overview of the entire Forex market plus Gold or 1 indices. It shows Advanced Currency Strength values, currency speed of movement and signals for 28 Forex pairs in all (9) timeframes. Imagine how your trading will improve when you can watch the e
Symbols must be separated by commas (,) and entered into the parameters exactly as displayed by your broker to ensure they are recognized in the dashboard. These symbols will be used for analysis by the indicator. With one click open any pair any timeframe directly from dashboard The MA Speedometer Dashboard is a highly functional MetaTrader 4 (MT4) indicator designed to enhance trading strategies through dynamic market analysis. It offers robust features for identifying market trends, trading
TrendMaestro
Stefano Frisetti
5 (2)
note: this indicator is for METATRADER4, if you want the version for METATRADER5 this is the link:  https://www.mql5.com/it/market/product/108106 TRENDMAESTRO ver 2.4 TRENDMAESTRO recognizes a new TREND in the bud, he never makes mistakes. The certainty of identifying a new TREND is priceless. DESCRIPTION TRENDMAESTRO identifies a new TREND in the bud, this indicator examines the volatility, volumes and momentum to identify the moment in which there is an explosion of one or more of these data a
FX Power MT4 NG
Daniel Stein
5 (9)
Trading GOLD, and currencies, with the dog walk strategy  - super smart Trading GOLD, and currencies, with the breakout strategy  - super easy Visit our all-new   Stein Investments Welcome Page   to get the latest information, updates and trading strategies. FX Power MT4 NG  is the next generation of our long-time very popular currency strength meter, FX Power.  And what does this next-generation strength meter offer? Everything you have loved about the original FX Power  PLUS GOLD/XAU stre
IX Power MT4
Daniel Stein
5 (5)
IX Power finally brings the unbeatable precision of FX Power to non-Forex symbols. It accurately determines the intensity of short, medium and long-term trends in your favourite indices, stocks, commodities, ETFs, and even cryptocurrencies. You can analyse everything your terminal has to offer. Try it out and experience how your timing improves significantly when trading. Read about our latest strategic development -  Easy scalping with IX Power Visit our all-new   Stein Investments Welcome
77% discount for the next 10 buyers (original price $605): 1 left 3 Indicators in 1 indicator Strategy based on price action Made specifically for the best forex currency pairs Can be used in the best time frame of the market at a very reasonable price This indicator is basically 3 different indicatos . But we have combined these 3 indicators in 1 indicator so that you can use 3 indicators at the lowest price. All three strategies are based on price action. But based on different trends.
Quantum Breakout Indicator PRO
Bogdan Ion Puscasu
4.96 (26)
Introducing   Quantum Breakout PRO , the groundbreaking MQL5 Indicator that's transforming the way you trade Breakout Zones! Developed by a team of experienced traders with trading experience of over 13 years, Quantum Breakout PRO is designed to propel your trading journey to new heights with its innovative and dynamic breakout zone strategy. Quantum Breakout Indicator will give you signal arrows on breakout zones with 5 profit target zones and stop loss suggestion based on the breakout box.
Scalper Inside PRO
Alexey Minkov
4.75 (57)
An exclusive indicator that utilizes an innovative algorithm to swiftly and accurately determine the market trend. The indicator automatically calculates opening, closing, and profit levels, providing detailed trading statistics. With these features, you can choose the most appropriate trading instrument for the current market conditions. Additionally, you can easily integrate your own arrow indicators into Scalper Inside Pro to quickly evaluate their statistics and profitability. Scalper Inside
PRO Renko System
Oleg Rodin
5 (25)
PRO Renko System is a highly accurate trading system specially designed for trading RENKO charts. The ARROWS and Trend Indicators DO NOT REPAINT! The system effectively neutralizes so called market noise giving you access to accurate reversal signals. The indicator is very easy to use and has only one parameter responsible for signal generation. You can easily adapt the tool to any trading instrument of your choice and the size of the renko bar. I am always ready to provide extra support to help
More from author
MACD Color Script
Adrian Hernandez Castellanos
A script (drag-and-drop) that colors the background of the MACD indicator according to the buy or sell trend. The parameters that you can modify are the same as those provided by the MetaTrader MACD indicator and additionally those necessary to edit the colors that you decide are the most appropriate according to your preferences. The following are the parameters that you can modify: Fast EMA. Slow EMA. MACD SMA. Apply To. Color Positive Trend. Color Negative Trend. Color Neutral Trend. Save
FREE
ADX Color Script
Adrian Hernandez Castellanos
Script (drag and drop) that colors the background of the Average Directional Movement Index (ADX) indicator according to the buy or sell trend The Average Directional Movement Index (ADX) indicator is a technical indicator used to measure the strength of a trend. This script (drag and drop) colors the background of the ADX indicator according to the trend. The background color is determined by the script parameters. Parameters that can be modified: Period: The time period of the ADX indicator.
FREE
Stoch Color Script
Adrian Hernandez Castellanos
This script (drag-and-drop) colors the background of the Stochastic Oscillator based on the buying or selling trend. The background color is determined by the position of the indicator lines. Parameters that can be modified: %K Period: The %K period. %D Period: The %D period. Slowing: The slowing period. Price Field: Low/High or Close/Close MA Method: Simple, Exponential, Smoothed, Linear weighted. Color Positive Trend: The background color for an uptrend. Color Negative Trend: The background c
FREE
Stoch Color Indicator
Adrian Hernandez Castellanos
Stochastic Oscillator with Coloring This indicator colors the background according to the trend of the indicator. The indicator colors the background according to the value of the stochastic oscillator, whether it is an uptrend or a downtrend. The background color is determined by the parameters of the stochastic oscillator, painting only the last 400 bars (see notes). Parameters that you can modify: %K Period : The %K period %D Period: The %D period Slowing: The slowing period Price Field :
ADX Color Indicator
Adrian Hernandez Castellanos
Average Directional Movement Index (ADX) indicator that colors the background according to whether the trend is up or down. The ADXColor indicator is a technical indicator that measures the strength of a trend. The background color of the indicator is determined by its parameters and only paints the last 400 bars. The parameters you can modify are: Period: The time period of the ADX indicator. Trend Level: The minimum level that the ADX indicator must reach to be considered a bullish or bearis
AlarmLIne
Adrian Hernandez Castellanos
Trendline Breakout Alert Description: This indicator triggers an alarm (sound, alert or notification) when the price breaks a trendline, either above or below it. Parameters: Names of the trendlines. : Comma-separated names of the trendlines (Make sure your trendline name does not have spaces at the beginning and is exact). Value over/under the line (E.g.: 0.03% or 500 pips). : Value that defines a margin above/below the trendline before triggering the alarm, can be given in percentage or pips,
Filter:
No reviews
Reply to review
Version 1.9 2024.02.29
Leap year patch.