Graphic Alignment Context

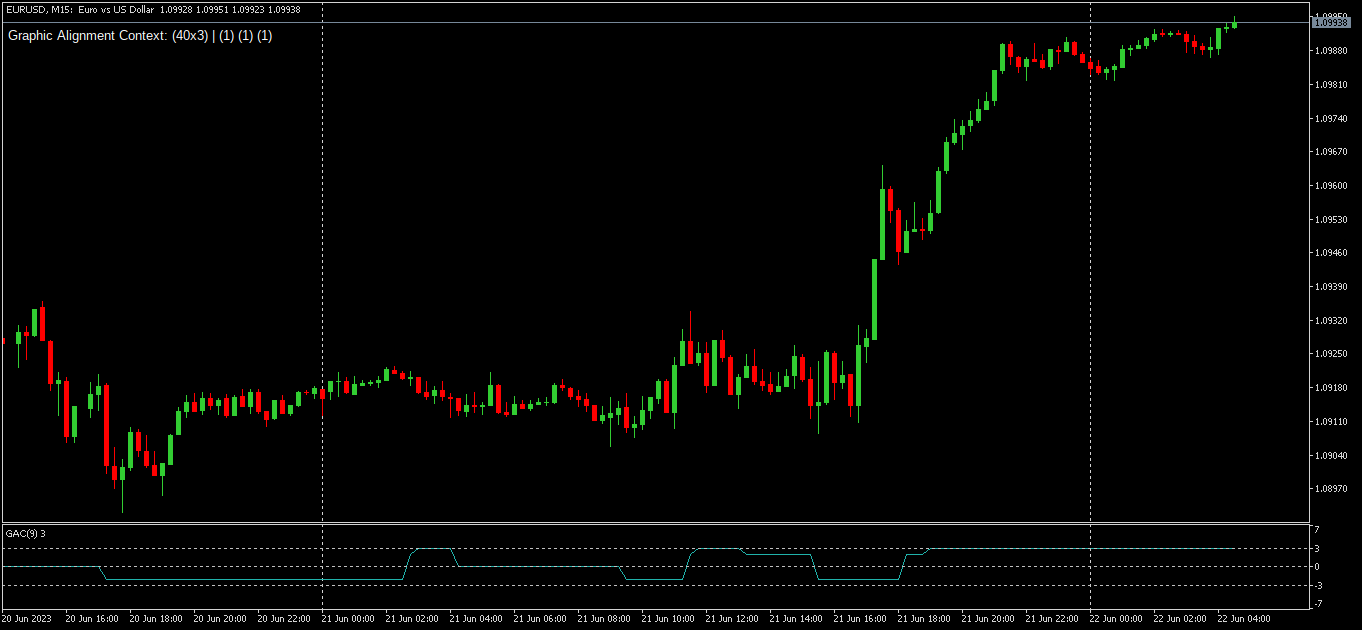
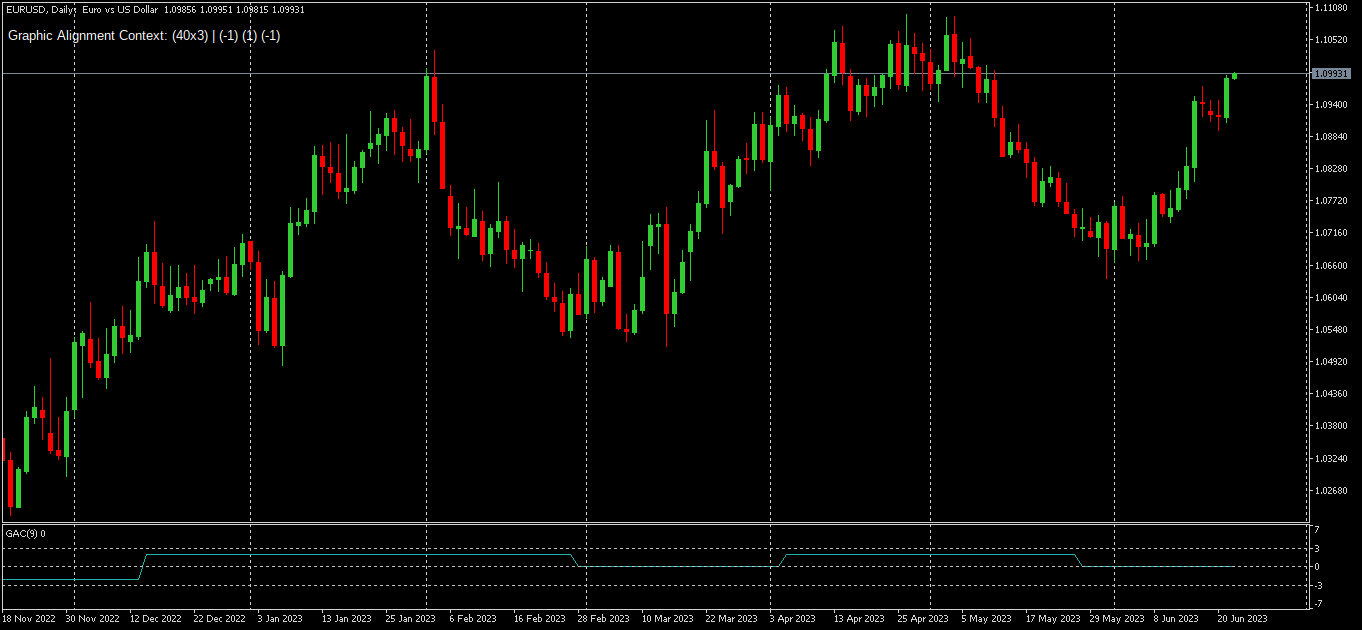
The Graphic Alignment Context (GAC) Technical Indicator measures the vertical difference of the simple average price of a financial instrument in the context of three different timeframes determined by a defined number of bars or candles (periods) to determine the strength of the buy or sell trend. sale. Ascending average prices indicate Buying strength (1), Descending average prices indicate Selling strength (-1) and any scenario different from the previous two conditions indicates Neutrality (0).

A scoring system is applied when evaluating trend alignment between the three different timeframes with greater weight for consecutive alignments between timeframes. Graphic Alignment Context (GAC) varies in the range of integers ± 3. Value ±3 indicates a strong buy or sell trend, value ±2 indicates a medium buy or sell trend, and value ±1 indicates a weak buy or sell trend. sale. The Zero Value indicates neutrality or that there is no graphic alignment considering the set of three different times.

Construction of the indicator and calculation assumptions:

  • Evaluate 3 different graphic times: Small (P), Medium (M) and Large (G);
  • Set the number of bars or candles (periods) for the Small timeframe, the operating timeframe;
  • Define the multiple to be applied to determine the Medium and Large timeframes;
  • Define the number of periods for the Simple Average of price evaluation;
  • Evaluate each timeframe for buying, selling or neutrality trends;
    • Chart is Buyer (+1);
    • Graph is Seller(-1);
    • Graph is Neutral (0);
  • By definition the graphic alignment will be measured by scores having more weight consecutive scores:
Setting P+M+G will result in the GAC Value:

  • Strong Seller Alignment (-3);
  • Average Salesperson Alignment (-2);
  • Weak Seller Alignment (-1);
  • Neutral Alignment (0);
  • Weak Buyer Alignment (1);
  • Average Buyer Alignment (2);
  • Strong Buyer Alignment (3);
The Indicator displays in a separate window the alignment levels on the model of an oscillator varying the score from -3 to 3.

Four output buffers are generated:

  • 0 = Trend for Time P;
  • 1 = Trend for Time M;
  • 2 = Trend for Time G;
  • 3 = GAC value;


Recommended products
DataFeeder
Joao Paulo Euko
Hi you, I need your help! Be my Patron, let's make it possible! https://www.patreon.com/joaopeuko https://github.com/Joaopeuko/Mql5-Python-Integration Esse Expert Advisor copia os dados("symbol,last,bid,ask") dos ativos que foram colocados na lista e só funciona enquanto o mercado esta aberto. Esse EA não é um link DDE ou RTD, as informações não são passadas em tempo real ao excel. O EA tem um delay de 30 segundos e o Excel tem um delay de 1 minuto. A vantagem desse EA é que ele dispensa o
FREE
SMC Structure Markup
Seyed Mohammad Hosseini Hejazi
4.67 (15)
Overview The Smart Money Structure Markup Indicator for MetaTrader 5 is a powerful tool designed to help traders identify key market structures based on popular Smart Money Concepts (SMC) strategies. This indicator detects micro-market structures, providing insights into price movements and potential trend changes. It highlights important elements such as valid Break of Structure (BOS), Change of Character (CHoCH), and Inducement (IDM), helping traders to make informed decisions. Key Features Ma
FREE
Smart Flow Bands
Mohamad Sami Taleb
How the Sell Signal Works 1. Bollinger Band condition The current candle must close at or above the Upper Bollinger Band . This signals potential overbought conditions. 2. OBV confirmation (On Balance Volume) OBV must be falling → OBV_now < OBV_prev . Stronger confirmation: OBV decreasing for 2–3 consecutive bars. This shows that buying pressure is weakening . 3. ATR filter (Average True Range) Current ATR must be below its moving average (e.g., ATR_now < ATR_SMA(14) * 1.2 ). Purpose: avoid ente
FREE
-- Simple but effective. Inversion Indicator -  What is it? A trend-following overlay indicator that combines SuperTrend logic with exponential curve technology. It detects trend direction, draws a dynamic channel on the chart, and sends real-time alerts when the trend reverses. How does it work? The indicator calculates an exponential baseline using ATR and a SuperTrend factor. When price closes above or below this baseline, a trend reversal is confirmed. A green arrow marks the start of a
FREE
TilsonT3
Jonathan Pereira
5 (1)
Tillson's T3 moving average was introduced to the world of technical analysis in the article ''A Better Moving Average'', published in the American magazine Technical Analysis of Stock Commodities. Developed by Tim Tillson, analysts and traders of futures markets soon became fascinated with this technique that smoothes the price series while decreasing the lag (lag) typical of trend-following systems.
FREE
Umagads Candle Timer MT5 Precision Timing for Disciplined Traders Umagads Candle Timer is a high-performance utility designed for MetaTrader 5 traders who demand absolute precision. In fast-moving markets, knowing exactly when a candle will close is the difference between a perfect entry and a missed opportunity. Whether you are scalping the M1 timeframe or swing trading on Daily charts, this tool puts the countdown exactly where you need it, ensuring you are always one step ahead of the next ma
FREE
Tired of SMC indicators that clutter your chart with random lines and overlapping boxes, obstructing your view of the price action? The  Ultimate SMC Assistant  is not just another structure mapping indicator; it is a Smart AI Trader Assistant designed specifically for Smart Money Concepts (SMC) traders and for successfully passing Prop Firm evaluations. The indicator constantly scans the market to detect the freshest and strongest reversal zones, providing you with a professional live dashboard
FREE
Market Momentum
Flavio Javier Jarabeck
4.43 (7)
The Market Momentum indicator is based on the Volume Zone Oscillator (VZO), presented by Waleed Aly Khalil in the 2009 edition of the International Federation of Technical Analysts journal, and presents a fresh view of this market valuable data that is oftenly misunderstood and neglected: VOLUME. With this new approach of "seeing" Volume data, traders can infer more properly market behavior and increase their odds in a winning trade. "The VZO is a leading volume oscillator; its basic usefulness
FREE
FT ADX Color Candles
FELIPE MISAEL MORAES KRUGER
5 (10)
Trading can be quite tiring when you need to look at several things at the same time. Format of candles, supports, resistances, schedules, news and indicators. This tool aims to facilitate the analysis of the ADX indicator. It colors the candles based on the levels of the indicator and the DI lines. The period, the limit of the indicator and the colors of the candles are customizable. You can also place a visual aid on the lower right side of the graph to view the values of ADX, DI + and DI-
FREE
Rejection Zones
Paulo Henrique Faquineli Garcia
Este poderoso indicador analisa o gráfico e mostra zonas de Rejeição de Preços! Isto é, locais onde o preço foi, mas não foi aceito pelo mercado! A visualização desta zona de Rejeição, facilita o entendimento do trader na tomada de decisões de onde operar e como operar! O indicador é composto por 4 linhas, sendo classificadas em 2 grupos: Linhas Vermelha e Amarela: Denotam os extremos onde o preço conseguiu chegar, mas não foi aceito! Linhas Laranja e Azul: A partir delas, denotam o Início da z
FREE
VWAP Cloud
Flavio Javier Jarabeck
4.1 (10)
Do you love VWAP? So you will love the VWAP Cloud . What is it? Is your very well known VWAP indicator plus 3-levels of Standard Deviation plotted on your chart and totally configurable by you. This way you can have real Price Support and Resistance levels. To read more about this just search the web for "VWAP Bands" "VWAP and Standard Deviation". SETTINGS VWAP Timeframe: Hourly, Daily, Weekly or Monthly. VWAP calculation Type. The classical calculation is Typical: (H+L+C)/3 Averaging Period to
FREE
Colored Adaptive Moving Average AMA
Flavio Javier Jarabeck
4.78 (9)
If you like to use traditional Moving Averages (like SMAs and EMAs) to provide your trades for dynamic levels of Support and Resistance, you will love the Adaptive Moving Average (AMA). Created in 1995 by Perry Kaufman and presented to the world in his book " Smarter   Trading :  Improving   Performance   in   Changing   Markets ", the Adaptive Moving Average (also known as KAMA - Kaufman Adaptive Moving Average) has the goal to be the perfect companion for following a trend without noise, but s
FREE
GDS Renko Entry Helper  is a Renko market analysis indicator for MetaTrader 5 that highlights important price interaction areas around support and resistance zones. The indicator helps traders identify where market structure, reactions, and directional movement may require additional attention before making trading decisions.   The indicator is designed to assist traders in analyzing price behavior on Renko charts by marking areas where price slows down, reacts, or changes direction near suppo
FREE
Reversal Oscillator — Advanced Momentum Shift Detector Reversal Oscillator is a free indicator designed to highlight price zones that are statistically outside their normal movement patterns, helping traders anticipate potential turning points before they occur. Unlike traditional oscillators that react mainly to overbought/oversold conditions, this indicator applies third derivative analysis (the "acceleration of the acceleration" of price) calculated using two independent methods within a n
FREE
VolumeBasedColorsBars
Henrique Magalhaes Lopes
VolumeBasedColorsBars — Free Powerful Volume Analysis for All Traders Unlock the hidden story behind every price bar! VolumeBasedColorsBars is a professional-grade, 100% FREE indicator that colorizes your chart candles based on real, adaptive volume analysis. Instantly spot surges in market activity, identify exhaustion, and catch the moves that matter. This indicator gives you:    • Dynamic color-coded bars for instant volume context    • Adaptive thresholds based on historical, session-awar
FREE
Simple Weis Wave
Jean Jacques Huve Ribeiro
3.67 (3)
One of the best tools for analyzing volume, Weis Wave was idelized by David Weis, to facilitate the reading of directional flow. For the VSA method disciples it is an evolution of the practices created by Richard Wycoff, facilitating a predictive reading of the market, always seeking an accumulation and distribution of the negotiated contracts. Cumulative wave volume  Range of wave ( removed) Average Wave volume Ref "Tim Ord lectures" ( removed)
FREE
VWAP Simple
Deibson Carvalho
4.24 (29)
The Volume Weighted Average Price is similar to a moving average, except volume is included to weight the average price over a period.    Volume-Weighted Average Price [VWAP] is a dynamic, weighted average designed to more accurately reflect  a security’s true average price over a given period . Mathematically, VWAP is the summation of money (i.e., Volume x Price) transacted divided by the total volume over any time horizon, typically from market open to market close. VWAP reflects the capitali
FREE
Simple MACD Expert
Abraao Moreira
3 (1)
Estratégia de negociação MACD O cálculo do MACD é executado uma vez a cada tick, e são considerados para fim de cálculo os três últimos resultados, para analisar o cruzamento da linha de zero, ou seja quando o último resultado for maior que 0 e o antepenúltimo não então há um cruzamento para cima e analogamente para baixo, quando um cruzamento é constatado o estado de uma variável de controle é alterado de "false" para "true", permitindo o abertura de uma posição caso a média de sinal também cru
FREE
Super Trend eu
Emin Ulucanli
4.83 (6)
SUPERTREND; It is a trend following indicator based on the SuperTrend ATR created by Olivier Seban. It can be used to detect changes in trend direction and locate stops. When the price falls below the indicator curve, it turns red and indicates a downtrend. Conversely, when the price moves above the curve, the indicator turns green, indicating an uptrend. Like other indicators, it works well on SuperTrend when used in conjunction with other indicators such as MACD, parabolik SAR, Bollinger Band
FREE
Color Trend
Bruno Goncalves Mascarenhas
Combining the best of Price Action , Directional Movement , and Divergence / Convergence analysis, the Candle Color Trend is the easy and reliable way to identify the direction of the trend. The indicator automatically paints the candles according to the premise that the upward trend is defined by prices that form a series of ascending tops and bottoms. On the other hand, the downward trend is defined by prices that form a series of descending tops and bottoms. Color Trend is certainly one of
FREE
MTF High Low indicator displays key price levels across multiple timeframes directly on your chart,  so you always know where the market has been and what levels matter most. The   NY Session High/Low Levels  automatically plot the highest and lowest prices of the New York trading session on your chart. It provides clear horizontal lines for the   Today (TDY) ,   Yesterday (YTD) ,   Week (7D) , and   Month (30D)   sessions, with customizable display options.           Inspired by MTF.HighLow.
FREE
Daily HiLo
Nicanor Jr Cagape Layco
DailyHiLo Indicator Master the daily range like a pro. This indicator automatically plots the previous day’s high and low levels —a core element in the (Beat The Market Maker) trading approach—directly on your chart. These levels act as natural boundaries for intraday price action, helping traders identify potential reversal zones, breakout points, and liquidity targets. Key Features Accurate plotting of yesterday’s high and low for any symbol and timeframe. Works seamlessly with BTMM-inspired
FREE
Quantitative Candlesticks Qstick
Flavio Javier Jarabeck
4 (2)
Qstick is a way to objectively quantify candlestick analysis and improve the interpretation of candlestick patterns. Qstick was developed by Tushar Chande and published in his book " The New Technical Trader - Boost Your Profit by Plugging Into the Latest Indicators (1994) ". Qstick is built based on a moving average of the difference between the Open and Close prices. The basis of the idea is that the Opening and Closing prices are the heart of candlestick analysis. We strongly recommend the re
FREE
Inside Day Narrow Range 4
Luiz Augusto De Medeiros Pellegrini
IDNR4 — Indicator Description (English) The IDNR4 (Inside Day Narrow Range 4) is a volatility-compression pattern that identifies potential breakout conditions. It combines two concepts: NR4 (Narrow Range 4) The current bar has the smallest high–low range compared to the previous three bars. Inside Bar (ID) The current bar’s high and low are fully contained within the range of the previous bar. Signal Logic • When the bar is NR4 only , it is highlighted as a normal contraction pattern. • Wh
FREE
VFI Quantum
Nikita Berdnikov
5 (1)
Introducing VFI (Volume Flow Indicator) – a trading indicator that analyzes the relationship between volume and price movement to identify key trading opportunities. The indicator displays the strength and direction of volume flow, providing clear signals about potential entry and exit points. Signals are formed based on zero line crossovers, crossovers between the VFI line and its exponential moving average (EMA), and when the indicator exits overbought and oversold zones. Attention! This stra
FREE
Norion Smart Levels is a professional support and resistance indicator developed to help traders identify the most relevant price levels where the market historically reacts. The indicator analyzes price structure and market behavior to automatically plot key support and resistance levels, eliminating subjectivity and reducing chart noise. The result is a clean, objective, and easy-to-read visualization that adapts to different market conditions. Key Features: Automatic detection of support and
FREE
NEXA Breakout Velocity NEXA Breakout Velocity is an automated trading system based on channel breakout logic combined with momentum (ROC), volume filtering, and ATR-based risk management. The system is designed to detect volatility expansion phases where price breaks beyond recent ranges with increasing speed and participation. All signals are calculated on closed bars only. Only one position per symbol is maintained at a time. Strategy Overview The system combines the following components: Chan
FREE
ENGLISH DESCRIPTION (MQL5 Standard Optimized) Product Name: Ghostforge Bloom Requiem AI (MT5) [Subtitle: TEMA Velocity | Volatility Bloom | Cryo-Stasis Safety] Introduction Ghostforge Bloom Requiem AI is an elite trend-following system designed to capture high-velocity market moves while filtering out the noise of indecision. It operates on a sophisticated "Life Cycle" logic: It waits for the trend to be forged ( The Ghostforge ), confirms the market is expanding ( The Bloom ), and enters precis
Supertrend 3 lines
Samart Palugmontol
5 (2)
update v.1.22 - Fixed indicator not working properly. - Updated emergency stop function. - Added several input parameters: - Magic Number - Working Interval - Trade Direction Selection - Supertrend Confirmation Requirement ***Since the setting is more flexible, the outcome may vary. For the recommended settings, please see the screenshot.*** +++++++++++++++++++++++ Just wanted to share a trading strategy that's been working for me. It's built around the Supertrend  indicators, specifi
FREE
Golden Delta Library — Free MT5 Tools Market Description Short Description Golden Delta Library is a free MT5 toolkit for traders who want cleaner chart structure, Renko-based context, risk planning, and practical execution panels. The collection includes Renko indicators, SuperTrend / ADX Renko variants, XAUUSD helper panels, and RiskLab TradeDesk tools. Each product is designed to be lightweight, visual, and useful on live charts without promising automated profits or replacing trader judgme
FREE
Buyers of this product also purchase
Neuro Poseidon MT5
Daria Rezueva
4.95 (19)
Neuro Poseidon is a new indicator by Daria Rezueva. It combines precise trading signals with adaptive TP/SL levels - creating best possible trades as a result! Message me and get  Neuro Poseidon Assistant  as a gift to automize your trading process! What makes it stand out? 1. Proven profitability on all assets and timeframes 2. Only confirmed BUY and SELL signals present on the chart 3. Adaptive TP & SL levels generated by the software for each trade 4. Easy to understand - suitable for al
PrimeScalping
Temirlan Kdyrkhan
PrimeScalping is a powerful trading companion designed to generate high-probability entry signals with dynamic TP/SL/DP levels based on volatility. Built-in performance tracking shows win/loss stats, PP1/PP2 hits, and success rates — all updated live. Key Features: Buy/Sell signals with adaptive volatility bands Real-time TP/SL/DP levels based on ATR Built-in MA Filter with optional ATR/StdDev volatility Performance stats panel (Success, Profit/Loss, PP1/PP2) Alerts via popup, sound, push, or e
SuperScalp Pro
Van Minh Nguyen
4.65 (26)
SuperScalp Pro – Advanced Multi-Filter Scalping Indicator System SuperScalp Pro is an advanced scalping indicator that combines the classic Supertrend with multiple intelligent confirmation filters to help identify trading opportunities. It works efficiently across multiple timeframes from M1 to H4, with optimized performance on XAUUSD, BTCUSD, and major Forex pairs. The indicator provides clear Buy and Sell signals, along with automatically calculated entry price, stop loss, and take profit lev
Gold Entry Sniper
Tahir Mehmood
5 (12)
Gold Entry Sniper – Professional Multi-Timeframe ATR Dashboard for Gold Scalping & Swing Trading Gold Entry Sniper is a cutting-edge MetaTrader 5 indicator designed to give traders precise buy/sell signals for XAUUSD and other symbols, powered by ATR Trailing Stop logic and a multi-timeframe analysis dashboard . Built for both scalpers and swing traders, it combines real-time market direction , dynamic stop levels , and professional visual dashboards to help you identify high-probability gold en
Divergence Bomber
Ihor Otkydach
4.9 (90)
Each buyer of this indicator also receives the following for free: The custom utility "Bomber Utility", which automatically manages every trade, sets Stop Loss and Take Profit levels, and closes trades according to the rules of this strategy Set files for configuring the indicator for various assets Set files for configuring Bomber Utility in the following modes: "Minimum Risk", "Balanced Risk", and "Wait-and-See Strategy" A step-by-step video manual to help you quickly install, configure, and s
Entry In The Zone and SMC Multi Timeframe is a real-time 2-in-1 market analysis tool that combines market structure analysis and a No Repaint BUY / SELL signal system into a single indicator, built on Smart Money Concepts (SMC) — a widely adopted framework used by professional traders to understand market structure. This indicator helps you see the market more clearly, make decisions based on structure rather than guesswork, and focus on high-probability zones where price is more likely to react
Price will increase by $20 every 10 buyers to maintain premium value. After purchase, contact via   MQL5 inbox   to receive your buyer kit and bonus. Let's be honest first. No indicator will make you profitable on its own. If someone tells you otherwise, they're selling you a dream. Every indicator that shows perfect buy/sell arrows can be made to look flawless — just zoom into the right window of history and screenshot the winners. We won't do that. SMC Intraday Formula is a tool. It reads the
SmartScalping
Temirlan Kdyrkhan
SmartScalping is a powerful trading companion designed to generate high-probability entry signals with dynamic TP/SL/DP levels based on volatility. Built-in performance tracking shows win/loss stats, PP1/PP2 hits, and success rates — all updated live. Key Features: Buy/Sell signals with adaptive volatility bands Real-time TP/SL/DP levels based on ATR Built-in MA Filter with optional ATR/StdDev volatility Performance stats panel (Success, Profit/Loss, PP1/PP2) Alerts via popup, sound, push, or e
ScalpPoint
Temirlan Kdyrkhan
ScalpPoint is a powerful trading companion designed to generate high-probability entry signals with dynamic TP/SL/DP levels based on volatility. Built-in performance tracking shows win/loss stats, PP1/PP2 hits, and success rates — all updated live. Key Features: Buy/Sell signals with adaptive volatility bands Real-time TP/SL/DP levels based on ATR Built-in MA Filter with optional ATR/StdDev volatility Performance stats panel (Success, Profit/Loss, PP1/PP2) Alerts via popup, sound, push, or emai
SignalTech MT5 is an unique fully rule based trading system for EURUSD, USDCHF, USDJPY, AUDUSD, NZDUSD, EURJPY, AUDJPY, NZDJPY, CADJPY.  All the winning trades with chart setups are published on the comments page. 2026-05 4107 Pips (Until 05-29 NY Closed) 2026-04 2243 Pips 2026-03 2165 Pips 2026-02 2937 Pips 2026-01 2624 Pips 2025-12 1174 Pips It can generate signals with Buy/Sell Arrows and Pop-Up/Sound Alerts. Each signal has clear Entry and Stop Loss levels, which should be automatically flag
TrendProMaster
Temirlan Kdyrkhan
MasterTrend Indicator for MT5 A powerful trend-following and signal-evaluation tool MasterTrend   is a custom MT5 indicator that combines Moving Averages and ATR-based risk/reward logic to generate clear buy/sell signals. It visualizes dynamic SL/TP levels, evaluates past trade outcomes, and displays win/loss statistics in a clean on-chart panel. Key features include: Buy/Sell signals based on MA crossovers ATR-based SL/TP1/TP2/TP3 levels with visual lines and labels Signal outcome tracking wit
This product was updated for the 2026 market and optimized for the latest MT5 builds . PRICE UPDATE NOTICE: Smart Trend Trading System is currently available for $99. The price will increase to $199 after the next 30 purchases. SPECIAL OFFER:  After purchasing Smart Trend Trading System, send me a private message to claim the Smart Universal EA for FREE and turn your Smart Trend signals into automated trades. Smart Trend Trading System is a complete non-repainting, non-redrawing, and non-laggi
Power Candles MT5
Daniel Stein
5 (8)
Power Candles V3 - Self-Optimizing Strength Indicator Power Candles V3 turns currency and instrument strength into an actionable trade plan on every chart it is attached to. Instead of just coloring candles, it runs a live auto-optimization in the background and hands you the best Stop Loss, Take Profit and signal threshold for the symbol in front of you. One click adopts it for live trading - entry, Stop Loss and Take Profit rays appear on the chart at the exact prices, and alerts fire with dir
MasterTrend
Temirlan Kdyrkhan
MasterTrend Indicator for MT5 A powerful trend-following and signal-evaluation tool MasterTrend   is a custom MT5 indicator that combines Moving Averages and ATR-based risk/reward logic to generate clear buy/sell signals. It visualizes dynamic SL/TP levels, evaluates past trade outcomes, and displays win/loss statistics in a clean on-chart panel. Key features include: Buy/Sell signals based on MA crossovers ATR-based SL/TP1/TP2/TP3 levels with visual lines and labels Signal outcome tracking wit
Quantum TrendPulse
Bogdan Ion Puscasu
5 (25)
Introducing Quantum TrendPulse , the ultimate trading tool that combines the power of SuperTrend , RSI , and Stochastic into one comprehensive indicator to maximize your trading potential. Designed for traders who seek precision and efficiency, this indicator helps you identify market trends, momentum shifts, and optimal entry and exit points with confidence. Key Features: SuperTrend Integration: Easily follow the prevailing market trend and ride the wave of profitability. RSI Precision: Detect
Introducing   Quantum Breakout PRO , the groundbreaking MQL5 Indicator that's transforming the way you trade Breakout Zones! Developed by a team of experienced traders with trading experience of over 13 years,   Quantum Breakout PRO   is designed to propel your trading journey to new heights with its innovative and dynamic breakout zone strategy. Quantum Breakout Indicator will give you signal arrows on breakout zones with 5 profit target zones and stop loss suggestion based on the breakout b
Azimuth Pro
Ottaviano De Cicco
5 (7)
Azimuth Pro V2: Synthetic Fractal Structure and Confirmed Entries for MT5 Overview Azimuth Pro is a multi-level swing structure indicator by Merkava Labs . Four nested swing layers, swing-anchored VWAP, ABC pattern detection, three-timeframe structural filtering, and closed-bar confirmed entries — one chart, one workflow from micro-swings to macro-cycles. This is not a blind signal product. It is a structure-first workflow for traders who care about location, context, and timing. V2 Launch Offe
Trend Catcher ind mt5
Ramil Minniakhmetov
5 (4)
TREND CATCHER INDICATOR Trend Catcher Indicator analyzes market price movements, using a combination of the author’s proprietary and customized adaptive trend-analysis indicators.  It identifies the true market direction by filtering out short-term noise and focusing on underlying momentum strength, volatility expansion, and price structure behavior.  It also uses a combination of smoothing and trend-filtering customized indicators such as moving averages, RSI, and volatility filters.   Real ope
GoldenX Entry MT5
Kareem Abbas
5 (9)
Price will increase by $20 every 10 buyers to maintain premium value. After purchase, contact via   MQL5 inbox   to receive your buyer kit and bonus. You have probably tested dozens of indicators before. But we are not here to be “just another signals indicator.” Behind GoldenX Entry is intensive research & development focused on building sophisticated algorithms designed to adapt to the real behavior of every instrument — not generic signals recycled everywhere else. From advanced Auto Optim
Reversion King Indicator
Eugen-alexandru Zibileanu
5 (4)
A new King in town - Indicator + Order management indications(tp1+tp2+tp3) + Optional Telegram Signal sender   INCLUDED (FREE) ( FULL TRADING  and SIGNAL SYSTEM ) Our best EA for Gold: Gold Slayer  This indicator includes an advanced Strategy, a trading system with customisable order management and a mean reversion system that combines envelope extensions, backed by multiple intelligent confirmation filters like RSI to catch high probability reversal entries with BUY and SELL signals . You will
FX Trend MT5 NG
Daniel Stein
5 (6)
FX Trend NG: The Next Generation Multi-Market Trend Intelligence Overview FX Trend NG is a professional multi-timeframe trend and market monitoring tool designed to give you a complete structural overview of the market in seconds. Instead of switching between dozens of charts, you instantly see which symbols are trending, where momentum is fading, and where strong alignment exists across timeframes. This tool is part of the Stein Investments ecosystem - 18+ tools plus Max, your 1-on-1 AI tradi
Gann Made Easy   is a professional and easy to use Forex trading system which is based on the best principles of trading using the theory of W.D. Gann. The indicator provides accurate BUY and SELL signals including Stop Loss and Take Profit levels. You can trade even on the go using PUSH notifications. PLEASE CONTACT ME AFTER PURCHASE TO GET TRADING  INSTRUCTIONS   AND GREAT EXTRA INDICATORS   FOR FREE! Probably you already   heard   about the Gann trading methods before. Usually the Gann theory
This product was   updated   for the   2026 market   and   optimized   for the   latest MT5 builds . PRICE UPDATEe NOTICE: Smart Price Action Concepts   is currently available for $200. The price will   increase to $299   after the next   30 purchases. SPECIAL OFFER:  After purchasing , send me a private message to claim FREE Bonus + Gift. First of all Its worth emphasizing here that this Trading Tool is Non Repainting , Non Redrawing and Non Lagging Indicator , Which makes it ideal for profe
RelicusRoad Pro MT5
Relicus LLC
4.96 (24)
RelicusRoad Pro: Quantitative Market Operating System 70% OFF LIFETIME ACCESS (LIMITED TIME) - JOIN 2,000+ TRADERS Why do most traders fail even with "perfect" indicators? Because they trade Single Concepts in a vacuum. A signal without context is a gamble. To win consistently, you need CONFLUENCE . RelicusRoad Pro is not a simple arrow indicator. It is a complete Quantitative Market Ecosystem . It maps the "Fair Value Road" price travels on, distinguishing between random noise and true structur
ARIPoint
Temirlan Kdyrkhan
1 (1)
ARIPoint is a powerful trading companion designed to generate high-probability entry signals with dynamic TP/SL/DP levels based on volatility. Built-in performance tracking shows win/loss stats, PP1/PP2 hits, and success rates all updated live. Key Features: Buy/Sell signals with adaptive volatility bands Real-time TP/SL/DP levels based on ATR Built-in MA Filter with optional ATR/StdDev volatility Performance stats panel (Success, Profit/Loss, PP1/PP2) Alerts via popup, sound, push, or email Cu
Meta Trend PRO MT5
Roman Podpora
5 (1)
META TREND PRO       — is a trend-following tool that takes the guesswork out of trading and shows where the market has already made its decision. The indicator identifies key points where trends, trends, and structures change, and highlights areas where the price returns for major players to take positions. You don't just see the movement—you understand the logic behind it. All signals are recorded after the candle closes, are not redrawn, and are saved on the chart, allowing you to confidently
M30/H1/H4 Swing Version Available Want to catch the big moves that M5/M15 can't reach? Gold Signal Swing Pro (M30/H1/H4) is now available. Target $20-$80+ per trade. https://www.mql5.com/en/market/product/177643 KURAMA GOLD SIGNAL PRO (MT5) — 7-Layer Filter XAUUSD Complete Trading System No repaint. No redraw. No lag. Every signal stays fixed once confirmed. Buyer bonus: Anyone who purchases the buy-out license gets AI Zone Radar ($59 value) + PDF m
Atomic Analyst MT5
Issam Kassas
4.26 (35)
This product was updated for the 2026 market and optimized for the latest MT5 builds. PRICE UPDATE NOTICE: Atomic Analyst is currently available for $99. The price will increase to $199 after the next 30 purchases . SPECIAL OFFER:  After purchasing Atomic Analyst, send me a private message to claim the Smart Universal EA for FREE and turn your Atomic Analyst signals into automated trades. Atomic Analyst is a non-repainting, non-redrawing, and non-lagging price action trading indicator designed
FX Power MT5 NG
Daniel Stein
5 (32)
FX Power: Analyze Currency Strength for Smarter Trading Decisions Overview FX Power is your go-to tool for understanding the real strength of currencies and Gold in any market condition. By identifying strong currencies to buy and weak ones to sell, FX Power simplifies trading decisions and uncovers high-probability opportunities. Whether you’re looking to follow trends or anticipate reversals using extreme delta values, this tool adapts seamlessly to your trading style. Don’t just trade—trade
Market Structure Order Block Dashboard MT5 is an MT5 indicator designed for traders who want to read market structure and the main price reaction zones directly on the chart. It combines BOS, ChoCH, Order Blocks, Fair Value Gaps (FVG), Liquidity, Kill Zones, Volume Profile, and a compact dashboard for quick analysis. This indicator targets traders who use market structure, ICT and Smart Money concepts as a decision framework. It can help spot trend continuations, possible reversals, price imbala
More from author
Available Range Bands
Ricardo Alexandre Laurentino
The Available Range Bands Technical Indicator draws two lines on the chart indicating the maximum limits (bands) expected for buying and selling for the current period (candle). These limits can be accessed by buffers 0 and 1 respectively. In addition, it displays in the lower right corner the current average values of the real volatility, the last price, the predicted range of movement available for buying (% and points) and the predicted range of movement available for selling (% and points)
FREE
HTC Panel Indicator
Ricardo Alexandre Laurentino
HTC Panel Indicator is an operational summary dashboard for use in conjunction with trading EA. It provides a concise summary of the current year's trades, open positions and profit history. The summary can be filtered by the current chart asset, by the ID (magic number) of an EA or by all trades performed in the year. The panel must be inserted into the chart as an indicator, making it possible to add it to a chart that already has a trading EA.
FREE
Filter:
No reviews
Reply to review