YouTubeにあるマーケットチュートリアルビデオをご覧ください
ロボットや指標を購入する
仮想ホスティングで
EAを実行
EAを実行
ロボットや指標を購入前にテストする
マーケットで収入を得る
販売のためにプロダクトをプレゼンテーションする方法
MetaTrader 5のためのエキスパートアドバイザーとインディケータ - 48

Trading Viewで見かけたTMA - RSI DivergenceをMT5でも使えるように作成しました。 TMA RSI Divergence(TMA-RSIダイバージェンス)とは、 TMA( Triple Moving Average :三重加重移動平均) と RSI(Relative Strength Index:相対力指数) を組み合わせたテクニカル指標で、 価格とRSIの動きが逆行する「ダイバージェンス(逆行現象)」を検出する際に使われる手法です 。 通常RSI単体で見るのではなく、 RSIをTMAで平滑化(スムージング) し、 TMAライン自体をRSIの代わりに使う ことで、相場の転換点やトレンドの弱まりを、より明確に、そして長期的な視点で捉えることを目指します。 仕組みと特徴 RSIの平滑化 : 通常のRSIのノイズ(小さな値動き)を、TMAで平均化することで、トレンドの方向性や強い転換シグナルを際立たせます。 TMAをRSIの代わりに : TMA自体をオシレーター(買われすぎ・売られすぎを示す指標)として使い、価格とのダイバージェンスを見ることもあります。 5
FREE

The Spots Indicator can be used for Entering and Exiting your trades based on the common candlestick patterns such as: engulfing, hanging man, doji etc. It is designed to publish desktop and mobile notification every time a signal is triggered. However, it is worth noting that this indicator is recommended to be used with other indicator for confirming the entries. It is best to use it with the Investment Castle Trend Lines indicator and the Supply and Demand indicator .
FREE

The key to success is always good optimisation.
The system has a number of variables and in this case its simplicity is the key to its success. The system looks for the different "Gaps" as market entry failures and then debugs them through a stochastic analysis, i.e. the analysis of two moving averages to see if the price is overvalued or undervalued, and once this is done, the expert advisor will decide whether to perform an action or refrain from performing it. It is a very simple but powerf
FREE

Live trade TEST ICT EA VS ICT manual: https://www.youtube.com/live/uKa9YD40Kn4
Introducing: Gold ICT EA 1.0 – Precision-Engineered for XAUUSD Scalping Built with purpose. Tuned for gold. Trusted by precision. Gold ICT EA 1.0 is an advanced automated trading system specially crafted for XAUUSD . Designed to operate on the M5 chart, it’s a no-nonsense solution for gold traders who value capital protection and consistent growth.
No unnecessary complications – just stability, discipline, and prec
FREE

2016年(05月)のICTのプライベートメンターシップコース(YouTubeで共有)からインスピレーションを受け、当社の革新的なツールは、トレーダーが市場を精密に航行することを可能にします。 60、40、20日の期間をマークすることで、市場の重要な動きを特定し、ICTの教えから得られた知識を活用します。 このインジケーターの真の特徴は、将来の市場動向に関する貴重な洞察を提供する前方キャスティング機能であり、これは入念な歴史データの分析に基づいています。 この先行的なアプローチにより、トレーダーは情報を元にした決定を行うための洞察力を備え、今日のダイナミックなトレーディング環境で明確な優位性を提供します。 さらに、当社のインジケーターはカスタマイズオプションを提供し、トレーダーがそれを自分の好みや特定のトレーディング戦略に合わせて調整できるようにします。 このレベルの適応性により、トレーダーは自信を持って市場のトレンドを予測し、ICTの教えを活用して先を見据え、利益を生む機会を活かすことができます。 当社のインジケーターで予測とカスタマイズの力を体験し、トレーディングスキルを向上させ、
FREE

Auu MA UAS – Virtual Risk Control EA Version 1.00 Auu MA UAS is a clean and disciplined Expert Advisor for MetaTrader 5, built around a moving-average–based reverse signal logic combined with a virtual risk control system . This EA focuses on controlled exposure, simplicity, and broker-independent trade management , without using server-side Stop Loss or Take Profit. Strategy Overview Trades based on reverse signals derived from moving average relationships Opens positions against short-term dir
FREE

Market Cycle and Trading Sessions Indicator
Introducing our Market Cycle and Trading Sessions Indicator, a tool designed to provide you with a comprehensive view of the financial market like never before. Observe the market's pulse with our exclusive indicator. Gain a deep understanding of market phases, from accumulation to distribution, to make informed, strategic decisions with a high probability.
What makes our indicator?
1. Date Range for Calculations: Customize the start and end dates
FREE

Real Trend Zigzag PRO shows the real trend of a market, u nlike the default Zigzag indicator. It calculates the trend in real time and shows green lines for upwards trends, red lines for downward trends and blue lines for no trends. Regarding the old slogan "the trend is your friend" it helps you to decide if should open a buy or sell position. The PRO version is a multi timeframe zigzag (MTF). Means, it shows the trend of the current timeframe as well as the trend of a higher or lower time.

SATOSHI AI Artificial Intelligence Crypto Trading EA- USER GUIDE (Derived from GEMINI 2 Pro & Latest GPT ) Introduction SATOSHI AI is a MetaTrader 5 expert advisor powered by advanced artificial intelligence, specifically designed for cryptocurrency trading. The system operates exclusively on single-position scalping strategy without using any high-risk methods like martingale or grid trading. Core Features 1. AI-Powered Analysis
Feature Description
AI Models Advanced natural language AI models

Necessary for traders: tools and indicators Waves automatically calculate indicators, channel trend trading Perfect trend-wave automatic calculation channel calculation , MT4 Perfect trend-wave automatic calculation channel calculation , MT5 Local Trading copying Easy And Fast Copy , MT4 Easy And Fast Copy , MT5 Local Trading copying For DEMO Easy And Fast Copy , MT4 DEMO Easy And Fast Copy , MT5 DEMO "Cooperative QQ:556024" "Cooperation wechat:556024" "Cooperative email:556024@qq.com" Strong
FREE

General Description Volatility Breakout Master is an Expert Advisor designed to capture market volatility through a “breakout + reversal” strategy.
The system detects when the price breaks the high or low of the last X candles within a configurable time window, enters in the breakout direction, and—if the market reverses—opens a new position in the opposite direction following a dynamic model.
Once a cycle is completed (when one direction prevails), all trades are closed, and the system automat
FREE
The Ultimate Signal Builder Basic combines the features of other 3 expert advisors, providing all their trading signals in one single place: 1. the Price Action Builder Basic ; 2. the Bollinger Bands Builder Basic ; 3. the Chart Patterns Builder Basic .
The Ultimate Signal Builder Basic expert advisor shares the same characteristics as the 3 underlying experts: usage of stop loss orders, maximum 1 managed open trade, automatic trade closure and configurable validation mechanism. While being ess
FREE

TrianglePatternGannEA Pro v7.0 Standalone - Complete Analysis & Optimization Guide Overview TrianglePatternGannEA Pro v7.0 is an advanced all-in-one Expert Advisor that combines Gann Triangle pattern detection with an intelligent anti-extreme filtering system. This EA operates completely standalone without requiring external indicators, making it efficient and reliable for automated trading. Core Features Analysis 1. Pattern Detection System Gann Triangle Recognition The EA identifies classic G
FREE

Norion Daily Key Levels is a professional indicator designed to display the most relevant price reference levels of the trading day in a clear and objective way. The indicator automatically plots essential daily levels such as: Previous day close Current day open Daily high Daily low In addition, the indicator allows the inclusion of other custom daily reference levels, making it adaptable to different trading styles and market strategies. These levels are widely used by professional traders as
FREE

About CrashBoom Stones is an expert advisor utility that gives you a signal to catch CrashBoom drops or spikes. It shows you a Red Sell arrow on Crash to sell, and a blue arrow on Boom to buy. It also gives you an alert when an arrow is shown. Note:
The utility does not show signals for the historical data in live mode, use the strategy tester to test this utility. The arrows shown are independent to the trends pane. The trends pane is more accurate when H1 and M30 agree.
Recommendations
W
FREE

An “inside bar” pattern is a two-bar price action trading strategy in which the inside bar is smaller and within the high to low range of the prior bar, i.e. the high is lower than the previous bar’s high, and the low is higher than the previous bar’s low. Its relative position can be at the top, the middle or the bottom of the prior bar.
The prior bar, the bar before the inside bar, is often referred to as the “mother bar”. You will sometimes see an inside bar referred to as an “ib” and its m
FREE

M & W Pattern Pro is an advanced scanner for M and W patters , it uses extra filters to ensure scanned patterns are profitable.
The indicator can be used with all symbols and time frames.
The indicator is a non repaint indicator with accurate statistics calculations.
To use , simply scan the most profitable pair using the statistics dashboard accuracy , then enter trades on signal arrow and exit at the TP and SL levels.
STATISTICS : Accuracy 1 : This is the percentage of the times price hits TP

Infinite Stallion EA - The real deal January 2026 results: 7 wins, 5 losses
Infinite Stallion EA is a very high quality, Prop firm optimized, buy-only XAUUSD Expert Advisor engineered around one of the most reliable price action concepts in trading: Break & Retest . Designed exclusively for XAUUSD on the H1 timeframe , Infinite Stallion does not chase price. It waits. It confirms. Then it strikes with precision. As a Prop firm ready EA, you can choose any percentage you want to risk per trad
FREE

概要 RainbowVolumeProfile は、指定したバー数の範囲における 価格帯別のティック出来高(Volume Profile) を表示するインジケーターです。
主要な出来高集中帯(POC)を上位5つまで自動検出し、 カラフルなヒストグラム として描画します。
計算は非常に軽量で、リアルタイム更新にも対応しています。 主な特徴 上位5つのPOC(Point of Control)を自動検出・色分け表示 チャート右端に水平ヒストグラムとして描画 時間足を指定して分析(M1〜H4など自由) 新しいバーの出現に応じて自動更新 描画オブジェクトは自動管理(再描画・削除処理付き) 軽量なアルゴリズム構成でスムーズに動作 ️ パラメータ設定 パラメータ名 説明 デフォルト値 CaluculationBars 計算対象とするバー数 120 PriceResolution 価格分割数(ヒストグラム解像度) 25 VolumeProfileWidth プロファイル描画幅(ピクセル) 180 VolumeColor 通常のボリュームカラー WhiteSmoke VolumeColo
FREE

HEDGING ACCOUNTS ONLY!!! DO NOT USE DEFAULT SETTINGS!! Multifarious is a multiple strategy trading robot. With 9 indicators, 82 possible trading strategies your possibilities are endless. You can use the following indicators individually or use them together to. Bollinger Bands Moving averages Stochastics RSI Momentum indicator Fibonacci Levels MACD indicator ADX Indicator Fractals Indicator The EA also has a highly configurable money management section to ensure low risk trading. Extra Featu
FREE

A Renko Tick chart based on continuously adjusting percentage.
Live Renko bricks formed by tick data
Adjustable brick width expert for indicator attached Scalp with a Renko, get weird.
The settings can and will break the script if you turn them up too high. Turning off outline mode will not look as nice, but can potentially allow for a larger number of bricks.
FREE

Embrace the Power With Ultimate Trend Trader Indicator. Facing the reality of individual traders, we are far from harnessing the capabilities of AI and high-frequency trading algorithms that dominate today's markets. Without access to massive data centers or infrastructure to compete on microseconds, the battle seems skewed. Yet, the true advantage lies not in technological arms but in leveraging human intellect to outsmart the competition. The Ultimate Trend Trader Indicator embodies this appr
FREE

ETH Bot – H1チャート用ETHUSDトレーディングロボット ETH Botは、H1時間枠でのイーサリアム(ETHUSD)専用に設計されたインテリジェントで適応性のあるトレーディングロボットです。高度なテクニカル分析原理に完全に基づいて構築されたETH Botは、ボリューム中心の方法論を通じて精密な実行を優先します — これはイーサリアムの動的なトレーディング環境をナビゲートする上で不可欠な要素です。 ETH Botのアルゴリズム・フレームワークの基盤は、イーサリアムと主要アルトコイン市場の両方のリアルタイムボリューム分析に集中しています。複数の時間枠でのボリューム変動を継続的に監視し、それらの相互依存性を検証することにより、ETH Botは包括的な暗号通貨エコシステム内でのモメンタムの強さと方向性バイアスを評価します。 ETH Botは、トレーディングプラットフォームからのライブ市場データストリームを処理して、センチメントの移行と相関の破綻を特定し、情報に基づいたトレーディング決定を実行できるようにします。戦略的トレンドキャプチャまたはボリュームで示される反転を狙うかどうか
UPD: https://t.me/mql5_neuroExt актуальная версия и обсуждение. -作成されたトレーニングベースを成功させるために、一時的に使用するためのアドバイザーを無料で提供します。 -トレーニングの進行に伴い、トレーニングベースが配置されます。 -トレーニングには約20エポックが必要です。 なぜならExpert Advisorはリソースを大量に消費し、市場はそれを処理できません。Market値を持つTypeOfWorkパラメーターが導入されました。 他の希望する値に切り替える必要があります! 共同学習のために公開されました! 入力データのセットの深さは、設定で指定された時間枠の50バーです。 ThresholdOUTは効果がありません。 場合によっては、速度は非常に大きな値にのみ影響します。 トレーニングモードでは、SLとTPが等しい最小ロットで1つの注文のみを開きます。スケジュールは統一されている必要があります。このモードでは、利益自体は重要ではありません。 距離は、MaxOrders> 1でのみ機能します。 MaxOrde
FREE

The RMI Scalper EA is a fully automated Expert Advisor that trades pullbacks from the major trend using RMI and limited averaging. The EA trades using market orders and uses averaging to safely turn otherwise negative trades positive. This EA works best on USDJPY, EURUSD, GBPUSD, USDCAD, USDCHF, AUDJPY, EURCAD, EURGBP and EURJPY using the M30 timeframe and has the option to trade multiple pairs but only one pair at any one time to increase trade frequency without increasing draw down.
Please not
FREE
This is a powerful, session-aware breakout indicator designed for serious traders who thrive on volatility and structure. Engineered for precision, it identifies high-probability breakout zones during the London and New York trading sessions—where the market moves with intent. Key Features: Session Range Detection
Automatically detects and highlights the key price range of London and New York sessions. Breakout Confirmation
Identifies breakout candles after the session range, with clear bullis
FREE

Мой самый популярный и востребованный продукт здесь https://www.mql5.com/ru/market/product/41605?source=Site+Market+Product+From+Author#
Индикатор стрелочник идеален для торговли в боковике, очень точно показывает моменты перекупленности и перепроданности инструмента, с дополнительными фильтрами также можно использовать для торговли по тренду. На экран выводятся стрелки сигнализирующие о развороте тренда, направление стрелки показывает дальнейшее направление торговли, также имеется звуковое о
FREE

The Trend Line EA adviser trades based on the Trend Line PRO indicator signals in automatic mode. An additional set of functions allows the Trend Line PRO strategy to become break-even with any instrument in MT5: Gold, Forex, Indices, Stocks, Crypto. Big sale 50% OFF! Price $199. Regular price $399 All our signals are now available on myfxbook: click here Unique set files and all recommendations are provided free of charge. All future updates of the adviser are included in the price. After

When executing an order, whether through the Metatrader ticket on a computer or the Metatrader app on a mobile device, either manual or pending,
Easy Trade will automatically set the take profit and stop loss levels, as well as a limit order with its respective take profit and stop loss levels. It follows the trading strategy for market open (US30, US100, US500), but it can be applied to any market asset.
FREE

It is a panel that seems common, however, far beyond those of additional buttons for closing multiple orders, it is essential for those using the offline charts generators for Renko, Range, Ticks, and similars because in the Metatrader 5 does not allow the manual operation of orders in these charts that are generated synthetically. The "TRADE PANEL" makes it very easy to handle both orders executed to the market and the placing of pending orders, offering practically the same immediate action
FREE

Pure Veil に会う This is a limited pricing phase. Get it at 80 while under 5 sales. Once that cap is reached, new price will be 105. Currently sold: 7 copies.
MQl5チャンネル : https://www.mql5.com/en/channels/robotsofluaiy 指示: https://www.mql5.com/en/blogs/post/763451 Reach out for the correct backtest settings — I’ll send you everything needed.
シンプルさ、安定性、厳格な管理を重視するトレーダーのために設計された Pure Veil は、プロップファームのルールとプライベートアカウント管理を処理するために特別に構築された1つのチャート取引アシスタントです。 Send a message to receive a demo-account tria

Trend Pullback RCI EURUSD H1 推奨 概要
EMAのトレンド方向を基準にしながら、RCIで「押し目/戻り」を待ってから入るプルバック型のEAです。 突っ込み買い・突っ込み売りをできるだけ回避します。
本EAはポジション同時保有を1としています。 ナンピン、マーチン、グリッド無し。 ※ヘッジング、ネッティング口座対応。 RCIが過熱を示すと決済が入ります。 ロットは 口座残高ベースのリスク%で損切の位置から計算され、入力した最小ロットLot_Minと最大ロットLot_Maxの範囲内で自動調整します。
SL、TP、BE(ブレイクイーブン)はボラティリティに合わせて可変します。 1トレンドでのエントリー回数を制限できます。 ※ ご注意(ネッティング口座)
MT5のネッティング口座では、 同一銘柄あたりの保有は常に1ポジション となります。
そのため 同一銘柄を複数EAで同時稼働すると、ポジション/SL・TP/BE等が共有され、EA同士が干渉 します(MagicNumberでは分離不可)。
同一銘柄での他EAとの並走は非推奨 です。複数EAを同時に運用する場合は、
"Candlesticks MTF 5" is an informational indicator that displays "Japanese Candlesticks" . The indicator analyzes and determines the opening and closing times of candles from higher time frames.
An algorithm has been developed for the "Candlesticks MTF 5" indicator that corrects the discrepancy between the opening and closing times of candles from higher time frames. For example, if the opening time of a candle on a weekly time frame is the 1st of the month, and on the smaller time frame this
FREE

I think you all know Donchian Channels. so I am not going to write about it.
With this indicator I tried to create Donchian Trend Ribbon by using Donchian Channels.
How it works ?
- it calculates main trend direction by using the length that is user-defined. so you can change it as you wish
- then it calculates trend direction for each 9 lower lengths. if you set the length = 20 then the lengths are 19, 18,...11
- and it checks if the trend directions that came from lower lengths is same
FREE

Quick Trade is a simple but needful utility for MT5 that allows to set SL, TP and entry price for a trade in a couple of seconds, allowing also shaping right position size based on risk wanted. It provide shortcuts to save more time and of course, you can also put values typing with keyboard or drag lines at your desired value! Shortcut Action CTRL + Click Set SL Shift + Click
Set TP z + Click Set Price A simple utility that you will start to love if you do manual trading. Stop calculating risk
FREE

イントロダクション Break Asian Range は、よく知られている「アジアの高値・安値」戦略を自動化するトレーディングボットです。EURUSD、GBPJPYなどのボラティリティの高い通貨ペアにおいて、アジアセッションのブレイクアウトを検出・取引するように設計されています。 カスタマイズ可能なテクニカル確認と、高度なリスク管理(SL、TP、トレーリングストップ、可変リスク、再エントリーなど)を組み合わせて、保守的なスタイルにも攻撃的なスタイルにも対応可能です。 複数のタイムフレームに対応しており、ドージ、ハンマー、包み足などの主要なローソク足パターンを認識してエントリーを検証します(トレーダーの設定次第)。
主な特徴
よく知られた反復的な市場行動に基づいた戦略。 柔軟性:確認、取引時間、リスクなどをカスタマイズ可能。 あらゆる通貨ペアや資産に対応。 ユーザーの取引スタイルに応じて、保守的または積極的に運用可能。 再エントリー、動的リスク管理、トレードフィルタリングをサポート。 2025年4月に複数のペアで良好な結果を得てテスト済み(下記の画像をご参照ください)。
コメント
FREE

The Investment Castle Chances indicator will show signals on the chart for entering a buy or sell trade. There are 2 types of signals for each direction as follows: Buy / Sell (Orange colored candlesticks) Strong Buy (Green colored candlesticks) / Strong Sell (Red colored candlesticks) You may place a buy trade once you see the Buy arrow or vise versa, or you might prefer to wait for a further confirmation “Strong Buy” / “Strong Sell”. This indicator works best with the high time frames H1,
FREE

The Gold Guardian (TGG) – Professional XAUUSD Breakout & Swing EA (M5) The Gold Guardian is a professional breakout and swing-capture Expert Advisor built specifically for XAUUSD (Gold) on the M5 timeframe .
It acts as a disciplined guardian of your capital — cutting false breakouts quickly with small stop-losses, while chasing extended gold trends with precision trailing stops. Unlike risky bots that rely on martingale, grids, or averaging, The Gold Guardian is built on risk discipline : keep l

GoldFusion Pro – Multi-Strategy Automated Trading EA GoldFusion Pro is an algorithmic trading system that combines multiple strategies with a dual risk management framework. It is designed for automated trading on various Forex pairs and timeframes. CORE FEATURES • Dual Trading Modes – single trade and multi-trade scaling system • Flexible Take Profit / Stop Loss – dynamic ATR-based or fixed-point configuration • Comprehensive Risk Management – daily loss limits, position sizing control, and

Bohemia Gold Outside Inside Bar MT5 is an automated trading system for MetaTrader 5 based on pure price action logic combined with trend and momentum filters . The EA is designed to trade trend continuation setups after short consolidations or periods of increased market volatility. Recommendation EA works well in a trend For Gold (XAUUSD) M30 timeframe Choose RiskPercent (0.1% step) or FixedLot MM setting Keep default settings (not necesarry SET file) Safety Features EA always use SL and TP
FREE
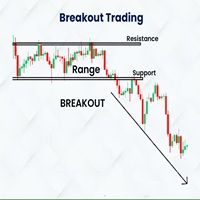
Indicador Basado en la estrategia de ruptura del rango de londres de Amaury Benedetti.
Este indicador dibuja automaticamente el rango, el maximo y minimo y sus correspondientes lineas de stoploss, entrada y takeprofit.
SE RECOMIENDA USAR EN M1 EN EL US30 (DE ACUERDO A LA ESTRATEGIA)
Los valores se pueden modificar de acuerdo a la necesidad del usuario, tambien se tienen mas configuraciones para dibujar cualquier rango en diversos horarios y con diferentes configuraciones de sl, tp, etc
Detal
FREE

The Pulse は、蓄積期間をリアルタイムで示す指標である。 簡単に言えば、蓄積とは、「スマートマネー」が市場で強力な動きを起こす前に静かに資産を集めることです。 チャート上では、価格が1つの範囲で「立ち往生」しているように見えます。 これは蓄積段階です-誰かが大きな動きの準備をしています。 そして、市場が"凍結"しているように見えるが、同時に緊張が感じられるときに、これらの瞬間に気づくことを学ぶなら、適切なタイミングで適切な場
蓄積期間を決定することは、適切な瞬間を待つことができることを意味します。 インジケータ The Pulse は蓄積期間を示し、価格は蓄積において望むように動くことができるが、ほとんどの場合、動きは横方向である。 The Pulse Blog. The blog: Why every trader should have The Pulse indicator as an additional tool for trading. Version mt4
累積期間はさまざまな方法で使用できます:
蓄積期間中は、市場の外に滞在し、蓄積されたエネルギーを解

Light Venus - Adaptive Grid Profit Maximizer *Users are encouraged to share their set files that have performed well in the comments section. Why Choose Light Venus? Master the Grid Strategy : Harness the power of grid trading, where orders are strategically placed at calculated intervals. This method allows you to profit from market fluctuations without being glued to your screen. Profit with Precision : Define your profit goals, and let Light Venus handle the rest. Its intelligent system clo
FREE

LZ Candle Timer displays the remaining time before the current bar closes and a new bar forms. It helps you manage entries and exits around candle closes. The indicator uses server time, updates every second, and is optimized for smooth display with minimal CPU use.
Feature highlights
- Selectable location: place the timer in any of the four chart corners (Upper Left, Upper Right, Lower Left, Lower Right). Offsets and padding are configurable. - Alarm colour: when fewer than X seconds remain
FREE

Ultimate Candle Countdown – もう二度とローソク足のクローズを見逃さない! Ultimate Candle Countdown でトレード精度を次のレベルへ。あらゆる時間足と銘柄に対応した、シンプルで軽量かつ強力なローソク足カウントダウンタイマーです。
M1でスキャルピング、H1でスイングトレード、あるいは日足/週足のクローズを監視していても、このツールがあれば次のローソク足が始まるまでの残り時間を正確に把握できます。推測はもう不要 – 常に鋭く、常に一歩先へ。 主な機能 すべての時間足に対応 – 1分足から月足まで、信頼性と精度を両立。 視覚的なカウントダウン – hh:mm:ss 形式で残り時間を表示、毎秒スムーズに更新。 カラーアラート – 通常・警告・クリティカルの色をカスタマイズ可能。残り時間が少ないことを瞬時に認識。 オプションの進行率表示 – ローソク足の進行度を一目で確認。 プログレスバー – カウントダウンの下に表示されるシンプルなバー。 時間足ラベル – 監視しているチャートの時間足を常に明示。 スマート配置 – 最新のローソ
FREE

Pivot Points Classic – L’indicatore essenziale per ogni trader tecnico Questo indicatore disegna automaticamente i livelli di Pivot Point più utilizzati dai trader professionisti, con supporto completo a 4 metodi di calcolo: Metodi supportati :
• Traditional
• Fibonacci
• Woodie
• Camarilla Caratteristiche principali :
Calcolo su timeframe superiore (multi-timeframe)
Visualizzazione chiara dei livelli P, R1, R2, R3, S1, S2, S3
Etichette dinamiche con nome e valore del livello
Colori per
FREE

This expert advisor opens trades based on a combination of signals from the Envelopes, DeMarker, MACD, and RSI indicators. It also includes a time filter, restricting trades to between 1:00 AM and 11:00 PM broker time. A trade will be closed if an opposite entry signal is generated, the 32-period ATR crosses above 0.0015, a fixed Stop Loss of 2000 pips is hit, or a fixed Take Profit of 8000 pips is hit. The input parameters include a fixed stop loss of 2000 pips, a fixed take profit of 8000 pip

Moving Averages Bot with ATR – A Comprehensive Trading Tool .
Very RARE POWERFUL AND UNIQUE moving averages BOT that incorporates ATR with Stop Loss, Take Profit Multiplier. Multiple Time Frames and a lot more.
This Bot is an impressive automated trading system that combines the simplicity of moving averages with the dynamic adaptability of the Average True Range (ATR).
Designed to enhance trading strategies by offering a balanced mix of trend-following techniques and risk manag

The Gold Scalper EA is a precision-engineered expert advisor designed to dominate the XAUUSD (Gold) market through smart support and resistance-based scalping. Built with a clean, simplistic and minimalistic trading logic without any overcomplicated jargon that most EAs try to advertise, this Gold scalping robot executes high-probability breakout trades with surgical accuracy using simple basic support and resistance trading while keeping drawdowns minimal and protecting your capital at all time

ORIONIX MicroTrendwe — スマートスキャル(設定次第で長期保有も)
MT5用 マイクロトレンドEA 。現行TFの EMA(9/21) クロス + M5のEMA(50) フィルター で順張りのみ。
基本は スキャルピング 、ただし TP/SL ・ BE ・ トレーリング で 長めの保有 も可能。 リスク/保護: TP_pts (利確)、 SL_pts (損切)、 BreakEven_pts (建値引上げ)、 Trailing_pts (BE後の追従)、 SpreadMaxPoints 、 UmTradePorBarra 、 UmTradePorVez 。 シグナル: EMA_Fast 、 EMA_Slow 、 EMA_M5_Filter ; ロット/マジック: Lote 、 Magic 。 スタイル: 短TP=スキャル;TP拡大 + BE + トレーリング= 長期 。 推奨: M1/M5 (EURUSD、GBPUSD、XAUUSD、指数)+ 低スプレッド/ECN 。 グリッド/マーチンなし。 注意: 過去の成績は将来を保証しません。まず デモ で。 한국어
FREE

Linear Regression Channel (MTF) Indicator The Linear Regression Channel MTF is an advanced technical indicator that uses statistical analysis to plot a linear regression channel on the price chart, with the capability to display data from a different time frame (Multi Time Frame) for enhanced trend accuracy and analysis. Key Features of the Indicator: Main Line (Linear Regression Line):
Represents the overall price trend over the selected period, allowing traders to easily observe the general s
FREE
https://www.mql5.com/en/users/gedeegi/seller
The "RSI+ with 123 Fractals" logo is designed to provide a clear and professional visual representation of a complex technical indicator, focused on precise market analysis and reliable patterns. Each element in the design is crafted to reflect the philosophy and strengths of the indicator within the trading world. Design Elements: "RSI+" Text in Bold and White:
The main "RSI+" text is chosen to be the focal point, with a bold and clear font. The us
FREE

オープニングレンジEAは 、よく知られた市場原理に基づいて構築されています。指数は市場が開いた直後に強いモメンタムを示すことが多く、その最初の動きがセッションの残りの流れを決定づける可能性があります。このEAは、オープニングレンジを特定し、ブレイクアウト注文を自動的に出すことで、そのモメンタムを捉えます。その後、セッションが終了するまで取引を管理し、その日の方向性の動きから利益を得ることを目指します。 この製品は完全に無料です。初期設定ファイルは コメント欄から入手できます 。 戦略をさらに拡張またはカスタマイズしたい場合は、有料製品のいずれかを購入していれば、DM 経由でソース コードをリクエストできます。 他のEAもぜひご覧ください 取引仕様
対応機器 :US30、USTEC、DE40に最適。EA 設定: デフォルト設定はUS30とUSTECに最適化されています。VPS : 中断のないパフォーマンスのために推奨 主な特徴 カスタム時間ウィンドウ: 希望する開始時間と終了時間を選択して、開始範囲を定義します。 自動ブレイクアウト注文: EA は定義された範囲の上下に保留
FREE

SummarySignalLine is an intelligent multi-indicator for MetaTrader 5 that combines signals from five classical technical indicators into a single smoothed signal line. The indicator visualizes overall market sentiment in a simple, intuitive format with color coding. Key Features Composite Analysis — combines MA, RSI, Bollinger Bands, Stochastic, and ATR Smoothed Signal — reduces market noise with configurable smoothing Visual Clarity — color gradient from green (bullish) to red (bearish)
FREE

これは標準的な指標に取り組んでいるMetaTrader 5のための万能自動エキスパートアドバイザーです。 UniversalEA
コンストラクタEAには多数の関数が用意されています。 ポジションを開くために20のシグナルのうちの1つを選択し、MetaTraderパッケージに含まれる標準インディケータのシグナルを選別するために20のうち5つのフィルターを選択することができます。 さらに、指標のパラメータを調整したり、時間枠を選択したり、各信号の信号バーを指定したりできます。 注意!新しいユニバーサルトレーディングアドバイザーの Exp - カスタム指標に取り組んでいる xCustomEA : MetaTrader 5の ための Exp The xCustomEA MetaTrader 4の ための Exp The xCustomEA Description on English 自動取引アドバイザーを購入したい場合は、 TickSniperを チェックして ください 。
EAには以下の機能があります。
カウンタートレンド平均 トレンドの方向への追加の開口部 トレーリングストッ

ウォールストリート・スカベンジャー:スマートトレーディング自動化 ウォールストリート・スカベンジャーでトレーディングをレベルアップ。これは、精度と制御で市場機会を捉えるように専門的に作成されたエキスパートアドバイザー(EA)です。このEAは、一貫した結果を提供するために、洗練された実績のある戦略を活用し、あらゆるレベルのトレーダー向けにシームレスな自動化と堅牢なリスク管理を融合させています。 主な機能: インテリジェントな取引エントリー:独自のシステムを使用して最適な取引タイミングを特定し、エントリーが市場の流れと一致するようにします。 カスタマイズ可能な取引時間:オープンポジションはいつでも決済できるようにしながら、好みの市場セッションに新しい取引を制限し、最大限の柔軟性を実現します。 組み込みのリスク制御:すべての取引は自動ストップロスと利益確定機能で保護され、資本を安全に保ちます。 適応可能なサイズ設定:固定取引サイズを選択するか、EAがアカウントに合わせて動的に調整できるようにし、リスクを簡単に最適化します。 市場状況フィルター:不利な状況を回避し、取引コストを低く抑え、効率
FREE

Trading Utility with Integrated AI
Demo In Comments. A comprehensive trading assistant that puts control at your fingertips. The tool streamlines order execution and position management while offering intelligent support through multiple AI providers. TRADE - Execute long and short positions with hedge capabilities. Configure stop-loss (SL) and take-profit (TP) levels with precision. Place pending orders and manage volume settings. The interface supports both MARKET and HEDGE modes with adjusta

Shadow Mark Scanner Your Edge in Candle Range Theory – Automate Advanced Price Action Setups Introduction - Make sure you know those strategies and backtested them before using this scanner - Use at your own risk Shadow Mark Scanner is a cutting-edge MetaTrader 5 indicator that automatically identifies advanced price action setups using candle range theory . This powerful scanner detects high-probability patterns like Previous Candle Range (PCR) breakouts and Engulfing Sweeping Candles (also kn
FREE
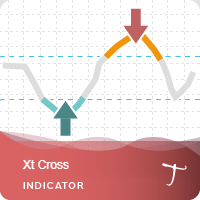
Xt Cross is a port of a famous TS /MT indicator.
When the oscillator is above the overbought band (red lines) and crosses down the signal (dotted line), it is usually a good SELL signal. Similarly, when the oscillator crosses above the signal when below the Oversold band (green lines), it is a good BUY signal.
Xt Cross Advantages The indicator is suitable for scalping and intraday trading. It is possible to evaluate the effectiveness of the indicator on history. The indicator does not
FREE

Adiciona marca d'água com nome do ativo em negociação. Pode ser ajustado definindo tamanho da fonte e coloração do texto. Testado com vários ativos do mercado B3 e Forex Adione ao gráfico e configure de acordo com a necessidade. Caso tenha problemas sinta-se a-vontade para nos avisar e providenciaremos a correção logo que possível. ______________________________
FREE

Session Box Indicator for MetaTrader 5
Description: The SessionBox indicator is designed to visually represent the trading sessions on a chart, specifically the Asian, European, and American sessions. This indicator draws customizable rectangles around each session, allowing traders to easily identify different trading periods. It also includes labels to denote each session, enhancing clarity.
Users only need to input the session start and end hours in their server time. Please note, the Asia
FREE

Volumized Breaker Blocks MTF Supreme Volumized Breaker Blocks MTF Supreme is a powerful and user-friendly multi-timeframe (MTF) indicator that automatically detects and visualizes Order Blocks (OB) and Breaker Blocks (BB) on your chart. This advanced tool is designed for both beginners and professional traders who want a clean, fast, and insightful way to identify key market levels with volume context. Key Features Multi-Timeframe Support : Instantly plot OB/BB zones from up to three customizab
FREE

The "Close All Order Tools" tool is designed to solve common problems faced by Forex traders when managing profitable orders—especially in highly volatile market conditions or when dealing with multiple open trades simultaneously. Problems This Tool Solves: Unable to close orders in time : “Just when it was rising nicely, the price suddenly dropped—I couldn’t close it in time, and the profit vanished.” Closing orders one-by-one is time-consuming : “With multiple orders open, closing each one ind
FREE

Setup Tabajara was created by a Brazilian trader known as "The OGRO of Wall Street" .
The idea of this setup is to indicate to the trader the current trend of prices and the type of operation should be looked for in the graph.
Operation
It does this through the relation of the closing price position and the of 20 periods, by painting the candles in 4 possible colors : Green -> Price rising in upward trend (Search entry points for PURCHASE) Black -> Price correcting in Bullish Trend (Sear
FREE

Overview The MT5 Local Trade Copier synchronizes trades from a Master account to one or more Slave accounts. It copies positions and pending orders with duplicate protection, symbol mapping, and adjustable lot sizes. Time and day filters can be applied for flexible operation Features Copy positions and pending orders from Master to Slave accounts. Select which trades to copy: all trades, positions only, orders only, buy-only, or sell-only. Adjust lot sizes using fixed lots, risk percentage of ac
FREE

Highly configurable Macd indicator.
Features: Highly customizable alert functions (at levels, crosses, direction changes via email, push, sound, popup) Multi timeframe ability Color customization (at levels, crosses, direction changes) Linear interpolation and histogram mode options Works on strategy tester in multi timeframe mode (at weekend without ticks also) Adjustable Levels Parameters:
Macd Timeframe: You can set the lower/higher timeframes for Macd. Macd Bar Shift: you can set the o
FREE

If you love this indicator, please leave a positive rating and comment, it will be a source of motivation to help me create more products <3 How to use SuperTrend? When the price crosses above the supertrend line it signals a buy signal and when the price crosses below the supertrend line it signals a sell signal. The supertrend indicator which acts as a dynamic level of support or resistance and helps traders make informed decisions about entry and exit points. When prices are above s upertre
FREE
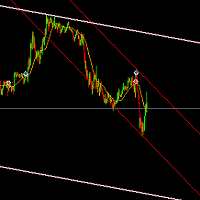
The indicator based on the trading channel in the MT5 trading terminal is a tool that automatically builds a channel formed by the peaks of the price chart in an upward and downward sequence. This indicator helps traders identify support and resistance levels, market trends, as well as set stop-loss and take-profit levels for optimal trade management. This version of the indicator is equipped with a basic trading logic, which can be disabled in the settings and used as an indicator for your tra
FREE

Trade Receiver Free is a free tool to copy trades/signals from multiple MT4/MT5 accounts. The provider account must use copier EA to send the signal. This version can be used on MT5 accounts only. For MT4 accounts, you must use Trade Receiver Free . Reference: - For MT4 receiver, please download Trade Receiver Free .
- For MT5 receiver, please download Trade Receiver Free MT5 .
- For cTrader receiver, please download Trade Receiver Free cTrader .
- If you only need copy from MT4 account to u
FREE
This EA trades using the Stochastic Indicator. It offers many trading scenarios and flexible position management settings, plus many useful features like customizable trading sessions, a martingale and inverse martingale mode. [ Installation Guide | Update Guide | Troubleshooting | FAQ | All Products ] Easy to use and supervise It implements three different entry strategies Customizable break-even, SL, TP and trailing-stop Works for ECN/Non-ECN brokers Works for 2-3-4-5 digit symbols Trading can
FREE
MetaTraderプラットフォームのためのアプリのストアであるMetaTraderアプリストアで自動売買ロボットを購入する方法をご覧ください。
MQL5.community支払いシステムでは、PayPalや銀行カードおよび人気の支払いシステムを通してトランザクションをすることができます。ご満足いただけるように購入前に自動売買ロボットをテストすることを強くお勧めします。
取引の機会を逃しています。
- 無料取引アプリ
- 8千を超えるシグナルをコピー
- 金融ニュースで金融マーケットを探索
新規登録
ログイン