Handelsroboter und Indikatoren für den MetaTrader 5 - 48

True Days ist ein Tool, das speziell für Händler entwickelt wurde, die die Intraday-Volatilität in Preisdiagrammen erfassen möchten. True Day macht es dem Händler leichter, den Handel in der toten Zone zu vermeiden - ein Zeitraum, in dem die Märkte als tot oder nicht volatil gelten. Der Händler kann sich darauf konzentrieren, Gelegenheiten nur in Zeiten tiefgreifender Marktbewegungen zu finden. Standardmäßig gibt Ihnen der Indikator einen echten Tag an, der um 02:00 bis 19:00 Uhr GMT+2 beginnt.
FREE

M & W Pattern Pro ist ein fortschrittlicher Scanner für M- und W-Muster, er verwendet zusätzliche Filter, um sicherzustellen, dass die gescannten Muster profitabel sind.
Der Indikator kann mit allen Symbolen und Zeitrahmen verwendet werden.
Der Indikator ist ein nicht wiederholter Indikator mit genauen statistischen Berechnungen.
Zur Verwendung scannen Sie einfach die profitabelsten Paare mit der Genauigkeit des Statistik-Dashboards, dann geben Sie Trades auf den Signalpfeil ein und steigen Sie

SnapBack EA - Mean Reversion Trading System Version 1.10 SnapBack EA ist ein robuster Mean-Reversion Expert Advisor für MetaTrader 5, der beliebte technische Indikatoren nutzt, um potenzielle Rückzugsmöglichkeiten in schwankenden Märkten zu erkennen. Strategie-Übersicht Eröffnet Trades basierend auf extremen Kursniveaus in Kombination mit einer Momentum-Bestätigung Kauf bei überverkauften Bedingungen; Verkauf bei überkauften Setups Strenge Regel, immer nur eine Position zu handeln (kein Hedging,
FREE
Haben Sie genug von dem langsamen, klobigen und uninformativen Standard-Order-Panel in MetaTrader 5? Diskretionärer Handel erfordert Geschwindigkeit, Präzision und vor allem klare Informationen. Sich durch mehrere Menüs zu klicken, Stopps einzeln zu ziehen und keine konsolidierte Übersicht über Ihr Risiko zu haben, sind Hindernisse, die Sie Zeit und vor allem Geld kosten. Professioneller Handel erfordert professionelle Werkzeuge. Trader Panel Alpha X Pro ist die endgültige Lösung. Es ist nicht n
FREE
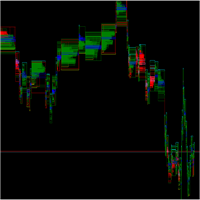
SpreadFlow ist ein Indikator für MetaTrader, der ein Diagramm erstellt, das vollständig auf dem Verhalten des Handelsflusses basiert und nicht nur auf Zeit- oder Volumenkerzen.
Er organisiert die Informationen von jedem Tick in vier Hauptdimensionen: Spread - überwacht die Differenz zwischen BID und ASK im Zeitverlauf und zeigt Momente der Verengung und Ausweitung des Spreads an, die mit größerer oder geringerer Liquidität einhergehen. Trades at the same price - identifiziert, wenn aufeinanderfo
FREE

Ein einfaches Dienstprogramm zum Kopieren von Handelsvolumina von einem MT5- oder MT4-Konto auf ein anderes MT5-Konto. Sie können Positionen zwischen Netting- und Hedging-Konten in beliebiger Kombination kopieren. Standardmäßig werden Positionen kopiert, die von allen übereinstimmenden Symbolen mit demselben Volumen eröffnet wurden. Wenn die Symbolnamen unterschiedlich sind oder das Volumen der kopierten Positionen unterschiedlich sein soll oder nicht alle Positionen kopiert werden sollen, dann
FREE

ETH Bot – ETHUSD Trading-Roboter für H1-Chart ETH Bot ist ein intelligenter und anpassungsfähiger Trading-Roboter, der speziell für Ethereum (ETHUSD) im H1-Zeitrahmen entwickelt wurde. Vollständig auf Prinzipien der ausgeklügelten technischen Analyse aufgebaut, priorisiert ETH Bot präzise Ausführung durch volumenorientierte Methodologien — ein wesentliches Element für die Navigation in Ethereums dynamischer Trading-Umgebung. Das Fundament von ETH Bots algorithmischem Framework konzentriert sich
Wie bereits angedeutet, können Sie mit diesem Indikator von einem Symbol oder Zeitrahmen zu einem anderen in einem einzigen Chart wechseln. Vergessen Sie also das Öffnen einer Vielzahl von Charts auf Ihrem Bildschirm! Der Indikator ist nicht für ICT- oder SMC-Händler gedacht, aber wenn Sie zu dieser Art von Händlern gehören, können Sie ihn trotzdem verwenden. Stellen Sie sich vor, Sie haben eine Strategie mit verschiedenen Indikatoren und Einstellungen. In einem einzigen Chart können Sie die Ein
FREE

Automatischer Fibonacci-Retracement-Linien-Indikator. Dieser Indikator nimmt den aktuellen Trend und zeichnet, wenn möglich, Fibonacci-Retracement-Linien vom Swing bis zum aktuellen Preis. Die verwendeten Fibonacci-Ebenen sind: 0%, 23,6%, 38,2%, 50%, 61,8%, 76,4%, 100%. Dieser Indikator funktioniert für alle Charts und alle Zeitrahmen. Die Fibonacci-Levels werden auch in Puffern aufgezeichnet und können von anderen Trading-Bots verwendet werden. Jegliche Kommentare, Bedenken oder zusätzliche Fun
FREE

Verbessern Sie Ihre Price-Action-Strategie: Inside-Bar-Breakouts auf Tastendruck
Dieser Indikator erkennt die Innenseite von Bars in verschiedenen Bereichen und macht es Preis-Aktions-Händlern sehr einfach, Inside-Bar-Breakouts zu erkennen und darauf zu reagieren. [ Installationsanleitung | Update-Anleitung | Fehlerbehebung | FAQ | Alle Produkte ] Einfach zu bedienen und zu verstehen Anpassbare Farbauswahlen Der Indikator implementiert visuelle/mail/push/sound Warnungen Der Indikator wird nicht
FREE
Volatility Monitor – Echtzeit-Indikator für Volatilitätsspitzen Übersicht Der Volatility Monitor ist ein leichter und professioneller MT5-Indikator, der plötzliche Kursbewegungen verfolgt und Trader in Echtzeit warnt. Ob Forex, Gold, JPY-Paare oder Kryptowährungen – dieses Tool liefert klare Signale zur Marktvolatilität mithilfe eines ATR-basierten Automatikmodus oder manuell festgelegter Pip-Schwellen. Durch Markierungen direkt im Chart und progressive Alarme hilft der Indikator, schnell auf Na
FREE

Beschreibung des Produkts Clean, Smart Sessions ist ein professioneller Indikator für Handelssitzungen, der Händlern eine klare, genaue und übersichtliche Darstellung der aktiven Marktsitzungen direkt auf dem Chart bietet. Der Indikator erkennt und zeigt die aktive Handelssitzung (Asien, London und New York) dynamisch und in Echtzeit an, indem er eine saubere Sitzungsbox zeichnet, die kontinuierlich aktualisiert wird, um die wahren Höchst- und Tiefstwerte der Sitzung wiederzugeben. Wenn sich Si
FREE

Verändern Sie Ihr Metatrader 5-Handelserlebnis mit der Smart Trade Control für MT5, einer anspruchsvollen und dennoch intuitiven Handelsverwaltungslösung, die für Händler aller Niveaus entwickelt wurde. Von der präzisen Positionsgrößenbestimmung bis hin zum fortschrittlichen Basket-Management rationalisiert dieses Tool Ihre Handelsabläufe und verbessert gleichzeitig die Risikokontrolle. Kontaktieren Sie mich für eine kostenlose 7-Tage-Testversion. Kernfunktionen: Intelligenter Positionskalkulato
FREE

Ein vollautomatischer Experte
Entwickelt und erstellt zu 100 % durch künstliche Intelligenz Dieser Roboter wird von der kostenlosen ChatGPT KI erstellt. Auch, um die AI-Tool (ein großer Assistent in MetaTrader) zu verwenden, können Sie dieses Produkt: https://www.mql5.com/en/market/product/136348 Alle Trades haben Gewinn- und Verlustlimits
Attribute: Verwendbar:
in Währungspaar: EURUSD
im Zeitrahmen: M30
auf Kontotyp: Beliebig
bei verschiedenen Brokern
bei Prop-Unternehmen
mit Mindestkapital
FREE

Basierend auf dem Extreme Trend Indicator von Trading View, konvertiert für MT5. Die Nutzung des Indikators ist kostenlos, aber wenn Sie den Quellcode möchten, können Sie diesen erwerben, indem Sie mir eine Nachricht schicken.
Extreme Trend ist ein Indikator, der erkennt, wenn sich ein neuer Trend bildet und ein Handelssignal erzeugt. Dieser Indikator kann für viele Märkte verwendet werden, Forex, Gold usw. Wenn Sie Fragen haben oder einen EA mit diesem Indikator erstellen möchten, können Sie mi
FREE
Der Trend Line EA-Advisor handelt auf der Grundlage der Signale des Trend Line PRO-Indikators im automatischen Modus. Ein zusätzlicher Satz von Funktionen ermöglicht es der Trend Line PRO Strategie, mit jedem Instrument in MT5 Break-Even zu werden: Gold, Forex, Indizes, Aktien, Crypto. Großer Verkauf 50% OFF! Preis $199. Regulärer Preis $399 Alle unsere Signale sind jetzt auf myfxbook verfügbar: klicken Sie hier Einzigartige Set-Dateien und alle Empfehlungen werden kostenlos zur Verfügung geste

Titan Strength Pro Indicator - System zur Analyse der Stärke mehrerer Währungen Überblick Titan Strength Pro ist ein technischer Indikator, der die relative Stärke der 8 wichtigsten Währungen (USD, EUR, GBP, CHF, CAD, AUD, JPY, NZD) für alle 28 Devisenpaare gleichzeitig analysiert. Der Indikator berechnet Währungsstärkewerte über mehrere Zeitrahmen und generiert Handelssignale, die auf Stärke-Divergenz, Trendausrichtung und Konvergenz mehrerer Zeitrahmen basieren. Es handelt sich um ein Indikat
FREE

Machen Sie sich die Macht des Ultimate Trend Trader Indicator zunutze. Angesichts der Realität der einzelnen Händler sind wir weit davon entfernt, die Fähigkeiten der KI und der Hochfrequenzhandelsalgorithmen zu nutzen, die die heutigen Märkte beherrschen. Ohne Zugang zu riesigen Datenzentren oder einer Infrastruktur, die den Wettbewerb auf Mikrosekundenbasis ermöglicht, scheint der Kampf verzerrt. Der wahre Vorteil liegt jedoch nicht in technologischen Waffen, sondern in der Nutzung des mensch
FREE
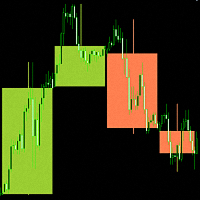
" Candlesticks MTF 5" ist ein Informationsindikator, der "Japanische Candlesticks" anzeigt. Der Indikator analysiert und bestimmt die Eröffnungs- und Schlusszeiten von Kerzen aus höheren Zeitrahmen.
Für den Indikator "Candlesticks MTF 5" wurde ein Algorithmus entwickelt, der die Diskrepanz zwischen den Eröffnungs- und Schlusszeiten von Kerzen aus höheren Zeitrahmen korrigiert. Wenn zum Beispiel der Eröffnungszeitpunkt einer Kerze auf einem wöchentlichen Zeitrahmen der 1. des Monats ist und auf
FREE

Trade Receiver Free ist ein kostenloses Tool zum Kopieren von Trades/Signalen von mehreren MT4/MT5-Konten. Das Anbieterkonto muss einen Kopier-EA verwenden, um das Signal zu senden. Diese Version kann nur auf MT5-Konten verwendet werden. Für MT4-Konten müssen Sie Trade Receiver Free verwenden. Hinweis: - Für MT4-Empfänger, laden Sie bitte Trade Receiver Free herunter.
- Für MT5-Empfänger, laden Sie bitte Trade Receiver Free MT5 herunter.
- Für cTrader-Empfänger, laden Sie bitte Trade Receiver
FREE

Schattenbänder Pro - MT5 说明(中英文) Englische Beschreibung (MT5) Shadow Bands Pro - Fortschrittliches Reversionssystem für MT5 Diese MT5-Ausgabe von Shadow Bands Pro nutzt die Vorteile der MT5-Plattform voll aus und bietet schnellere Berechnungen, mehr Zeitrahmen und bessere Testmöglichkeiten.
Es handelt sich weiterhin um ein Trendumkehr-/Mittelwert-Umkehr-Tool mit dynamischen Kanälen, Entity-Break-Logik und einem integrierten Statistik-Panel, das sich nicht neu malen lässt (beim Schließen). Wic
FREE

Treffen Sie Pure Veil This is a limited pricing phase. Get it at 80 while under 5 sales. Once that cap is reached, new price will be 105. Currently sold: 7 copies.
MQl5-Kanal : https://www.mql5.com/en/channels/robotsofluaiy Anleitungen: https://www.mql5.com/en/blogs/post/763451 Reach out for the correct backtest settings — I’ll send you everything needed.
Entwickelt für Trader, die Einfachheit, Stabilität und strenge Kontrolle schätzen, ist Pure Veil Ihr Ein-Chart-Handelsassistent, der sp

Trend Pullback RCI (Empfohlen: EURUSD H1) Übersicht
Dieses EA ist ein Pullback-System: Die Trendrichtung wird über die EMAs bestimmt, der Einstieg erfolgt erst, wenn der RCI einen Rücklauf/Korrektur bestätigt. So werden späte Einstiege (hoch kaufen / tief verkaufen) möglichst vermieden.
Das EA hält immer nur 1 Position gleichzeitig. Kein Martingale, kein Grid, kein Nachkaufen. * Unterstützt Hedge- und Netting-Konten. Wenn der RCI eine Überkauft-/Überverkauft-Situation anzeigt, wird die Position

MT5 Smart Dashboard ist das ultimative Tool für manuelle Trader, die Geschwindigkeit und automatisches Risikomanagement wünschen. Es verwandelt Ihren Chart in eine professionelle Handelsstation mit einem sauberen dunklen Thema. Hauptmerkmale: Fast Execution Panel: Eröffnen Sie sofort Kauf- und Verkaufstransaktionen . Platzieren Sie Pending Orders ( Limit & Stop) mit einem Klick. Passen Sie Lotgröße und Preis einfach über Schaltflächen (+/-) an. ️ Automatisches Risikomanagement: Auto Break-Ev
FREE

Beschreibung: Schützen Sie Ihre Live- oder Evaluierungskonten, indem Sie nicht zulassen, dass sie die maximale tägliche Inanspruchnahme erreichen! Dieses Dienstprogramm ist am besten für Prop Firmen wie FTMO und MFF (MyForexFunds) und etc. Leitfaden : Anwendbar auf EURUSD 1m Chart.
Standardeinstellungen: Maximaler Abrufsaldo: 4% Kontostand. Maximaler Draw Down Equity: 4% Kontostand Ziel-Gewinnsaldo: 1% Kontosaldo. Ziel-Gewinn-Eigenkapital: 1% Kontostand. Zeit zum Zurücksetzen: 16:57 bis 16:58 G
FREE

Erschließen Sie das volle Potenzial Ihres Pro Thunder V9 Indikators mit unserem revolutionären neuen Plugin - Auto Trend Lines! Sind Sie auf der Suche nach einem Wettbewerbsvorteil auf dem heutigen dynamischen Markt? Suchen Sie nicht weiter. Mit Auto Trend Lines können Sie die Kraft der präzisen Markttrendanalyse nutzen, um fundierte Handelsentscheidungen zu treffen. Dieses innovative Plugin lässt sich nahtlos in Ihren Pro Thunder V9-Indikator integrieren und liefert Ihnen Trenddaten in Echtzeit
FREE
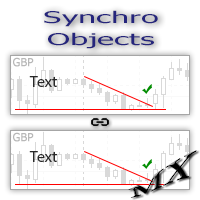
Das Dienstprogramm SynchroObjects wurde entwickelt, um die Arbeit mit grafischen Konstruktionen auf verschiedenen Diagrammen eines Symbols zu erleichtern und zu beschleunigen. Das Dienstprogramm SynchroObjects klont die erstellten Objekte auf alle Diagramme, auf denen das Dienstprogramm ausgeführt wird und die das gleiche Symbol haben. Außerdem ändert es synchron ihre Eigenschaften. Das Dienstprogramm ist einfach zu bedienen und erfordert keine Konfiguration. Tipp: Wenn Sie den Verlauf häufig an
FREE
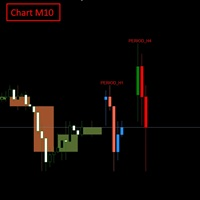
VOLLSTÄNDIGE PRODUKTBESCHREIBUNG Mit Multi-Timeframe Candle Overlay Pro können Sie Kerzen mit höherem Zeitrahmen direkt in Ihrem aktuellen Chart mit absoluter Genauigkeit betrachten. Wenn Sie mit niedrigeren Zeitrahmen wie M1-M15 handeln, ist es von großem Vorteil zu verstehen, wie sich die H1-H4-Kerzen bilden: Sie vermeiden Einstiege in Gegentrends, lesen den Marktkontext schneller und handeln mit mehr Vertrauen.
Der Indikator unterstützt bis zu 2 höhere Zeitrahmen und zeichnet vollständig
FREE

Der „HiperCube USD INDEX (DXY /USDX) “ ist ein Finanzbenchmark, der die Performance einer bestimmten Gruppe von Vermögenswerten wie Aktien, Anleihen oder Rohstoffen mit in US-Dollar denominierten Werten darstellt. Diese Indizes helfen Anlegern, die Performance bestimmter Sektoren oder Märkte im Laufe der Zeit zu verfolgen und zu vergleichen. Da der Index in USD ausgedrückt wird, bietet er ein konsistentes Maß für die Bewertung von Investitionen, unabhängig von der Landeswährung oder dem geograf
FREE

The Gold Guardian (TGG) - Professioneller XAUUSD Breakout & Swing EA (M5) Der Gold Guardian ist ein professioneller Breakout- und Swing-Capture Expert Advisor, der speziell für XAUUSD (Gold) auf dem M5-Zeitrahmen entwickelt wurde.
Er agiert als disziplinierter Hüter Ihres Kapitals - er schneidet falsche Ausbrüche schnell mit kleinen Stop-Losses ab, während er ausgedehnte Goldtrends mit präzisen Trailing-Stops verfolgt. Im Gegensatz zu riskanten Bots, die auf Martingale, Grids oder Averaging setz

Eine einfach zu verwendende, schnelle, asynchrone WebSocket-Bibliothek für MQL5. Sie unterstützt: ws:// und wss:// (sicherer "TLS" WebSocket) Text- und Binärdaten Sie behandelt: fragmentierte Nachrichten automatisch (Übertragung großer Datenmengen) Ping-Pong-Frames automatisch (keep-alive handshake) Vorteile: Keine DLL erforderlich. Keine OpenSSL-Installation erforderlich. Bis zu 128 Web-Socket-Verbindungen von einem einzigen Programm aus. Verschiedene Log Levels zur Fehlerverfolgung Kann mit MQ

GoldFusion Pro - Automatisierter Multi-Strategie Handels EA GoldFusion Pro ist ein algorithmisches Handelssystem, das mehrere Strategien mit einem doppelten Risikomanagementrahmen kombiniert. Es ist für den automatisierten Handel mit verschiedenen Forex-Paaren und Zeitrahmen konzipiert. KERNFUNKTIONEN - Duale Handelsmodi - Einzelhandels- und Multi-Trade-Skalierungssystem - Flexible Take Profit / Stop Loss - dynamische ATR-basierte oder Festpunkt-Konfiguration - Umfassendes Risikomanagement - täg

Dies ist ein Käufer und Verkäufer Aggression Indikator, der die Form jeder Kerze und Projekt diese Daten in einem Histogramm Form analysiert. Es gibt 4 Histogramme in einem. Auf der Vorderseite haben wir zwei: Obere - Käufer Kraft. Untere - Verkäufer Kraft. Im Hintergrund haben wir auch zwei Histogramme, beide mit derselben Farbe. Sie messen die kombinierte Stärke von Käufern und Verkäufern. Diese Histogramme können in den Eingabeparametern ausgeschaltet werden. Es ist auch möglich, das reale od
FREE
Der The Puls ist ein Indikator, der die Akkumulationszeit in Echtzeit anzeigt. In einfachen Worten: Akkumulation ist, wenn "intelligentes Geld" einen Vermögenswert leise sammelt, bevor er eine starke Bewegung auf dem Markt einleitet. Auf dem Chart sieht es so aus, als würde der Preis in einem Bereich "stecken" bleiben. Dies ist die Akkumulationsphase — jemand bereitet sich auf den großen Umzug vor. Und wenn du lernst, diese Momente zu bemerken — wenn der Markt "friert" ein, aber die Spannung sp

MACD 2 Linien MTF (Multi-Timeframe) Indikator für MetaTrader 5 Dieser benutzerdefinierte MetaTrader 5-Indikator implementiert einen klassischen MACD mit zwei Linien (MACD-Linie und Signallinie) und einem farbkodierten Histogramm , erweitert um die Fähigkeit, mehrere Zeitrahmen zu verwenden . Er ermöglicht es Händlern, MACD-Trends von höheren oder niedrigeren Zeitrahmen direkt auf dem aktuellen Chart zu beobachten. Hauptmerkmale: MACD-Linie (Fast EMA minus Slow EMA) Signallinie (SMA der MACD-Lini
FREE

Wir müssen oft die plötzliche Trendänderung kennen, die in der Grafik auftritt, und dies kann durch Indikatoren bestätigt werden.
Dieser Indikator zeigt die Momente der Trendumkehr und wie sich der Preis in welchem Trend verschiebt.
Benutzerdefinierter Hintergrund, keine Notwendigkeit, die Farben im Diagramm zu konfigurieren, ziehen Sie einfach den Indikator!
Anzeige mit Pfeilen.
- Blauer Pfeil: Aufwärtstrend.
- Rosa Pfeil: Abwärtstrend.
HINWEIS: Kostenlose Anzeige, es kann eine Weile d
FREE

Endlich eine Metatrader-Version des sehr beliebten (und teuren) Market Cipher B-Indikators oder des auf der Tradingview-Plattform sehr beliebten Vumanchu Cipher B + Divergences.
Dieses Tool ist sehr rechenintensiv, insgesamt gibt es 31 Plots mit 97 Puffern aus verschiedenen Indikatoren. Auf meinem Mid-End-Computer, Zeitrahmen unter M15 beginnen immer ein bisschen verzögert, so würde es einen leistungsstarken Computer benötigen, um es richtig auf sehr niedrigen Zeitrahmen laufen. Hier ist es noc
FREE

Allgemeine Beschreibung Auto SL/TP Manager ist ein professionelles Dienstprogramm für MetaTrader 5 , das die Verwaltung von Stop Loss- und Take Profit-Levels für offene Positionen automatisiert. Die Niveaus werden auf der Grundlage der vom Benutzer definierten monetären Risikowerte und nicht auf der Grundlage fester Pip-Abstände berechnet. Dieses Tool hilft, eine konsistente Risikodisziplin ohne manuelle Eingriffe aufrechtzuerhalten. Hauptfunktionalität Der EA überwacht kontinuierlich alle offe
FREE
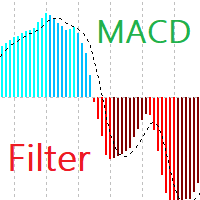
MACD-Filter MACD Filter - eine neue Version des beliebten MACD-Indikators (Moving Average Convergence Divergence), die speziell für die MetaTrader 5-Plattform entwickelt wurde. Durch die Anwendung der Fisher-Transformation zur Filterung und Verfeinerung von Daten erzeugt der MACD Filter glattere Linien, eliminiert Rauschen und liefert klarere Signale. Fisher-Transformation-Filterung: Normalisiert und glättet MACD-Daten. Dies führt zu glatten, weniger chaotischen Linien im Vergleich zum herkömml
FREE

Parallel-Zufallsoszillator mit mehreren Perioden 1. Hauptlinie des Chart-Zyklus und Signallinie 2. 15M 30M 1H feste Zyklus-Signallinie Wird hauptsächlich verwendet, um die überkauften und überverkauften Bedingungen anderer Zyklen im selben Diagramm zu beobachten。. Ihre Hauptfunktion besteht darin, Momente der Multi-Zyklus-Resonanz zu identifizieren, damit Sie Kauf- und Verkaufspunkte besser erkennen können.
FREE

Dieser Expert Advisor eröffnet Trades auf der Grundlage einer Kombination von Signalen der Indikatoren Envelopes, DeMarker, MACD und RSI. Er enthält auch einen Zeitfilter, der den Handel auf die Zeit zwischen 1:00 Uhr und 23:00 Uhr Brokerzeit beschränkt. Ein Handel wird geschlossen, wenn ein entgegengesetztes Einstiegssignal generiert wird, die 32-Perioden-ATR über 0,0015 liegt, ein fester Stop Loss von 2000 Pips erreicht wird oder ein fester Take Profit von 8000 Pips erreicht wird. Zu den Eing

Dieser Indikator zeichnet automatisch die Unterstützungs- und Widerstandsniveaus (Key Levels) für Sie ein, sobald Sie ihn auf einem Chart abgelegt haben. So müssen Sie diese Niveaus nicht jedes Mal neu zeichnen, wenn Sie die Preise in einem Chart analysieren. Alles, was Sie tun müssen, ist, den Indikator auf ein Diagramm zu legen, die Einstellungen nach Ihren Wünschen anzupassen und ihn den Rest machen zu lassen.
Aber es kommt noch besser: Der Indikator ist absolut kostenlos! Für weitere Informa
FREE

Gleitende Durchschnitte Bot mit ATR - Ein umfassendes Trading Tool .
Very RARE POWERFUL AND UNIQUE moving averages BOT that incorporates ATR with Stop Loss, Take Profit Multiplier. Mehrere Time Frames und vieles mehr.
Dieser Bot ist ein beeindruckendes automatisiertes Handelssystem, das die Einfachheit der gleitenden Durchschnitte mit der dynamischen Anpassungsfähigkeit der Average True Range (ATR) kombiniert.
Entwickelt, um Handelsstrategien durch eine ausgewogene Mischung aus Trendfolgetechn

Der Gold Scalper EA ist ein präzisionsgefertigter Expert Advisor, der den XAUUSD (Gold)-Markt durch intelligentes, auf Unterstützung und Widerstand basierendes Scalping dominieren soll. Gebaut mit einer sauberen, einfachen und minimalistischen Handelslogik ohne überkomplizierten Jargon, mit dem die meisten EAs zu werben versuchen, führt dieser Gold-Scalping-Roboter hochwahrscheinliche Ausbruchsgeschäfte mit chirurgischer Genauigkeit aus, indem er einfaches, grundlegendes Support- und Resistance-

Market Session and Custom Session zeigt Markt-Sessions (Asia, London, New York) und eine frei definierbare Session direkt im Chart — inklusive Session-Zonen, High/Low-Marken, optionalen Flächenfüllungen, Labels und Tooltip-Infos. Entwickelt für Intraday-Trader, Scalper und Analysten, die Session-strukturen und wiederkehrende Levels schnell erkennen wollen. Highlights Visuelle Markierung wichtiger Handelszeiten für sofortige Orientierung. Session-Highs und -Lows automatisch markieren — ideal für
FREE
Dieser EA hat keinen Stop-Loss. Alle Risiken liegen in Ihrem Ermessen.
CHIQUITA MT5 EA ist ein vollautomatischer Expert Advisor für den Scalping-Handel auf XAUUSD Zeitrahmen M1 . Die grundlegende Strategie beginnt mit dem Markt Auftrag in Trend Following, so dass diese EA Follow the Trend . M1 Trend.... sehr sehr schnell. MT4-Version Empfehlungen Der Experte ist für XAUUSD M1 programmiert, aber Sie können alle anderen Zeitrahmen mit den entsprechenden Einstellungen verwenden. Ein ECN-Broker w
FREE

System pro neural V3- Das ultimative Multi-Strategy Trading System
Die fortschrittlichste und am meisten verfeinerte Version der DAVITO-Serie, die Jahre der Entwicklung und Optimierung repräsentiert. Dies ist DIE Version, die Sie ausprobieren müssen.
WARUM V3 DIE BISHER BESTE VERSION IST
- Dreifach-Strategie-System: Grid Trading + Breakout Detection + Hybrid Trailing - Integrierter MQL5-Wirtschaftskalender: Filtert automatisch hochrelevante Nachrichten Ereignisse, um Ihre Strategie vor volati
FREE

Der LZ Candle Timer zeigt die verbleibende Zeit an, bevor der aktuelle Balken schließt und ein neuer Balken entsteht. Er hilft Ihnen bei der Verwaltung von Ein- und Ausstiegen rund um Kerzenschlüsse. Der Indikator nutzt die Serverzeit, wird jede Sekunde aktualisiert und ist für eine reibungslose Anzeige bei minimaler CPU-Belastung optimiert.
Highlights der Funktion
- Wählbare Position: Platzieren Sie den Timer in einer der vier Chartecken (oben links, oben rechts, unten links, unten rechts).
FREE

DW Levels - Wöchentliche & tägliche Schlüssel-Levels für MetaTrader 5 DW Levels ist ein leichter und präziser MetaTrader 5-Indikator, der die wichtigsten wöchentlichen und täglichen Kursniveaus direkt auf dem Chart anzeigt.
Er hilft Händlern, schnell starke Unterstützungs- und Widerstandszonen zu identifizieren, die auf den Daten der Vorwoche und der letzten abgeschlossenen Tageskerze basieren. Merkmale des Indikators Hoch der Vorwoche (PWH) Tiefststand der Vorwoche (PWL) Letzte Tageskerze Hoch
FREE
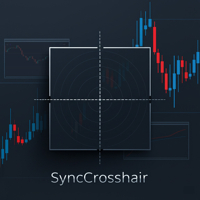
SyncCrosshair - Synchronisiertes & gefangenes Fadenkreuz-Anzeigegerät
Überblick: SyncCrosshair ist ein leichtgewichtiger MQL5-Indikator, der das Fadenkreuz-Erlebnis von TradingView über mehrere MT5-Charts hinweg nachbildet. Bewegen Sie Ihre Maus oder klicken Sie auf ein beliebiges synchronisiertes Diagramm und beobachten Sie, wie die vertikalen und horizontalen Linien genau auf die Eröffnungszeit jeder Kerze im Zeitrahmen des Diagramms (5 min, 15 min, H1, H4, etc.) einrasten.
Hauptmerkmale: -
FREE

Dies ist ein universeller automatischer Expert Advisor für MetaTrader 5, der an Standardindikatoren arbeitet. UniversalEA
Der Constructor EA verfügt über eine Vielzahl von Funktionen. Sie können eines von 20 Signalen auswählen, um eine Position zu öffnen, und 5 von 20 Filtern, um die Signale der im MetaTrader-Paket enthaltenen Standardindikatoren auszusortieren. Außerdem können Sie die Indikatorparameter anpassen, einen Zeitrahmen auswählen und für jedes Signal einen Signalbalken festlegen. Bea

Unverzichtbar für Trader: Tools und Indikatoren Waves automatisch berechnen Indikatoren, Kanal Trend Handel Perfekte Trend-Welle automatische Berechnung Kanal Berechnung , MT4 Perfekte Trend-Welle automatische Berechnung Kanalberechnung , MT5 Lokales Trading Kopieren Einfaches und schnelles Kopieren, MT4 Einfaches und schnelles Kopieren, MT5 Lokales Trading-Kopieren für DEMO Einfaches und schnelles Kopieren , MT4 DEMO Einfaches und schnelles Kopieren , MT5 DEMO "Zusammenarbeit QQ:556024" "Zusam
FREE

Quick Trade ist ein einfaches, aber notwendiges Dienstprogramm für MT5, das es ermöglicht, SL, TP und Einstiegskurs für einen Handel in wenigen Sekunden festzulegen und die richtige Positionsgröße je nach dem gewünschten Risiko zu gestalten. Es bietet Tastenkombinationen, um mehr Zeit zu sparen und natürlich können Sie auch Werte mit der Tastatur eingeben oder Linien auf den gewünschten Wert ziehen! Abkürzung Aktion CTRL + Klicken SL setzen Umschalt + Klick
TP einstellen z + Klick Preis setzen
FREE

Hast du schon einmal daran gedacht, einen Scanner zu haben, der alle Strategien durchsucht und die Kauf- und Verkaufspunkte aller Zeiträume für dieses Asset gleichzeitig anzeigt? Genau das macht dieser Scanner. Dieser Scanner wurde entwickelt, um die Kauf- und Verkaufssignale anzuzeigen, die du im Rule Plotter: Strategieersteller ohne Programmierung erstellt hast, und sie in diesem Scanner auf verschiedenen Assets und Zeiträumen auszuführen. Die Standardstrategie des Rule Plotters besteht nur au
FREE
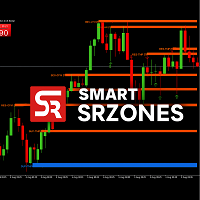
SmartSRZones ist ein MT5-Indikator zur automatischen Erkennung, Anzeige und Verwaltung von Unterstützungs- und Widerstandszonen direkt auf dem Chart.
Er kombiniert die Erkennung von Marktstrukturen mit der Erkennung von Candlestick-Mustern, um Händlern zu helfen, wichtige Kursniveaus ohne manuelle Markierung anzuzeigen. Der Indikator eignet sich für verschiedene Handelsansätze, einschließlich kurzfristiger und langfristiger Analysen. Wichtigste Merkmale Automatische Erkennung von Zonen Identifi
FREE
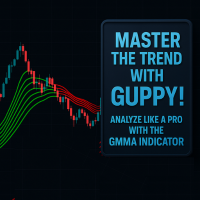
Dies ist ein benutzerdefinierter gleitender Durchschnittsindikator im Guppy-Stil, der für MetaTrader 5 (MT5) entwickelt wurde, um das Aussehen und die Logik der beliebten TradingView-Version zu replizieren. Im Gegensatz zu den eingebauten Tools in MT5 bietet dieser Indikator einen vereinfachten und dennoch leistungsstarken Ansatz, indem er nur 6 Exponential Moving Averages (EMAs) verwendet. Er bietet eine saubere Visualisierung und genaue Marktschichtung, um Händlern zu helfen, bessere Entschei
FREE

Big Figure Levels - Wichtige psychologische Preiszonen für MT5 Big Figure Levels ist ein professionelles Handelswerkzeug für MetaTrader 5, das automatisch wichtige psychologische Kursniveaus, einschließlich Viertel- und Halbniveaus, identifiziert und einzeichnet. Diese Niveaus sind dafür bekannt, dass sie aufgrund ihres Einflusses auf das Verhalten von institutionellen und privaten Händlern als starke Unterstützungs- und Widerstandszonen fungieren. Dieser Indikator eignet sich für jeden Handelss
FREE

TCM Breakeven Calculator Ultra ist ein professionelles Dienstprogramm, das Ihren True Weighted Average Entry Price mit der gesamten Losgröße sofort visualisiert . Im Gegensatz zu einfachen Durchschnittswerten berücksichtigt dieses Tool mathematisch die Losgrößen und gibt Ihnen den genauen Preis an, bei dem Ihre Nettoposition den Nullverlust erreicht. Es scannt automatisch Ihr Terminal und isoliert die Trades auf der Grundlage des Charts, den Sie gerade betrachten. Wenn Sie mit mehreren Paaren (
FREE

Allgemeine Beschreibung Der Fair Gap Value Indikator erkennt und hebt sogenannte „Fair Value Gaps“ im MetaTrader 5-Chart hervor. Ein Fair Value Gap entsteht, wenn zwischen dem Tief einer Kerze und dem Hoch einer zwei Kerzen entfernten Kerze eine Preislücke verbleibt. Der Indikator zeichnet farbige Rechtecke (bullisch und bärisch), um diese Bereiche anschaulich darzustellen und Preisaktionsstrategien zu unterstützen. Hauptmerkmale Bullische Gap-Erkennung : Markiert Lücken zwischen dem Tief der ak
FREE

Regenbogen-Volumenprofil Ein einfacher, leichtgewichtiger Volumenprofil-Indikator, der das Volumen einer Preisspanne mit farbcodierten POCs (Points of Control) visualisiert. Übersicht RainbowVolumeProfile04Simple.mq5 berechnet und zeigt ein Preis-Volumen-Profil (Volume Profile) über eine vom Benutzer festgelegte Anzahl von Balken an. Der Indikator erkennt automatisch die 5 höchsten Volumenkonzentrationen (POCs) und zeichnet ein farbiges horizontales Histogramm auf der rechten Seite des Charts. D
FREE

Spline Searcher MT5 — Multi-Währungs-Indikator zur Früherkennung von Preissplines und Interessenspunkten Hilfswerkzeug zur automatischen Erkennung und Visualisierung früher Stadien komplexer Preisformationen. Der Indikator ist ausschließlich für das manuelle Trading konzipiert und eignet sich für Händler, die mit der Früherkennung fortgeschrittener Marktformationen oder Trends experimentieren, deren Bestandteil einfachere Formationen sein können. Der Indikator identifiziert bis zu sechs Arten v
FREE

Produktname: HTF Candle Insight (EurUsd) - Das große Bild sehen Beschreibung: WICHTIG: Diese Version funktioniert AUSSCHLIESSLICH mit dem EURUSD-Symbol. (Sie unterstützt alle Broker-Präfixe/Suffixe, z.B. pro.EURUSD, EURUSD.m, aber sie funktioniert NICHT mit Gold, Bitcoin oder anderen Paaren). Erleben Sie die volle Leistung von "HTF Candle Insight" komplett auf EURUSD! Hören Sie auf, ständig zwischen den Tabs zu wechseln! Dieser Indikator ermöglicht Ihnen die Visualisierung von Higher Timeframe P
FREE
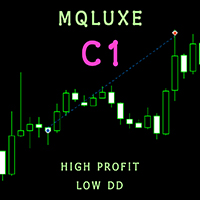
*** ATR ------- Gleitende Durchschnitte ------ RSI ***
MQLuxe C1 ist ein spezieller MT5-Roboter, der ein vollautomatisches Handelssystem ist, das keine besonderen Fähigkeiten von Ihnen erfordert. Starten Sie einfach diesen EA und ruhen Sie sich aus. Sie brauchen nichts einzurichten, EA wird alles für Sie tun. EA ist angepasst, um auf kleinen Einlagen zu arbeiten. Diese Handelsstrategie, die ATR (Average True Range), gleitende Durchschnitte und RSI (Relative Strength Index) kombiniert, ist ein
FREE

Neural FX ist eine leistungsstarke automatisierte Handelslösung, die speziell für die MetaTrader 5-Plattform entwickelt wurde. Dieses System nutzt eine ausgeklügelte Trendfolgestrategie , um während starker Marktmomente hochwahrscheinliche Einstiege zu identifizieren und sicherzustellen, dass Sie auf der richtigen Seite des Marktes bleiben. Egal, ob Sie ein professioneller Händler oder ein Anfänger sind, dieser EA bietet eine "Set-and-Forget"-Erfahrung mit fortschrittlichen Risikomanagement-Prot
FREE

Das Setup Tabajara wurde von einem brasilianischen Händler entwickelt, der als "The OGRO of Wall Street" bekannt ist.
Die Idee dieses Setups ist es, dem Händler den aktuellen Trend der Preise und die Art der Operation anzuzeigen, nach der im Diagramm gesucht werden sollte.
Vorgang
Dies geschieht durch das Verhältnis zwischen dem Schlusskurs und den 20 Perioden, indem die Kerzen in 4 möglichen Farben dargestellt werden : Grün -> Kursanstieg im Aufwärtstrend (Suche nach Einstiegspunkten für KAUF
FREE

Zenith Session Flux ist ein professioneller technischer Indikator für MetaTrader 5, der die als ICT Killzones bekannten institutionellen Handelsfenster identifiziert und visualisiert. Der Indikator automatisiert den Prozess der Zeitanpassung, indem er die Serverzeit Ihres Brokers mit der New Yorker Ortszeit synchronisiert. So wird sichergestellt, dass Session Boxes und Preis-Pivots unabhängig von der Zeitzone Ihres Brokers genau zu den institutionellen Zeitpunkten erscheinen. Merkmale des Indika
FREE

TransitX1 Indikator ist sehr nützlich, mit unbegrenzten Signalen und arbeitet auf allen Zeitrahmen und alle Pfeiler. TransitX1 zeichnet zwei Trendlinien, sehr kurze Trendlinien (+/-20 Balken), die als Unterstützung und Widerstand betrachtet werden können. Die Unterstützung ist die rote Trendlinie und der Widerstand ist die grüne Trendlinie. TransitX1 gibt Kauf- und Verkaufssignale, wobei nur 3 frühere Signale und das vierte das aktuelle Signal sind. Kaufsignale sind als grüne Pfeile dargestellt
FREE

Schaff Trend Cycle (STC) "MIT ALERTS".
Der Schaff-Trend-Zyklus-Indikator (STC) ist ein technisches Instrument, das im Handel und bei Investitionen eingesetzt wird, um Trends zu erkennen und Kauf- oder Verkaufssignale zu generieren. Was ist der Schaff-Trend-Zyklus? Der STC wurde von Doug Schaff entwickelt, um gleitende Durchschnitte durch die Einbeziehung der Zyklusanalyse zu verbessern. Er zielt darauf ab, Trends und Trendänderungen zu erkennen, indem er die Stärke und Geschwindigkeit von Prei
FREE

Trades zu machen kann ziemlich anstrengend sein, wenn Sie mehrere Dinge gleichzeitig betrachten müssen.
Format von Kerzen, Unterstützungen, Widerständen, Zeitplänen, Nachrichten und Indikatoren.
Dieses Tool soll die Analyse des ADX-Indikators erleichtern. Es färbt die Kerzen basierend auf den Pegeln des Indikators und den DI-Linien.
Der Zeitraum, die Grenze des Indikators und die Farben der Kerzen sind anpassbar. Sie können auch eine visuelle Hilfe unten rechts im Diagramm platzieren, um die
FREE

Wenn Ihnen dieses kostenlose Tool gefällt, sehen Sie sich meinen EA an, der derzeit im Launch Sale für nur $39 angeboten wird! https://www.mql5.com/zh/market/product/159132?source=Site Zusammenfassung: Tick Delta Flow ist ein professionelles Orderflow-Analysetool, das für Scalper und Daytrader entwickelt wurde. Im Gegensatz zu Standard-Volumenindikatoren zerlegt es jeden Preis-Tick, um den tatsächlichen aggressiven Kauf- und Verkaufsdruck (Delta) innerhalb jeder Kerze aufzudecken. Es bietet eine
FREE
MetaTrader Market bietet jedem Entwickler eine einfache und bequeme Plattform für den Verkauf von Programmen.
Wir unterstützen Sie bei der Veröffentlichung des Produkts und beraten Sie gerne, wie man eine Beschreibung für den Market vorbereitet. Alle Produkte, die im Market verkauft werden, sind durch eine zusätzliche Verschlüsselung geschützt und können nur auf dem Rechner des Kunden gestartet werden. Illegales Kopieren ist ausgeschlossen.
Sie verpassen Handelsmöglichkeiten:
- Freie Handelsapplikationen
- Über 8.000 Signale zum Kopieren
- Wirtschaftsnachrichten für die Lage an den Finanzmärkte
Registrierung
Einloggen
Wenn Sie kein Benutzerkonto haben, registrieren Sie sich
Erlauben Sie die Verwendung von Cookies, um sich auf der Website MQL5.com anzumelden.
Bitte aktivieren Sie die notwendige Einstellung in Ihrem Browser, da Sie sich sonst nicht einloggen können.