Regardez les tutoriels vidéo de Market sur YouTube
Comment acheter un robot de trading ou un indicateur
Exécutez votre EA sur
hébergement virtuel
hébergement virtuel
Test un indicateur/robot de trading avant d'acheter
Vous voulez gagner de l'argent sur Market ?
Comment présenter un produit pour qu'il se vende bien
Expert Advisors et indicateurs pour MetaTrader 5 - 48

Gold Pro SMC Big Player EA MT5 - Note This EA Can also be used on Indices such as US30, NASDAQ, FR40, DAX, UK, BTCUSD, Metals and Currencies. Write Separately to me for set files after purchase. Set file for Backtesting/forward testing is attached in Comment Section- Must Use it on XAUUSD/Gold in M30 time. The Gold Pro SMC Big Player EA MT5 is a next-generation trading system built on Smart Money Concepts (SMC) and institutional order flow logic .
It identifies high-probability zones where inst

Genaral: Not martingale, not a grid; Use on EURUSD Use on M5
Signals: There is a good rational algorithm. Work of two indicators: Chaikin and DeMarker (from 2 timeframes) (you can set a separate Timeframe for each indicator)
Stop Loss/Take Profit: There is a good money management system (there are several type for trailing stop loss); There is virtual levels of Stop Loss / Take Profit; There is smart lot (percent by risk) or fix lot
Important: EA can work on closed candles, and on curr
FREE

The Draggable Candle Timer is a clean, minimal countdown to the next candle close. Fully customizable and freely draggable, it can be placed anywhere on the chart without interfering with trading or analysis. The timer runs on the system clock, avoiding the glitches and delays common in candle timers that rely on the Market Watch clock. An optional candle-close alert can be enabled for traders who want a simple sound notification as the current candle approaches its close — useful for those rel
FREE

Le Nadaraya-Watson Envelope est un indicateur basé sur une régression non paramétrique qui aide les traders à identifier les tendances, les niveaux de support et de résistance à l’aide de bandes lissées et adaptatives. Contrairement aux moyennes mobiles traditionnelles ou aux enveloppes basées sur l’écart-type, cet indicateur utilise la régression à noyau de Nadaraya-Watson , qui s’adapte dynamiquement aux mouvements des prix, réduisant le décalage tout en restant réactif.
Caractéristiqu
FREE

INTRODUCTION : The breakout strength meter is a trading tool that is used to identify which currencies are the strongest to breakout, and which currencies are the weakest to breakout. The settings for the indicator are easy, and if you cannot find the settings, please leave a comment The tools are completely free to use Please, if you like the indicator, please leave a comment and rate the indicator in order to develop it
FREE
This indicator provides a clear, at-a-glance dashboard for monitoring both the Relative Strength Index (RSI) and Stochastic Oscillator on any instrument or timeframe.
Whenever both RSI and Stochastic %K simultaneously exceed their respective overbought or oversold levels, the indicator displays an arrow signal in the indicator window.
These signals highlight strong momentum and can help traders quickly identify high-probability reversal zones. As with all my free tools, the arrow symbol can be e
FREE

BandPulse is a powerful trading expert that combines Martingale, Hedging, and Scalping strategies, simplifying the management of trading complexities. This EA uses advanced algorithms to maximize the strengths of each strategy while meticulously managing risks.
The balance-based risk management feature provides users with safety, and when used in conjunction with IAMFX-Agent , it can achieve both risk management and profit maximization.
This combination is designed to offer users the best pos
FREE

DGoldInfinity – Le robot de trading automatique professionnel ultime pour l'or DGoldInfinity EA est un système de trading entièrement automatisé ( Expert Advisor), conçu spécialement pour le scalping sur le marché de l'or ( XAUUSD) en unité de temps M15 .
Il intègre des stratégies d'entrée précises, des filtres intelligents alimentés par l'IA, une gestion des risques robuste, et une logique d'exécution disciplinée pour des performances constantes et professionnelles. Fonctionnalités clés 1. S

Fair Value Gap Sweep is a unique and powerful indicator that draws fair value gaps on your chart and alerts you when a gap has been swept by the price. A fair value gap is a price gap that occurs when the market opens at a different level than the previous close, creating an imbalance between buyers and sellers. A gap sweep is when the price moves back to fill the gap, indicating a change in market sentiment and a potential trading opportunity.
Fair Value Gap Sweep indicator has the following
FREE

Forex17 Clock est un utilitaire léger et minimaliste pour MetaTrader 5, conçu pour afficher sur le graphique l’heure du serveur du courtier et/ou une heure ajustée par l’utilisateur. L’objectif du produit est de fournir une information temporelle claire et précise sans interférer avec l’analyse graphique, tout en conservant un graphique propre et fonctionnel. L’horloge est dessinée directement sur le graphique en utilisant uniquement du texte, sans panneaux, arrière-plans, bordures ou éléments v
FREE

Drag Drop Lot Size Calculator Overview Drag Drop Lot Size Calculator is a chart-based risk and position sizing tool for MetaTrader 5. It calculates the appropriate lot size based on your account balance (or equity), the selected risk percentage, and the stop-loss distance defined by a single horizontal line on the chart. A compact on-chart panel displays the key values in real time. Key Features One-line workflow: uses a single horizontal line as the stop-loss level Real-time lot size calculatio
FREE

YOU CAN NOW DOWNLOAD FREE VERSIONS OF OUR PAID INDICATORS . IT'S OUR WAY OF GIVING BACK TO THE COMMUNITY ! >>> GO HERE TO DOWNLOAD
The Volatility Ratio was developed by Jack D. Schwager to identify trading range and signal potential breakouts. The volatility ratio is defined as the current day's true range divided by the true range over a certain number of days N (i.e. N periods). The following formula is used to calculate the volatility ratio: Volatility Ratio (VR) = Today's True Range
FREE

Smart Grid MT5 automatically recognizes any symbol, period and scale of the chart and marks it up accordingly. It is possible to mark up the chart by trading sessions. The grid consists of the two main line types.
Vertical lines There are two visualization methods: Standard - the lines are divided into three types, separating: Small time period. Medium time period. Large time period. Trading Session - the lines are divided into groups (a total of ten). Each group has two lines: the first is res
FREE

Velas Multi Time Frame
Las velas multi time frame, también conocidas como "MTF candles" en inglés, son un indicador técnico que permite visualizar velas japonesas de un marco temporal diferente al marco temporal principal en el que estás operando. Este enfoque ofrece una perspectiva más amplia del comportamiento del precio, lo que resulta especialmente útil para los traders que emplean estrategias de acción del precio. A continuación, se detallan los conceptos clave relacionados con este indic
FREE
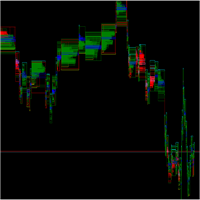
O SpreadFlow é um indicador para MetaTrader que gera um gráfico totalmente baseado no comportamento do fluxo de negócios, em vez de se limitar apenas a candles de tempo ou volume.
Ele organiza as informações de cada tick em quatro dimensões principais: Spread – monitora a diferença entre BID e ASK ao longo do tempo, mostrando momentos de compressão e alargamento do spread, associados a maior ou menor liquidez. Negócio no mesmo preço – identifica quando sucessivos negócios ocorrem no mesmo nível
FREE

DoubleOB est un EA automatisé conçu pour trader l'EUR/USD M5. Il utilise des blocs d'ordres, des sorties dynamiques et des stops suiveurs avec une gestion avancée du risque. Idéal pour un scalping sûr et cohérent. Compatible avec l'optimisation et le VPS.
Optimisé pour l'EUR/USD (M5) Paramètres hautement personnalisables Détection des blocs d'ordres et des FVG Gestion dynamique des TP/SL avec points pivots Trail Stop automatique & Break Even Filtrage des sessions horaires Gestion quotidienne
FREE

Double RSI EA – Smart Multi-Timeframe Strategy This Expert Advisor uses two RSI indicators from different timeframes to confirm Buy/Sell signals. A trade is opened only when both RSI values meet the required level — reducing false entries and improving accuracy. Dual RSI confirmation (e.g., H1 + M15) Price-based SL/TP and optional trailing stop Only one active trade at a time Reverse trades enabled after signal change ️ On-chart status panel for RSI1, RSI2 & trade status Works
FREE
This is the automatic realization of multi single and open position EA, welcome to use. It has passed many historical data tests before it was put on the shelves. The following is EA's principle of multiple orders and closing positions: 1. Through the golden fork generated by the two moving averages, multiple orders can be automatically bought. The cycles of the two moving averages can be set by themselves. The default value of the small cycle moving average is 5, and the default value of the l
FREE

RSI ALARM (For Metatrader 5)
This indicator works like a normal RSI with all its settings (Periodicity, colors, levels, etc),
but additionally, alarms can be set at the upper and lower level (Example 70 and 30), with the possibility of adjusting these levels by moving the blue and red lines to establish the upper and lower levels.
You can also turn on and off an additional function that creates an arrow on the chart when the expected upper or lower RSI is met.

Le comportement des différentes paires de devises est interconnecté. L'indicateur Visual Correlation vous permet d'afficher différents instruments sur 1 graphique tout en conservant l'échelle. Vous pouvez définir une corrélation positive, négative ou aucune.
Certains instruments commencent à bouger plus tôt que d'autres. Ces moments peuvent être déterminés en superposant des graphiques.
Pour afficher un instrument sur un graphique, vous devez saisir son nom dans le champ Symbole. Version
FREE
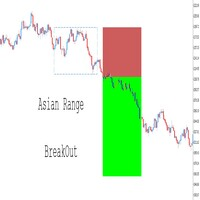
paramètres tels que le temps de range, les couleurs, les styles de ligne et les réglages risque-récompense. Visualisation des niveaux de trading – Trace automatiquement les niveaux de prix d’entrée, de stop-loss (SL) et de take-profit (TP) en fonction des conditions de breakout. Intégration fluide avec les Expert Advisors (EAs) – Prenez le contrôle total de vos stratégies automatisées en ajoutant des confirmations supplémentaires comme le RSI, les Moyennes Mobiles, la Rupture de Structure (B
FREE

SummarySignalLine is an intelligent multi-indicator for MetaTrader 5 that combines signals from five classical technical indicators into a single smoothed signal line. The indicator visualizes overall market sentiment in a simple, intuitive format with color coding. Key Features Composite Analysis — combines MA, RSI, Bollinger Bands, Stochastic, and ATR Smoothed Signal — reduces market noise with configurable smoothing Visual Clarity — color gradient from green (bullish) to red (bearish)
FREE

ADR, AWR & AMR Indicator: Comprehensive Trading Guide Try "Average Daily Range Scalper":
https://www.mql5.com/en/market/product/154469 Core Concepts ADR (Average Daily Range) Definition : The average distance between daily high and low prices over a specified lookback period (typically 14-20 days) Purpose : Measures daily volatility expectations, identifies range-bound versus trending days, sets realistic intraday profit targets Key Insight : Markets tend to respect their average volatility - d
FREE
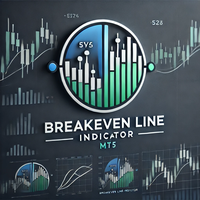
Simple indicator to show Breakeven line for all orders on attached chart pair. This indicator also comes with additional information such as Total Lot Size, Floating Drawdown in account's currency and Number of open positions and Difference from current price in Points. Do you use DCA (dollar cost average) or Hedging approach on your trading? Then this indicator you MUST have. Really useful, when you have multiple orders (hedging), this can help you quickly identify breakeven point without calc
FREE

Paranormal Insightment Use with : Ritz MA Ribbon Dynamics (check on my product) Ritz Paranormal Insightment is a precision-engineered analytical indicator that blends momentum intelligence and trend confirmation into a single visual system.
It merges the DeMarker oscillator with a dynamic Moving Average filter , detecting price exhaustion and directional shifts with remarkable clarity. The indicator translates subtle market imbalances into actionable visual and auditory signals, helping trad
FREE

Aurea Stella EA – Illuminate Your Trading Path Like the guiding stars that lead sailors through uncharted waters, Aurea Stella EA empowers you to navigate the unpredictable seas of the financial markets. Craft Your Own Constellation of Strategies: Endless Combinations – Weave together Bollinger Bands, Stochastic, RSI, MACD, Envelopes, and Donchian Channels to create your unique trading patterns.
Precision Control – Adjust stop loss, take profit, trailing stops, and choose whether to reverse
FREE

Description. This product was created based on low investment EA,
EA "OPHEX" is an advanced system that exploits GOLD XAUUSD Only. I uses both Scalping and Hedging Strategy. Once the Scalping hits SL it converts the position into Hedging and recovers the loss.EA gives upto 10% return every month with low risk. We can increase initial lot size for more return while account grows.
Advantages. Get upto 10% Returns every month with very low risk; Much cheaper than similar alternatives; Operat
FREE

Chỉ báo Watermark là một công cụ trực quan thường được sử dụng để lưu trữ các ký hiệu giao dịch và khung thời gian. Các tính năng chính trên chỉ báo: Tạo nhãn dán ký hiệu giao dịch tạo nhãn dán khung thời gian giao dịch Cố định vị trí theo chart giá Chỉ báo không tác động đến các tín hiệu giao dịch của nhà đầu tư. Nếu có bất kỳ vấn đề vui lòng phản hồi lại để chúng tôi có thể cải thiện sản phẩm.
FREE
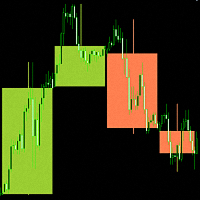
"Candlesticks MTF 5" is an information indicator that displays "Japanese Candlesticks" . The indicator analyzes and determines the opening and closing times of candles from higher time frames.
An algorithm has been developed for the "Candlesticks MTF 5" indicator that corrects the discrepancy between the opening and closing times of candles from higher time frames. For example, if the opening time of a candle on a weekly time frame is the 1st of the month, and on the smaller time frame this da
FREE

Want to AUTOMATE this strategy? We have released the fully automated Expert Advisor based on this logic. Check out Range Vector Fibo Logic EA here: https://www.mql5.com/en/market/product/158065
UPGRADE AVAILABLE: Tired of manual trading? I just released the Automated MTF Version with Mobile Alerts and Auto-Targets. Get the Pro Version here: https://www.mql5.com/en/market/product/159350
Range Vector Fibo Logic (Indicator) One Candle Strategy
Stop waking up at 3 AM to draw lines manually. Ran
FREE
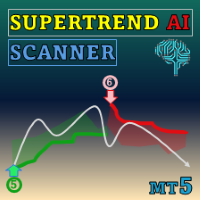
Special offer : ALL TOOLS , just $35 each! New tools will be $30 for the first week or the first 3 purchases ! Trading Tools Channel on MQL5 : Join my MQL5 channel to update the latest news from me Découvrez la puissance de l'IA avec le SuperTrend AI Clustering MT5 avec Scanner , un outil révolutionnaire pour MetaTrader 5 (MT5). Cet indicateur redéfinit l'analyse du marché en combinant le clustering K-means avec l'indicateur SuperTrend largement populaire, offrant aux traders un av

Cet indicateur est basé sur la stratégie proposée par la chaîne YouTube 'The Secret Mindset', sur la vidéo "A Reliable Scalping Strategy I Discovered After 1 Month of Price Action Trading" Une explication complète et détaillée de la stratégie et des conditions pour filtrer les signaux est exposée sur la vidéo. * Le créateur de la chaîne YouTube n'est pas lié au développement de cet indicateur Les signaux doivent être combinés avec d'autres indicateurs et être filtrés par le jugement de chaque t
FREE

Prenez le contrôle de votre routine de trading sans effort avec le Trades Time Manager révolutionnaire. Cet outil puissant automatise l'exécution des ordres à des moments précis, transformant votre approche de trading. Créez des listes de tâches personnalisées pour diverses actions commerciales, de l'achat à la définition des commandes, le tout sans intervention manuelle. Guide d'installation et d'entrées de Trades Time Manager Si vous souhaitez recevoir des notifications sur l'EA, ajoutez notre

RSI 14 Expert Advisor – FINAL v1.31 RSI 14 Expert Advisor – FINAL v1.31 is a fully automated trading system for MetaTrader 5 (MT5) based on the classic Relative Strength Index (RSI) reversal strategy.
This EA is designed to trade safely across Forex pairs, Gold (XAUUSD), and other CFDs , with built-in broker protection and risk management features. Trading Strategy Uses RSI period 14 as the main indicator BUY trades are opened when RSI reaches or falls below 30 (oversold condition) SELL t
FREE

Le HiLo Ladder est une réinterprétation de l’indicateur classique HiLo , largement utilisé par les traders pour identifier les tendances et les points de retournement potentiels du marché. Contrairement à la version traditionnelle, le HiLo Ladder se présente sous un format en escalier — les populaires « marches » — rendant la lecture des mouvements de prix beaucoup plus claire et intuitive. Principaux avantages : Visualisation simplifiée des phases haussières (vert) et baissières (rouge). Ana
FREE

Moving Average RAINBOW Forex traders use moving averages for different reasons. Some use them as their primary analytical tool, while others simply use them as a confidence builder to back up their investment decisions. In this section, we'll present a few different types of strategies - incorporating them into your trading style is up to you! A technique used in technical analysis to identify changing trends. It is created by placing a large number of moving averages onto the same chart. When a
FREE

The indicator allows you to simplify the interpretation of signals produced by the classical ADX indicator.
The position of the hight bars of the histogram relative to zero and the histogram coloring indicate the direction of price movement determined by the intersection of DI+ / DI-.
The position of the hight bars of the histogram relative to zero and the color indicate the strength of the price movement.
The indicator is a logical continuation of the series of indicators using this classica
FREE

Unlock powerful breakout opportunities
The 123 Pattern is one of the most popular, powerful and flexible chart patterns. The pattern is made up of three price points: a bottom, a peak or valley, and a Fibonacci retracement between 38.2% and 71.8%. A pattern is considered valid when the price breaks beyond the last peak or valley, moment at which the indicator plots an arrow, rises an alert, and the trade can be placed. [ Installation Guide | Update Guide | Troubleshooting | FAQ | All Products ]

Unlock market continuations with the accurate pennants indicator
This indicator finds pennants , which are continuation patterns identified by converging trendlines surrounding a price consolidation period. Trades are signaled using a breakout period alongside the formation breakout. [ Installation Guide | Update Guide | Troubleshooting | FAQ | All Products ] Easy to use Customizable colors and sizes It implements breakout signals It implements alerts of all kinds
Optimal Usage To see pennants
Cet utilitaire EA clôture tout ordre d'achat ou de vente lorsqu'il atteint la valeur de profit souhaitée ou lorsque le stop gain est activé. Ferme les commandes ouvertes manuellement ou par d'autres robots. Très efficace pour protéger ou garantir des gains lors de mouvements rapides de prix. Il fonctionne sur n'importe quelle période et n'importe quel actif disponible sur MT5.
Trailing Start : Exemple, si le prix évolue de 70 pips en faveur, il active le stop gain. Traling Stop : ou Traling
FREE

Check out my TRADE PLANNER MT5 – strongly recommended to anticipate account scenarios before risking any money. This is the moving average convergence divergence (MACD) indicator based on Heikin Ashi calculations. Here you find multi-colored histogram which corresponds to bull (green) / bear(red) trend. Dark and light colors describes weakness/strenght of price trend in time. Also you can switch calculations between normal and Heikin Ashi price type.
Note: Buffers numbers for iCustom: 0-MACD,
FREE

L'indicateur identifie les divergences en analysant les pentes des lignes reliant les sommets ou creux du prix et de l'histogramme MACD. Divergence Haussière (Convergence) : Elle se produit lorsque les lignes reliant les creux du MACD et les creux correspondants sur le graphique des prix ont des pentes opposées et convergent. Divergence Baissière : Elle se produit lorsque les lignes reliant les sommets du MACD et les sommets correspondants sur le graphique des prix ont des pentes opposées et

Jackson trendline scanner it a powerful price action tool which draw accurate trendlines and alert a breakout signals . As we all know that trendlines it a most powerful tool in price action by providing us with different chart patterns. e.g. Bullish flag, Pennant, Wedges and more...It not easy to draw trend lines, Most successful traders use trendlines to predict the next move based on chart pattern and breakout. Drawing a wrong trendline it a common problem to everyone, wrong
FREE

MT5 Smart Dashboard is the ultimate tool for manual traders who want speed and automatic risk management. It transforms your chart into a professional trading station with a clean dark theme. Key Features: Fast Execution Panel: Open Buy and Sell trades instantly. Place Pending Orders (Limit & Stop) with one click. Adjust Lot Size and Price easily via buttons (+/-). ️ Automatic Risk Management: Auto Break-Even (BE): Moves your Stop Loss to the entry price automatically
FREE

Mahdad Candle Timer est un indicateur léger et précis pour MetaTrader 5 qui affiche le temps restant avant la clôture de la bougie en cours, directement à côté de la dernière barre. Il est conçu pour les traders qui ont besoin d’un timing exact — que ce soit pour le scalping, le day trading ou l’attente de la confirmation d’une bougie dans des configurations swing. Caractéristiques principales Compte à rebours précis – Temps restant en HH:MM:SS (optionnellement en millisecondes) Placement dy
FREE

Gold Master Indicator MT5 - Institutional Precision for XAUUSD The Gold Master Indicator is an advanced analysis tool specifically designed for the unique volatility of the Gold (XAUUSD) market. This indicator not only tracks the price but also identifies liquidity zones and institutional turning points where the probability of reversals is higher.
Unlike standard indicators, Gold Master uses a data smoothing algorithm to eliminate market noise, allowing traders to capture clean movements on t

The Arbitrage365 EA is a basic script for MetaTrader that implements a triangular arbitrage strategy. It identifies and exploits price discrepancies between EURUSD, GBPUSD, and EURGBP to profit from temporary market mispricing. This EA capitalizes on the law of one price by simultaneously buying and selling currency pairs. Its advantages include speed, accuracy, scalability, consistency, cost-effectiveness, contribution to market liquidity, and portfolio diversification. However, it's a basic E
FREE
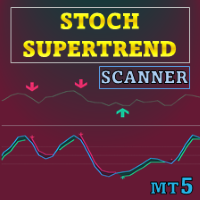
Offre spéciale : ALL TOOLS , seulement 35 $ chacun ! Les nouveaux outils seront à 30 $ pendant la première semaine ou pour les 3 premiers achats ! Trading Tools Channel on MQL5 : Rejoignez mon canal MQL5 pour recevoir mes dernières actualités Cet outil combine Stochastic RSI avec la logique SuperTrend afin de générer des signaux directionnels basés sur les changements de momentum. Il superpose une enveloppe de type SuperTrend sur le Stochastic RSI et met en évidence les points de r

Xauusd Mr Gold : Excellence en Trading Algorithmique de l'Or (H1). Optimisez votre stratégie sur Xauusd (Or) avec Xauusd Mr. Gold , un Expert Advisor (EA) conçu pour une rentabilité supérieure. Ce système automatisé combine une analyse approfondie avec une exécution précise sur H1. Données Clés de Performance : Bénéfice Net : $51,877.28 Facteur de Profit : 2.26 Drawdown Maximum : 1.52% Taux de Victoires : 54.6% (1260 Opérations) TCAC (Taux de Croissance Annuel Composé) : 6.15% Xauusd Mr Gold

EA Trendline Fusion est un expert advisor innovant qui détecte et trade les lignes de tendance diagonales. Conçu pour les traders utilisant l’analyse technique classique, ce système permet à la fois le trading automatique et les signaux visuels avec alertes. Pour utiliser correctement le testeur de démonstration, suivez les paramètres optimisés affichés dans les images pour chaque paire et chaque période de temps. Cet EA commence à 45 $ et augmentera avec les ventes jusqu’à atteindre 65 $.
Ca

Volume Weighted Average Price (VWAP) is a trading benchmark commonly used by Big Players that gives the average price a Symbol has traded throughout the day. It is based on both Volume and price. Additionally we put in this indicator the MVWAP (Moving Volume Weighted Average Price). For those who do not know the usage and the importance od this indicator I recommend a great article about this subject at Investopedia ( https://www.investopedia.com/articles/trading/11/trading-with-vwap-mvwap.asp
FREE

Cet outil affiche l'actualité économique directement sur le graphique. Il indique les événements à venir, leur date de publication, leur importance et envoie des notifications.
Pour :
Pour les traders qui suivent l'actualité économique
Pour ceux qui investissent en fonction des annonces économiques
Pour les traders qui souhaitent recevoir des alertes en temps réel
Pour les utilisateurs qui ont besoin d'un calendrier simple et intuitif directement sur le graphique
Fonctionnalités clés Pann
FREE

Genaral: Not martingale, not a grid; Use on EURUSD Use on M5 EA was opimized only on 2020 year
Signals: There is a good rational algorithm. Work of 3 indicators: WRP, DeMarker, CCI (from 3 timeframes) (you can set a separate Timeframe for each indicator)
Stop Loss/Take Profit: There is a good money management system (there are several type for trailing stop loss); There is virtual levels of Stop Loss / Take Profit; There is smart lot (percent by risk) or fix lot
Important: EA can work on
FREE

Index Stalker EA (v1.x Series) Prop Firm Ready
Stay on the Rules
1% Risk Margin.
3% Daily Drawdown.
$10000 account.
Please Don't Hesitate to Contact me for any info you need. 1. High-Impact Product Description In the volatile currents of the NASDAQ 100, the greatest opportunities are found not through brute force, but through precision and patience. Introducing Index Stalker EA , the sophisticated trading tool engineered to silently track and execute high-probability setups with surgical accu
FREE

Break Even Line by MMD
The Break Even line is a useful indicator for people using strategies that allow simultaneous trades in both directions, such as the MMD methodology. This indicator is useful when playing statistical models and averaging positions in accumulation and distribution zones. The indicator draws levels by summing positions in three groups: positions included in BUY, positions included in SELL and all positions included.
Functionality description:
Show BUY BELine - shows or
FREE

Gold Swing Dragon is an Expert Advisor designed specifically for trading XAUUSD (Gold) using a swing-based approach.
The EA applies trend-following logic together with swing entry timing to identify retracement, breakout, and reversal opportunities.
It includes integrated trade management and risk control features suitable for different market conditions. Core Features Swing-Based Entry System : Detects potential swing setups and places trades at selected reversal or breakout zones. Trend Filter

For those who like trend the Force will be a very useful indicator. This is because it is based on the famouse ADX, which measure the strenght of a trend, but without its 3 confusing lines. Force has its very simple interpretation: if the histogram is above zero level the trend is up, otherwise it is down. You can use it to find divergences too, which is very profitable. Thanks to Andre Sens for the version 1.1 idea. If you have any doubt or suggestion, please, contact me. Enjoy!
MT4 version:
FREE

Product Name: HTF Candle Insight (EurUsd) - See the Big Picture Description: IMPORTANT: This version works EXCLUSIVELY on the EURUSD symbol. (It supports all broker prefixes/suffixes, e.g., pro.EURUSD, EURUSD.m, but will NOT work on Gold, Bitcoin, or other pairs). Experience the full power of "HTF Candle Insight" completely on EURUSD! Stop switching tabs constantly! This indicator allows you to visualize Higher Timeframe price action directly on your current trading chart. Whether you are a Sca
FREE

GoldMiner EA Pro MT5 - Advanced Neural Trend Trading for XAUUSD SUMMARY Unlock the power of automated gold trading with GoldMiner EA Pro, a high-precision Expert Advisor specifically designed for the unique volatility of XAUUSD. Unlike generic bots, GoldMiner uses a proprietary confluence engine that combines institutional trend following with real-time volume validation to capture high-probability moves.
WHY GOLDMINER EA PRO?
Precision Entry Engine: Uses multi-level analysis (EMA, RSI, MACD)
Stop guessing where the market will turn. Our advanced High/Low Indicator for MT5 is the ultimate tool for mastering price action and identifying key market structure. It automatically scans the chart to identify and clearly plot all critical swing highs and lows in real-time, helping you see the true story behind the candles. These crucial, non-repainting levels form the backbone of any successful trading strategy. Use them to instantly visualize the market's framework, allowing you to pinpoint
FREE

Keltner-Enhanced improves the accuracy and readability of Keltner Channels with many options for adjusting them and more five price calculations beyond the META default.
The Keltner-E indicator is a banded indicator similar to Bollinger Bands and Moving Average Envelopes. They consist of an upper envelope above a midline and a lower envelope below the midline.
The main occurrences to look out for when using Keltner Channels are breakouts above the Upper Envelope or below the Lower Envelope.
FREE

EA Doctor Bullish mt5 is an Expert Advisor designed specifically for trading gold, BTC, EURUSD. The operation is based on opening orders using the EMA/RSI indicator, thus the EA works according to the "Trend Follow" strategy, which means following the trend. For Expert Advisor need hedge type account Contact me immediately after the purchase if you prefer to get commission (Rebate) up to 40$/Lot! You can get a free copy of our Strong Support and Trend EA for unlimited account, please pm. me!
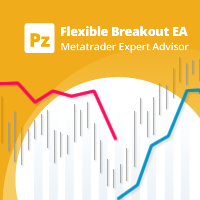
Trade donchian breakouts with complete freedom. This EA can trade any breakout period, any timeframe, with pending or market orders- as desired- and implements many other useful features for the exigent trader, like customizable trading sessions and week days, a martingale mode and inverse martingale mode. [ Installation Guide | Update Guide | Troubleshooting | FAQ | All Products ] Easy to use and supervise Customizable trading direction Customizable donchian breakout period It can trade using
FREE

Demand and supply zones Support and Resistance areas Show broken zones Show tested and untested zones Show weak zones Fractal factors Notifications when price reaches point of Interest with Push notifications and pop ups Customizable History Clickable Works on all Timeframes Works on all pairs.
Free for a while till further notice and changes. The demand and supply bot coming soon
FREE

The "Close All Order Tools" tool is designed to solve common problems faced by Forex traders when managing profitable orders—especially in highly volatile market conditions or when dealing with multiple open trades simultaneously. Problems This Tool Solves: Unable to close orders in time : “Just when it was rising nicely, the price suddenly dropped—I couldn’t close it in time, and the profit vanished.” Closing orders one-by-one is time-consuming : “With multiple orders open, closing each one ind
FREE

The utility places a grid of pending orders . You can select the number of orders in the grid, the step between orders, multiplier for the order size, SL and TP levels, magic number etc. If you use a profit bucket , please note that it applies to all orders on the current currency pair with the current magic. If you want to use several grids with independent profit buckets at the same time, run several copies of the utility and specify different magics in the settings. MT4 version of the utility
FREE
This expert is a pure volatility scalper working with market orders orders. Expert not use any indicator, only use prices action and volatility of price to generate signals. Using an algorithm to calculate the speed of price to generate the signals. There are three conditions for it to work: Tight spread Fast execution Stop level = 0 Please during the tests of this EA do not simultaneously use another EA in the same terminal because it affects the modification speed. Try expert on demo accoun
FREE
FULL PRODUCT DESCRIPTION Multi-Timeframe Candle Overlay Pro lets you view higher-timeframe candles directly on your current chart with absolute accuracy. When trading lower timeframes like M1–M15, understanding what the H1–H4 candles are forming is a major advantage: you avoid counter-trend entries, read market context faster, and trade with more confidence.
The indicator supports up to 2 higher timeframes, drawing full OHLC candles with precise positioning—no misalignment, no distortion. C
FREE

Signal222 Apex Command – Ultimate Multi-Currency Dashboard & Auto-Trader Short Description A high-performance command center for MetaTrader 5 that scans 8 assets simultaneously, providing real-time risk/gain calculations, one-click manual execution, and optional fully automated trading. Description Signal222 Apex Command is more than just an indicator; it is a professional-grade trade management utility designed for traders who handle multiple currency pairs. In the fast-moving 2026 markets, spe
FREE

Améliorez Votre Analyse avec le Weis Wave Box ! Si vous cherchez précision et clarté dans vos négociations , le Weis Wave Box est l’outil idéal. Cet indicateur avancé d’ondes de volume offre une visualisation claire de la dynamique entre effort et résultat sur le marché, essentiel pour les traders utilisant la lecture du flux et du volume. Fonctionnalités principales : Ondes de volume personnalisables – ajustez en ticks pour s’aligner avec votre stratégie.
Historique ajustable – analy
Le MetaTrader Market est un site simple et pratique où les développeurs peuvent vendre leurs applications de trading.
Nous vous aiderons à publier votre produit et vous expliquerons comment préparer la description de votre produit pour le marché. Toutes les applications de Market sont protégées par un cryptage et ne peuvent être exécutées que sur l'ordinateur de l'acheteur. La copie illégale est impossible.
Vous manquez des opportunités de trading :
- Applications de trading gratuites
- Plus de 8 000 signaux à copier
- Actualités économiques pour explorer les marchés financiers
Inscription
Se connecter
Si vous n'avez pas de compte, veuillez vous inscrire
Autorisez l'utilisation de cookies pour vous connecter au site Web MQL5.com.
Veuillez activer les paramètres nécessaires dans votre navigateur, sinon vous ne pourrez pas vous connecter.