MetaTrader 5용 기술 지표 - 34
Correlation Monitor 는 종목 간 관계를 빠르게 탐지하는 지표입니다 . 강한 양 / 음의 상관관계를 가진 페어를 찾고 , 다이버전스를 식별하며 , 헤지 · 페어 · 바스켓 트레이딩에서 보다 근거 있는 의사결정을 내리도록 돕습니다 . Meta traider 4. 주요 기능 • 상관관계 매트릭스와 컴팩트 리스트 : 선택한 심볼 간 관계의 강도를 즉시 보여 주며 , 색상 구분으로 가독성을 높입니다 . • 상관 심볼의 미니 차트 : 메인 차트의 가시 범위와 동기화되어 움직임을 직관적으로 비교할 수 있습니다 . • Top‑5 모드 : 가장 강한 양의 / 음의 관계를 강조 표시하여 빠르게 집중할 수 있습니다 . • 멀티 타임프레임 : 서로 다른 기간에서 평가하며 계산 창 ( 바 수 ) 을 설정할 수 있습니다 . • ‘ 시장 감시 (Market Watch)’ 의 모든 심볼을 지원하며 , 비표준 심볼도 가능합니다 . • 리소스 최적화 : 심볼 목록이 커도 불필요한 부하 없이 정교하게
FREE

Volume Profile Order Blocks - A smarter way to visualize liquidity, volume, and key levels. Volume Profile Order Blocks is a cutting-edge indicator that enhances traditional order block strategies by embedding a detailed volume profile directly within each zone. This provides traders with a clear, data-driven view of where institutional interest may lie — not just in price, but in volume distribution. MT4 Version - https://www.mql5.com/en/market/product/146267/ Join To Learn Market Depth - h

The Volume Spread Analysis indicator is based on the original Volume Spread Analysis method. It was designed for quick and easy recognition of VSA patterns. Even though this indicator looks very simple, it is the most sophisticated tool we've ever made. It is a really powerful analytical tool that generates very reliable trading signals. Because it is very user-friendly and understandable, it is suitable for every type of trader, regardless of his experience.
What is VSA? VSA - Volume Spread A

Sonic R Indicator Description Overview The Sonic R Indicator for MT5 is designed to help traders analyze market trends using moving averages and volume analysis. This tool assists in identifying potential price movements by displaying trend zones and volume strength, making it suitable for various trading strategies. Key Features Dual EMA Trend Channels – Uses 34-period Exponential Moving Averages (EMA) to visualize price movement. Volume Analysis – A color-coded histogram to indicate changes i

The Moving Average Slope (MAS) subtracts the moving average level n-periods ago from the current moving average level. This way, the trend of the moving average can be drawn on the moving average line.
Features Observe uptrends and downtrends at a glance. The indicator is non-repainting. Returns buffer values for the trend of the moving average to be used as part of an EA. (see below)
Inputs Moving Average Period : The period of the moving average (MA). Slope Period : Number of periods between
FREE

The true strength index is a technical indicator used in the analysis of financial markets that attempts to show both trend direction and overbought/oversold conditions. It was first published William Blau in 1991. The indicator uses moving averages of the underlying momentum of a financial instrument. The True Strength Index (TSI) is a momentum oscillator that ranges between limits of -100 and +100 and has a base value of 0.
FREE

Simple indicator to calculate fibonacci retracement levels on time. Add to chart and move trend line to set the fibonacci retracement levels. Inputs Levels - levels for which to calculate values, separated by space, default are fibonacci levels Show time - if true, time will be shown on levels Show date - if true, date will be shown on levels Show fibonacci level - if true, value of levels will be shown Fibonacci lines color - color of levels Trend line color - color of trend line which de
FREE

This indicator sums up the difference between the sells aggression and the buys aggression that occurred in each Candle, graphically plotting the waves of accumulation of the aggression volumes. Through these waves an exponential average is calculated that indicates the direction of the business flow.
Note: This indicator DOES NOT WORK for Brokers and/or Markets WITHOUT the type of aggression (BUY or SELL). Be sure to try our Professional version with configurable features and alerts: Agre
FREE
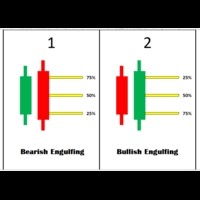
Engulfing Levels Indicator – Smart Entry Zones for High-Probability Trades Overview:
The Engulfing Levels Indicator is designed to help traders identify key price levels where potential reversals or trend continuations can occur. This powerful tool combines Engulfing Candle Patterns , Percentage-Based Levels (25%, 50%, 75%) , and Daily Bias Analysis to create high-probability trading zones . Key Features:
Engulfing Pattern Detection – Automatically identifies Bullish and Bearish Engulf
FREE

The multi-timeframe indicator of the levels of the Pivot Points. Every closed daily period has its own so-called reference point - Pivot Point, which sets the levels for smaller intraday timeframes for the following day. The Pivot Points indicators existing in the codes have no method of showing the dynamics of the pivot point changes on the historical data of the price chart. Pivot Point calculation formula. Pivot=(High + Low + Close) /3 High — the maximum of the previous day; Low — the minimum
FREE

。。。。。。。。。。。。。。。。。。。。。。。。。。。。。。。。。。。。。。。。。。。 This indicator is based on Bollinger Bands indicator. It helps user clearly know the Band is expand or contract.
The method of use is the same as the traditional Brin channel index. Users can use different color areas to distribute forest channel indicators in expansion or contraction stage. -------------------------------------------------------------------------------------------
FREE

BTMM Session StopHunt Reversal Reentry Indicator (Demo)
This is a fully functional demo version of the BTMM Session StopHunt Reversal Reentry Indicator for MetaTrader 5.
The demo allows traders to experience the complete indicator logic in real market conditions before purchasing the full version.
What the Demo Includes
Full session visualization (Asian, Brinks, New York) Automatic Asian range (High / Low) and range size (R) Stop-hunt (liquidity sweep) reversal detection Entry, Sto
FREE

Distance Price Moving Average
This is an indicator that calculates in real time the distance from the price to the moving average.
With it you can monitor the maximum deviation of the price from the moving average in a certain period of time chosen by you, for example, monitor the distance according to the maximum deviation of the last 30 days.
It is possible to choose the period and type of the moving average.
To make it even better, we have added the possibility of two alert levels if th
FREE

The Bolliger Bands On-Off let you control the indicator using the keyboard or a button . You can choose if you want the indicator always shown or always hided while switching among different time frames or financial instruments . ---> This indicator is part of Combo Indicator OnOff
The Bollinger Bands identify the degree of real-time volatility for a financial instruments . A lower amplitude corresponds to a low volatility, conversely a greater bandwidth corresponds to high volatility.
FREE

PGSindicator for MetaTrader 5 Free Companion Indicator for Profit Guard System Trade Panel. *** The attached video is the " PGS Trade Panel Tutorial Part 1 " *** (4m video) Adjust >>> **** EMA1 N-Pips Separation from EMA2
This setting defines the minimum distance required between EMA1 and EMA2 before a trend condition is considered valid.
The default value is 100.0 pips for NASDAQ 100, 1 minute CHART . Depending on how your broker calculates pip values, you may adjust this to 20.0 or 10.0
FREE

Индикатор Trade in trend предназначен для торговли по тренду. Сила тренда определяется шириной линии. Узкая линия - начало или конец тренда. Широкая линия свидетельствует о высокой силе тренда. Резкая смена ширины линии свидетельствует, с большой вероятностью, об окончании тенденции. Сигналы индикатора Не против покупки: переход с красной линии в белую цена отразилась от белой линии индикатора цена находится выше белой линии индикатора Не против продажи: переход с белой линии в красную цена отр
FREE

CDS SR Fractal Level: Dynamic Fractal Support & Resistance with Breakout Alerts Overview Tired of manually drawing and updating support and resistance lines? The CDS SR Fractal Level indicator automates this crucial process by intelligently identifying key market levels based on fractals. This lightweight and efficient tool allows you to focus on your trading strategy, not on chart setup, ensuring you never miss an important price level or a potential breakout. This indicator is clean, simple,
FREE

El Trend Detection Index (TDI) es un indicador técnico introducido por M. H. Pee. Se utiliza para detectar cuándo ha comenzado una tendencia y cuándo ha llegado a su fin. El TDI puede usarse como un indicador independiente o combinado con otros; se desempeñará bien en la detección del comienzo de las tendencias.
Los indicadores de tendencia son esenciales para detectar las tendencias de los mercados financieros. Estos indicadores ayudan a determinar la dirección que probablemente siga el activ
FREE
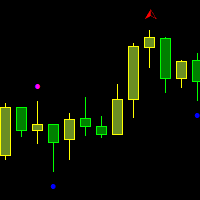
The indicator draws two types of Bill Williams' fractals: Broken fractals – the price has been at least once above or below these fractals. Unbroken fractals – new fractals where the price has not yet moved above or below them. You can configure the color of the fractals, as well as the number of bars used for the indicator's display.
фрактал Вильямса фрактал БВ фракталы Вильямса пробой фрактала пробитый фрактал Торговый хаос broken fractal unbroken fractal Williams fractal Trading Haos Bi
FREE
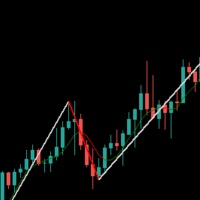
MagZag ( Beta) — A Trend- Based Reinvention of the ZigZag MagZag is a complete remodel of the traditional ZigZag indicator, built on trend- based logic instead of reactive price confirmation. Unlike a traditional ZigZag that works off of price action and relies on future bars to confirm a swing, MagZag calculates new legs immediately — with no forward correction , no lag , and no repainting . Once a leg is drawn, it's final. MagZag includes parameters for deviation and backstep, but it does no
FREE

Orderflow Smart Flip ( DEMO version,modleling must choose " Every tick based on real ticks") — Insight into Institutional Footprints, Capturing Reversals, Making Every Line Data-Driven. Important notice: Before placing an order, please contact me first, and I will provide you with professional answers and services
Product Introduction Say Goodbye to Guesswork. Embrace the Data Truth. [The last two screenshots show scenarios where the OrderFlow Bubbles Pro indicator is used in combination.] Ord

Are you a trend surfer like us? Do you use Moving Averages too? Ever wanted the are between them to be painted? Yeah, we solved this problem with the Filled MAs indicator! It is very simple, just puts two fully customizable Moving Averages on chart and fill the space between them, changing the color as they intersect. Thanks to gmbraz for the version 1.1 idea. Any questions os suggestions please contact me! Enjoy!
This is a free indicator, but it took hours to develop. If you want to pay me a
FREE

MACD Histogram tracks the difference between the MACD line and the Signal line (which is the exponential moving average of the first line). For better visibility, when plotting the lines and the histogram in the same window, we scale up the histogram by a factor of 2. Furthermore, we use two separate plots for the histogram, which allows us to color-code the bars for upticks and downticks. The MACD Combo overlays MACD lines on MACD Histogram. Putting both plots in the same window enables you to

The indicator displays the delta and the cumulative delta based on the "Time & Sales" deals list data. In addition to the standard timeframes, the indicator displays data regarding the seconds timeframes (S5, S10, S15, S20, S30) to choose from. Using the rectangle, user can select an arbitrary area in the indicator subwindow to view the ratio of the volumes of deals of buyers and sellers within this area.
Indicator features:
The indicator works correctly only on those trading symbols for which
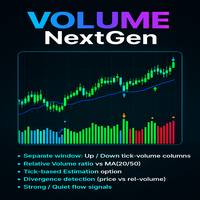
The Advanced Volume Flow Indicator is a free and practical tool who want to clearly see the balance between buying and selling pressure in the market. Instead of just showing total volume, this indicator separates volume into Up Volume (green bars) and Down Volume (red bars), making it easy to understand which side of the market is stronger at any moment.
The indicator also calculates a Relative Volume Line (blue), which shows whether the current trading activity is higher or lower than usual
FREE
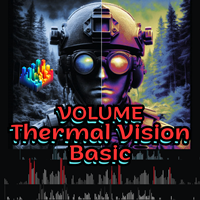
Volume Thermal Vision Basic은 널리 알려진 Volume Thermal Vision 지표의 간소화된 버전으로, 거래량 강도를 실용적이고 효율적으로 분석하려는 트레이더를 위해 설계되었습니다. 총 6가지 생생한 색상 수준을 제공하며, StealthMode, NightVision, FrostVision 모드를 통해 거래량 데이터를 명확하고 전략적으로 시각화할 수 있습니다. 이 인디케이터는 가볍고 직관적인 인터페이스로 초보자에게 이상적이며, 숙련된 트레이더의 분석 도구로도 매우 유용합니다. MQL5 Market에서 전체 버전으로 업그레이드하면, 고급 기능과 다양한 시각화 옵션을 통해 트레이딩 결정을 보다 효과적으로 내릴 수 있습니다. 거래 전략 최적화에 유용한 도구입니다.
FREE

Enhance your trading analysis with the Hull Suite MT5, a complete set of Hull Moving Average tools designed for smooth, low-lag trend visualization and enhanced precision. Developed from Alan Hull’s Hull Moving Average (HMA) concept introduced in 2005, this indicator integrates multiple Hull variations into a single flexible system, giving traders the ability to fine-tune responsiveness and visual style for clearer trend identification across forex, indices, commodities (like XAUUSD), and crypt
ZigZag Reversal Detector Signals This is a technical indicator based on the ZigZag principle, designed to automatically detect market reversal points and generate clear buy and sell signals. Customizable Parameters ️: Level : Determines the sensitivity of the ZigZag to price changes. Ecart : Sets the minimum distance between two ZigZag points. Rebond : Adjusts the confirmation threshold for a reversal. Alerts & Notifications : Enable or disable according to your needs. Pe
FREE
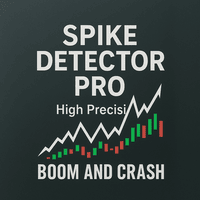
Spike Detector Pro - Advanced Fast Movement Detection System Introducing Spike Detector Pro, a professional tool developed for traders seeking opportunities in fast price movements. This exclusive indicator combines sophisticated technical analysis with multiple confirmation layers to identify high-probability setups. Main Features: Specialized algorithm for detecting price spikes in advance Multi-layer filtering system (momentum, volume, volatility, and price action) Optimized configuration for

This indicator is stand alone version from MP Pivot Levels (All in one) containing Woodie Pivots. Woodie’s pivot points are made up of multiple key levels, calculated from past price points, in order to frame trades in a simplistic manner. The key levels include the ‘pivot’ itself, and multiple support and resistance levels (usually up to three each). Traders use these levels as a guide for future price movements when setting up trades.
The pivot : (Previous high + previous low + 2 x previous
FREE

Limited Time Offer! Just $59 — valid until the end of this month! Trinity-X : The Next Generation of Trend Intelligence Imagine having a professional market analyst sitting beside you 24/7 — one who never gets tired, never misses a signal, and speaks your language.
That’s exactly what Trinity-X delivers. This AI-optimized, rule-based trend intelligence system is built on years of trading expertise, powered by a proprietary Rule-Based AI Optimization Engine .
It doesn’t just react to price movem

This tick indicator draws synthetic bars/candlesticks that contain a definite number of ticks. Parameters: option prices - price option. It can be Bid, Ask or (Ask+Bid)/2. the number of ticks to identify Bar - number of ticks that form OHLC. price levels count - number of displayed price levels (no levels are displayed if set to 0 or a lower value). calculated bar - number of bars on the chart. Buffer indexes: 0 - OPEN, 1 - HIGH, 2 - LOW, 3 - CLOSE.
FREE

Simple Horizontal Bollinger Bands with Squeeze Alert (HLINE BB Pro) Description This indicator draws horizontal Bollinger Band lines (Upper, Middle, and Lower) directly on the chart and updates them dynamically in real-time.
It provides a clear visual representation of market volatility, and helps traders easily identify potential breakout zones when the market transitions from low volatility (squeeze) to high volatility (expansion). The indicator is designed to be lightweight , visually simple
FREE
The ATR (Average True Range) Indicator is a powerful tool designed to measure market volatility. This indicator provides accurate data on price movement ranges, helping traders manage risk more effectively and make well-informed trading decisions. Based on the widely-used ATR indicator, it’s suitable for both professional and beginner traders to analyze market volatility. The ATR Indicator allows you to track the current price movement range and use this information to set stop-losses, select en
FREE

Free version of the TickScalper indicator. The Tick Scalp indicator is a trading assistant for a scalping trader. Works in a separate window. Tracks the momentary activity of the market, shows the graph of the movement of ticks and the strength of bulls or bears. Sometimes it can anticipate the beginning of a strong movement before any other indicators. Helps the trader to make a decision to open the desired order. Designed to work on any instrument. Used timeframes from M1 to M15. Has simple a
FREE

The "Standardize" indicator is a technical analysis tool designed to standardize and smooth price or volume data to highlight significant patterns and reduce market noise, making it easier to interpret and analyze.
Description & Functionality: Standardization : The indicator standardizes price or volume values by subtracting the mean and dividing by the standard deviation. This converts the data into a distribution with zero mean and standard deviation of one, allowing different data sets t
FREE

DaySpread MinMax — spread indicator with daily Min/Max What it shows: Current spread (Cur) Minimum spread for the current day (Min.day) Maximum spread for the current day (Max.day) How it works: Every 1 second the indicator reads Bid/Ask for the current symbol. Current spread is calculated as (Ask − Bid) / Point (in points). Min.day/Max.day are tracked during the day and reset when a new trading day starts (D1). The values are displayed on the chart as a compact text panel. You can drag the pan
FREE

This indicator is a volume indicator it changes the color of the candles according to a certain number of ticks, and this number of ticks can be informed by the user both the number of ticks and the color of the candles, this indicator works in any graphical time or any asset, provided that the asset has a ticker number to be informed.
This indicator seeks to facilitate user viewing when analyzing candles with a certain number of ticks.
FREE

Candle com coloração de Volume Price Analysis (VPA) segundo as definições da Anna Coulling, é possível configurar períodos de climax e rising, fator de extreme e fator de rising.
Pode-se usar volume real ou volume de ticks. O VPA considera a variação de preço por volume do período, indicando se um movimento está recebendo ignição, está em seu climax ou se já não existe mais interesse.
FREE

You may find this indicator helpfull if you are following a session based strategy. The bars are colored according to the sessions. Everything is customisable.
Settings: + Asia Session: zime, color, high, low + London Session: zime, color, high, low + US Session: zime, color, high, low
Please feel free to comment if you wish a feature and/or give a review. Thanks.
FREE
This is a custom MACD (Moving Average Convergence Divergence) indicator designed for MetaTrader 5 (MT5) . It replicates the TradingView MACD version , ensuring consistency for traders familiar with that platform. The default MACD in MT5 has differences in its calculation and visualization compared to TradingView. This indicator provides an identical structure, allowing for accurate technical analysis across different platforms. Features TradingView-Style MACD – Matches the histogram, signal lin
FREE

MACD Scanner provides the multi symbols and multi-timeframes of MACD signals. It is useful for trader to find the trading idea quickly and easily. User-friendly, visually clean, colorful, and readable. Dynamic dashboard display that can be adjusted thru the external input settings. Total Timeframes and Total symbols as well as the desired total rows/panel, so it can maximize the efficiency of using the chart space. The Highlight Stars on the certain matrix boxes line based on the selected Scan M

!!!This Free Version just works on EURUSD!!! Wa Previous Candle Levels MT5 shows the previous candle levels, it shows the previous candle Open High Low Close levels (OHLC Levels) in different time frame. It's designed to help the trader to analyse the market and pay attention to the previous candle levels in different time frame. We all know that the OHLC Levels in Monthly, Weekly and Daily are really strong and must of the time, the price strongly reacts at those levels. In the technical anal
FREE
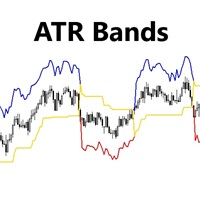
Indicator Shows ATR bands and Trailing Stop Line. Use it in your trend following strategy to improve your stop loss trailing and Trend. Adjust ATR Period and ATR Factor for your Symbol. This indicator has 3 outputs: 0- Upper Channel Data 1- Lower Channel Data 2- Main Line Data Please call me if you need more input parameters or modified version of this indicator.
FREE
Session Bias This Strategy of bias useful for those who follow TRADESHARE on youtube. This script is designed by BokaroTraderFx for traders who want assistance in determining their session bias, particularly for those who trade within sessions typically represented by a single 4-hour candle. The method involves using price action to establish a daily bias, guiding decisions on whether to focus on buys, sells, or both. The analysis is based on the previous daily and 4-hour candle closes, fo
FREE

The "Trend Fishing Indicator" is a powerful custom indicator designed to help traders identify potential trend reversal points and capitalize on market momentum. This indicator uses multiple moving averages of varying periods to evaluate short-term and long-term market trends. By comparing the short-term moving averages against the long-term ones, it generates clear buy and sell signals that can guide traders in making informed trading decisions. Key Features: Multiple Moving Averages : Incorpor
FREE

All-In-One Supertrend Indicator for MT5 A comprehensive multi-source trend-following system that combines 20 different data sources with customizable Supertrend calculations to deliver robust trend analysis and trading signals. ======================================================================================== Key Features Multi-Source Architecture 20 diverse data sources working in perfect harmony Fully customizable parameters for each individual source Non-repainting signals with lightnin

This tool is useful for indicating resistance and support levels It bases on zone in setting to identify top/bottom of candles and and draw rectangle according to those resistance/support level Beside user can edit the zone via dialog on specific timeframe and that value will be saved and loaded automatically. User can determine what strong resistance and support and make the order reasonably.
FREE

Ideal for scalpers, day traders and swing trades. Automatically identifies key support and resistance levels based on historical price data. It displays real-time trading zones and a precise countdown timer for each candle, helping traders make faster and more confident decisions. Fully customizable for multiple timeframes and instruments. The indicator analyzes historical price data to draw horizontal levels that represent key trading areas. It also displays, in real time, the current zone whe
FREE

You probably heard about Candlesticks behaviors, which in most of the times could denote and trace Volume behaviors even if you are not watching Volume itself... Well, this indicator will do this. Naked traders love to rely solely on candlesticks patterns and with Candle Zones you can trap special patterns and DRAW THEM on your chart. As simple as that. There are several filters you can tweak in order to achieve the analysis you want. Just give it a try. After several months of testing, we think
FREE
Dynamic Swing Anchored Bollinger Bands (Swing Point Based) Overview Dynamic Swing Anchored Bollinger Bands is a technical analysis tool that combines swing point price structure with Bollinger Bands to create a flexible, adaptive average price zone. Instead of relying on VWAP (volume-weighted average price), this indicator anchors the calculation at Swing High/Low points and uses re-initialized Bollinger Bands that adapt to current market volatility, providing highly relevant support/resistance
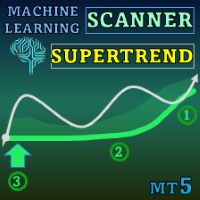
Special offer : ALL TOOLS , just $35 each! New tools will be $30 for the first week or the first 3 purchases ! Trading Tools Channel on MQL5 : Join my MQL5 channel to update the latest news from me 시장 변화에 원활하게 적응하도록 설계된 첨단 지표 Machine Learning Adaptive SuperTrend 로 고급 머신러닝의 강력한 기능을 활용해 보세요. k-평균 군집화를 SuperTrend 방법론과 결합하여, 이 지표는 정확한 트렌드 식별과 변동성 평가를 가능하게 하며, 역동적인 시장에서 트레이더에게 소중한 이점을 제공합니다. MT4 버전 더 보기: Machine Learning Adaptive SuperTrend MT4 다른 제품 보기: 모든 제품 머신러닝과 적응형 SuperTrend의
Professional VWAP Trading System with Advanced Signal Detection Transform your trading with the most comprehensive VWAP indicator available for MetaTrader 5. Magic VWAP Key Levels Pro combines multiple timeframe analysis, intelligent signal detection, and professional-grade visualization to give you the edge in modern markets. CORE FEATURES: Multi-Timeframe VWAP Analysis Session, Weekly, and Monthly VWAP calculations Previous 10-day VWAP support/resistance Dynamic anchor periods (Session/Week/Mo

This indicator uses a different approach from the previous version to get it's trendlines. This method is derived from Orchard Forex, and the process of making the indicator is demonstrated in there video https://www.youtube.com/watch?v=mEaiurw56wY&t=1425s .
The basic idea behind this indicator is it draws a tangent line on the highest levels and lowest levels of the bars used for calculation, while ensuring that the lines don't intersect with the bars in review (alittle confusing? I know
FREE

Moving Average Color
Moving Average (MA) is a trend indicator, which is a curved line that is calculated based on price changes. Accordingly, the moving average is the trader’s assistant, which confirms the trend. On the chart it looks like a bending line that repeats the price movement, but more smoothly. Moving Average Color it is a standard moving average indicator with a color change when the trend direction changes. The ability to set additional levels has also been added. It is a handy too
FREE
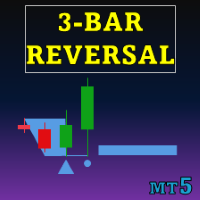
Special offer : ALL TOOLS , just $35 each! New tools will be $30 for the first week or the first 3 purchases ! Trading Tools Channel on MQL5 : Join my MQL5 channel to update the latest news from me 삼중 반전 패턴 지표 는 트레이더들에게 강력한 도구를 제공하여 가격 차트에 삼중 반전 패턴을 자동으로 식별하고 강조 표시합니다. 이 지표는 잠재적인 트렌드 반전을 탐지하는 데 유용하며, 통합된 트렌드 지표를 통해 신호 정확도를 향상시킬 수 있습니다. MT4 버전 보기: Three Bar Reversal Pattern MT4 다른 제품 보기: 모든 제품 주요 특징 자동 패턴 감지: 이 지표는 삼중 반전 패턴을 스캔하며, 명확한 시각적 신호로 표시하여 잠재적인 트렌드 반전 포인트를 인식하는 데 도움을 줍니다.

지표는 강세와 약세 다이버전스를 보여줍니다. 지표 자체는 (일반 확률론과 마찬가지로) 하위 창에 표시됩니다. 그래픽 인터페이스 : 메인 창에서 그래픽 개체 "추세선"이 생성됩니다. 즉, "낮은" 가격에서 "낮은" 가격(강세 다이버전스의 경우)으로 생성되고 "고가"에서 "고가" 가격(약세 다이버전스의 경우)으로 생성됩니다. ). 표시기는 그래픽 버퍼("메인", "신호", "점", "매수" 및 "판매")만을 사용하여 창을 그립니다. "매수" 및 "판매" 버퍼는 차이를 표시합니다. 이는 실제 표시기 버퍼이므로 모두 EA에서 읽을 수 있습니다. 도트 버퍼는 발산점을 보다 명확하게 시각화하는 데 사용됩니다. 옵션 : "엄격한 신호" - 이 매개변수를 "true"로 설정하면 강세 다이버전스는 "main" <= "Value Level #1"(기본값은 '25') 값에 대해서만 발생하고 약세 다이버전스는 "main" > = "Value Level #2" 값에만 적용됩니다(기본값은 '75')

지시자 "지지" 및 "저항" 선을 표시합니다(이 선은 DRAW_LINE 그리기 스타일을 사용하여 그려집니다. 즉, 그래픽 개체가 아닙니다). 새로운 최소값과 최대값에 대한 검색은 "신호 막대"의 왼쪽과 오른쪽에서 수행됩니다. "신호 막대"는 각 새 구성의 일반적인 중간입니다. 지표 이름에 유연성이라는 단어가 포함된 이유는 무엇입니까? "신호 막대"의 왼쪽('왼쪽 막대')과 오른쪽('오른쪽 막대')에 서로 다른 막대 수를 지정할 수 있기 때문입니다. 표시선은 차트의 "신호 막대"에서 '오른쪽 막대' 막대의 오른쪽으로 그려집니다. 특징 : 표시기를 더욱 아름답게 표시하기 위해 두 개의 "지원" 버퍼와 두 개의 "저항" 버퍼가 사용됩니다(이 기술 솔루션은 MQL5의 그리기 스타일 제한과 관련이 있습니다). 미래에 나타날 수 있는 것 : 소리 경고 또는 (및) 새로운 표시기 버퍼(화살표). 표시기를 사용하는 방법 : 이 지표는 주로 수동 거래를 위해 생성되었으므로 사용
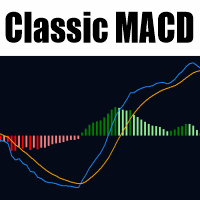
MetaTrader 5용 클래식 MACD 이 지표는 Gerald Appel이 원래 설계한 클래식 이동 평균 수렴 발산(MACD)의 충실한 구현을 제공하며, MetaTrader 5에 특화되어 있습니다. MACD 선, 신호 선, 히스토그램의 핵심 구성 요소를 통해 트레이더가 시장 추세, 모멘텀 변화, 잠재적 반전 지점을 식별할 수 있도록 합니다. MACD 선은 두 지수 이동 평균(일반적으로 12주기와 26주기) 간의 차이로 계산되며, 가격 모멘텀의 민감한 측정을 제공합니다. 신호 선은 MACD 자체의 9주기 EMA로, 변동성을 완화하여 교차를 통해 매수/매도 신호를 생성합니다. 한편, 다색 히스토그램은 MACD와 신호 선 간의 격차를 시각적으로 나타내어 추세의 강화 또는 약화를 한눈에 파악하기 쉽게 합니다. 주요 이점은 다음과 같습니다: 강세/약세 교차의 신뢰할 수 있는 탐지로 진입/퇴장 타이밍. 가격 행동과 MACD 간의 다이버전스 분석으로 반전 발견. 제로 선 위치로 전체 시장 바이

RSI / TDI 알림 대시보드를 사용하면 거래하는 모든 주요 쌍에서 RSI를 한 번에(귀하가 선택 가능) 모니터링할 수 있습니다.
두 가지 방법으로 사용할 수 있습니다.
1. 여러 시간 프레임을 선택하면 일반적인 거래 조건을 넘어 확장된 여러 시간 프레임이 있을 때 대시가 표시됩니다. 가격이 여러 기간에 걸쳐 과매수 또는 과매도 수준에 도달하여 최근에 가격이 크게 밀리고 있으므로 곧 철회 또는 반전이 예정되어 있음을 나타내는 훌륭한 지표입니다.
2. 하나의 기간(당신이 가장 선호하는 거래)과 여러 RSI 수준을 사용하여 해당 기간에 RSI 확장의 강도를 보여줍니다. 이것은 가격이 너무 오랫동안 한 방향으로 매우 세게 밀렸고 시장이 차익실현을 해야 할 때 평균 회귀 거래를 취하기 위한 훌륭한 전략입니다. 예시 스크린샷에서 H4 RSI가 25레벨을 넘어 2쌍으로 확장된 것을 볼 수 있습니다. 이는 일반적인 가격 조치보다 훨씬 더 멀리 있기 때문에 매수할 좋은 기회입니다.
대

ADR 경보 대시보드는 가격이 일반적인 일일 평균 범위와 관련하여 현재 거래되고 있는 위치를 한 눈에 보여줍니다. 가격이 평균 범위를 초과하고 선택한 수준보다 높을 때 팝업, 이메일 또는 푸시를 통해 즉각적인 알림을 받을 수 있으므로 신속하게 철회 및 반전에 뛰어들 수 있습니다. 대시는 빈 차트에 배치되도록 설계되었으며 배경에 앉아서 레벨에 도달하면 경고하므로 앉아서 보거나 전혀 볼 필요가 없습니다!
MT4 버전은 여기에서 사용 가능: https://www.mql5.com/en/market/product/62756
새로운 기능: 이제 평균 WEEKLY 및 MONTHLY 범위와 경고도 표시됩니다!
여기에서 차트의 수준을 나타내는 ADR 반전 표시기를 얻으십시오. https://www.mql5.com/en/market/product/64477
시간의 약 60%는 가격이 정상적인 일일 평균 범위(ADR) 내에서 거래되고 이 수준 이상으로 상승하면 일반적으로 급격한 가격 변동의 지

MT5용 혁신적인 지표인 Auto Trendline을 소개합니다. 이 지표는 추세선 생성 과정을 자동화합니다.
차트에 추세선을 그리는 번거롭고 시간 소모적인 작업을 이제 그만하세요.
Auto Trendline이 모든 작업을 대신해 드립니다!
*구매 후 연락 주시면 사용 설명서와 단계별 가이드를 보내드리겠습니다. Auto Trendline은 고급 알고리즘을 통해 추세선을 자동으로 감지하고 그려줍니다.
시간과 노력을 절약해 드립니다. 차트에 지표를 추가하기만 하면 가격 변동의 고점과 저점을 기반으로 추세선을 자동으로 식별하고 그려줍니다. Auto Trendline은 고도의 맞춤 설정이 가능하여 거래 스타일과 선호도에 맞게 지표의 민감도를 조정할 수 있습니다.
또한 다양한 선 스타일과 색상을 선택할 수 있으며, 추세선이 깨질 때 알림을 받도록 설정할 수도 있습니다. 초보 트레이더든 숙련된 트레이더든, Auto Trendline은 모든 시장의 추세를 파악하고 분석하는 데 필수적인 도구입

Magic Moving MT5 는 MetaTrader 5 터미널용 전문 지표입니다.
이동평균과 달리 Magic Moving은 더 정확한 신호를 제공하며 장기적인 추세를 파악하는 데 효과적입니다.
지표에서 알림(알림, 이메일, 푸시 알림)을 설정할 수 있어 중요한 거래 신호를 놓치지 않습니다.
MetaTrader 4 버전은 다음 링크에서 다운로드할 수 있습니다: https://www.mql5.com/ko/market/product/26544
지표의 장점 스캘핑에 최적입니다. 오류 신호 발생률이 매우 낮습니다. 초보자부터 숙련된 트레이더까지 모두에게 적합합니다. 모든 시간대에서 사용 가능합니다. 모든 금융 상품(FOREX, CFD, 바이너리 옵션)에 사용 가능합니다. 지표가 다시 그려지지 않습니다. 이메일 및 모바일 기기로 신호를 전송합니다. 추천 심볼 EUR/USD, GBP/USD, AUD/USD, USD/CAD, GOLD.
사용 권장 사항 가격이 지표선을 상향 돌파할 때

Displays a USD DXY chart in a seperate window below the main chart. YOUR BROKER MUST HAVE THESE SYMBOLS FOR THE INDICATOR TO WORK Based on EUR/USD, USD/JPY, GBP/USD, USD/CAD, USD/CHF and USD/SEK All these pairs must be added to Market Watch for the indicator to work correctly As this is calculated using a formula based on the 6 pairs it will only work when the market is open.
YOUR BROKER MUST HAVE THESE SYMBOLS FOR THE INDICATOR TO WORK
Displays a USD DXY chart in a seperate window below the m
FREE

This MetaTrader 5 indicator plots ICT Killzone session markers on the chart using vertical lines . It draws the start and end times for three institutional trading sessions— Asian , London , and New York —for a user-defined number of recent historical days. No buffers or plots are used; instead, the indicator relies entirely on chart objects (OBJ_VLINE) .
1. Inputs and Parameters The indicator allows full customization of each killzone segment: General DaysToDisplay : number of past days to dra
FREE

Tom DeMark developed TD Sequential by hand, through a process of trial and error, in the 1970s. It never ceases to amaze me how something originally created to analyze daily price data can be applied so effectively, more than thirty years later, to any time frame—from one minute to one year—and to any market. The indicator has two components: TD Setup, which relies on momentum to define price ranges, and TD Countdown, which is trend based, and looks for low-risk opportunities to fade establishe

이 제품은 표시기/신호 도구로부터 정보를 수신하고 특정 조건이 충족되면 화살표 또는 알림을 표시합니다.
예를 들어, MA25와 MA50이 교차할 때, SAR이 반전할 때, MACD가 플러스/마이너스를 변경하거나 종가가 볼린저 밴드를 교차할 때 화살표와 알림이 표시됩니다.
구체적인 구성은 샘플 설정 이미지를 참조하세요.
자세한 매뉴얼 및 구성 파일은 다음을 참조하세요.
https://www.mql5.com/en/blogs/post/755082
무료 버전도 다운로드할 수 있습니다.
화살표는 다양한 구성으로 표시될 수 있으며 조합은 상상만큼 무한합니다.
신호 도구 및 표시기에 대한 연결을 설정하는 데 문제가 있는 경우 당사에 문의하여 도움을 받으십시오.
또한 요청 시 스마트폰, 이메일, Slack, Line, Discord 등에 알림을 푸시하고, 최대 8개의 매개변수를 추가하거나 개별 지표에 연결할 수 있습니다. 신호 도구를 보완하거나 이벤트 알림 기능으로 사용할 수
FREE

A very useful Price Action point is the previous day Closing VWAP. We call it Big Players Last Fight . This indicator will draw a line showing on your chart what was the last VWAP price of the previous trading session. Simple and effective. As an additional bonus, this indicator saves the VWAP value on the Public Terminal Variables, so you EA could read easily its value! Just for the "Prefix + Symbol name" on the variables list and you will see!
SETTINGS How many past days back do you want to s
FREE

Multi Kernel Regression Indicator (FREE & PREMIUM)
SPECIAL OFFER Full version is available in the market under "Daily Zone Pro" Market Link: https://www.mql5.com/en/market/product/157609?source=Site +Market+My+Products+Page
What This Indicator Does The Multi Kernel Regression (MKR) indicator uses advanced statistical kernel functions to create smooth, adaptive moving averages that respond intelligently to market conditions. Unlike traditional moving averages, MKR applies different kernel
FREE
"While our free indicators provide a solid foundation, our paid products offer advanced neural filtering and automated risk management features that help you scale your trading consistency. Upgrade your edge today by visiting our specialized catalog for professional-grade EAs and indicators."
What is this indicator? This Basic Support and Resistance Indicator -Free- is designed to help traders automatically identify key market levels, such as supports and resistances, across multiple symbols
FREE
MetaTrader 마켓은 거래로봇과 기술지표를 판매하기에 최적의 장소입니다.
오직 어플리케이션만 개발하면 됩니다. 수백만 명의 MetaTrader 사용자에게 제품을 제공하기 위해 마켓에 제품을 게시하는 방법에 대해 설명해 드리겠습니다.
트레이딩 기회를 놓치고 있어요:
- 무료 트레이딩 앱
- 복사용 8,000 이상의 시그널
- 금융 시장 개척을 위한 경제 뉴스
등록
로그인
계정이 없으시면, 가입하십시오
MQL5.com 웹사이트에 로그인을 하기 위해 쿠키를 허용하십시오.
브라우저에서 필요한 설정을 활성화하시지 않으면, 로그인할 수 없습니다.