YouTubeにあるマーケットチュートリアルビデオをご覧ください
ロボットや指標を購入する
仮想ホスティングで
EAを実行
EAを実行
ロボットや指標を購入前にテストする
マーケットで収入を得る
販売のためにプロダクトをプレゼンテーションする方法
MetaTrader 5のためのテクニカル指標 - 34
Spike Detector Pro - Advanced Fast Movement Detection System Introducing Spike Detector Pro, a professional tool developed for traders seeking opportunities in fast price movements. This exclusive indicator combines sophisticated technical analysis with multiple confirmation layers to identify high-probability setups. Main Features: Specialized algorithm for detecting price spikes in advance Multi-layer filtering system (momentum, volume, volatility, and price action) Optimized configuration for

Signal provider based on RSI Divergences
from a higher timeframe.
First 3 buffers export a signal.
Timeframe for which divergences are detected is optional, see
'RSI divergences timeframe' parameter.
The indicator uses different algorithms for divergences detection:
'Fast' algorithm is the simplest solution that works the fastest.
'Strict' algorithm filters out more noise but works slower than the previous one.
'Full' algorithm uses recursive functions and provides with lots of divergences
FREE

I present the well-known Moving Average indicator connected to the ATR indicator.
This indicator is presented as a channel, where the upper and lower lines are equidistant from the main line by the value of the ATR indicator.
The indicator is easy to use. The basic settings of the moving average have been saved, plus the settings for the ATR have been added.
Moving Average Parameters:
MA period Shift MA Method
Moving Average Parameters:
ATR TF - from which timeframe the values are taken A
FREE

The "Standardize" indicator is a technical analysis tool designed to standardize and smooth price or volume data to highlight significant patterns and reduce market noise, making it easier to interpret and analyze.
Description & Functionality: Standardization : The indicator standardizes price or volume values by subtracting the mean and dividing by the standard deviation. This converts the data into a distribution with zero mean and standard deviation of one, allowing different data sets t
FREE

Indicator measures strength of each currency in your list.
Main idea: It simply iterates through all combinations of pairs and adds difference between open and close in percent. Parameters: List of currencies - what currencies will be calculated (maximum is 8) Calculation type - from which data will be strength calculated Calculation data input - used as input related to calculation type Symbol suffix - used in case of suffix on symbols, e.g: when your symbols look like EURUSDm, EURUSDmicro etc
FREE

Limited Time Offer! Just $59 — valid until the end of this month! Trinity-X : The Next Generation of Trend Intelligence Imagine having a professional market analyst sitting beside you 24/7 — one who never gets tired, never misses a signal, and speaks your language.
That’s exactly what Trinity-X delivers. This AI-optimized, rule-based trend intelligence system is built on years of trading expertise, powered by a proprietary Rule-Based AI Optimization Engine .
It doesn’t just react to price movem

The name Aroon means “ Dawn's Early Light ” in Sanskrit. His creator Tushar Chande chose this name because the indicator is designed to catch the beginning of a new trend. At first sight it seems a little confusing all those jagged lines but after you understand the basics of it, you will find this indicator pretty cool and use it in a variety of ways, i.e.: Trigger, Trend Filtering System, and so on. The Aroon indicator was created in 1995 so it is a "modern" indicator compared to the Jurassic
FREE

This indicator is a volume indicator it changes the color of the candles according to a certain number of ticks, and this number of ticks can be informed by the user both the number of ticks and the color of the candles, this indicator works in any graphical time or any asset, provided that the asset has a ticker number to be informed.
This indicator seeks to facilitate user viewing when analyzing candles with a certain number of ticks.
FREE

Moving Average 4 TimeFrames
Display 4 moving averages of 4 different timeframes on the same chart. In order not to pollute the chart, the indicator will plot the complete average only in the current timeframe of one of the 4 registered averages, for the other timeframes of registered averages the indicator only displays a part of the average so that you know where it is at that time graphic.
Example:
Display on the 5-minute chart where the 200-period arithmetic moving average of the 5 minute
FREE

The Volunacci indicator is a custom technical analysis tool designed for MetaTrader 5. It combines volume analysis with Fibonacci retracement principles. In essence, it displays the current volume as a colored histogram within its own window. The unique feature is that it calculates a recent volume range (high and low over a user-defined period) and then projects key Fibonacci retracement levels (23.6%, 38.2%, 50%, 61.8%, 100%) onto this range. The color of the volume histogram changes dynam
FREE

Certainly! Let me introduce you to a powerful tool for MetaTrader 5 (MT5) that can automatically identify and draw support and resistance (S&R) levels on your trading charts. This tool is called the “Support and Resistance Levels Guru” . Support Resistance Levels Guru The Support & Resistance Indicator automatically displays essential S&R levels on your chart. These levels are crucial for technical analysis and are used by many traders. Resistance levels (zones) are shown in R ed , while suppo
FREE
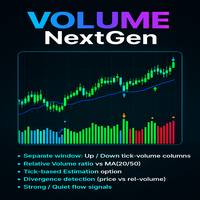
The Advanced Volume Flow Indicator is a free and practical tool who want to clearly see the balance between buying and selling pressure in the market. Instead of just showing total volume, this indicator separates volume into Up Volume (green bars) and Down Volume (red bars), making it easy to understand which side of the market is stronger at any moment.
The indicator also calculates a Relative Volume Line (blue), which shows whether the current trading activity is higher or lower than usual
FREE
A comprehensive MT5 trading performance indicator designed to provide real-time analytics of your trading activity on chart.
Key Features: - Dual tracking modes: Chart Symbol or Magic Numbers - Customizable display with toggle options for each metric - Adjustable font size for better visibility - Real-time updates with color-coded results
Performance Metrics: - Total Profit/Loss: Track overall performance - Total Trades: Monitor trading frequency - Win Rate: Measure trading success percentage
FREE

MACD Scanner provides the multi symbols and multi-timeframes of MACD signals. It is useful for trader to find the trading idea quickly and easily. User-friendly, visually clean, colorful, and readable. Dynamic dashboard display that can be adjusted thru the external input settings. Total Timeframes and Total symbols as well as the desired total rows/panel, so it can maximize the efficiency of using the chart space. The Highlight Stars on the certain matrix boxes line based on the selected Scan M

Stonehill Forexでは、2025年3月にStonehill Forexのウェブサイトで紹介した、初の自社開発インジケーターを公開します。オリジナルバージョンはMetaTrader 4 (MT4) 用に開発され、その後、コミュニティの関心の高さを踏まえてMT5とTradingView向けにも開発されました。このインジケーターは無料で提供され、私たちのライブラリーの第一弾となります。
これは2本の線でクロス価格を表示するオーバーレイで、2本の加重移動平均線を非常に洗練されたフィルターに通して表示します。その結果、非常に正確なシグナルが読み出されます。3年間にわたってテストを行い、その結果はブログ(こちら)でご覧いただけます。さらに、使い方を説明したテクニカル分析ビデオもご用意しています。ビデオはブログに埋め込まれているので、分かりやすく便利です。
設定は2つあります。
StartLen:データの収集を開始する開始点。デフォルト値は2です。
「StartLen」の設定に関して、2つの注意点があります。
「StartLen」設定変数は0未満にしないでください。
「St
FREE

EMA SMA Gold Scalper is a precision scalping indicator developed for XAUUSD (Gold) traders. It combines the dynamic responsiveness of the 55 EMA (High/Low) with the broader market direction filter of the 200 SMA , delivering clean and actionable Buy/Sell signals. The indicator also includes real-time "Live Blue Arrows" , which notify traders when an entry setup is forming—giving you a critical edge before the candle closes. This tool is optimized and recommend for M5 scalping a
FREE

About the indicator: DALA Forecast is a universal tool for predicting the dynamics of time series of any nature. For prediction, modified methods of nonlinear dynamics analysis are used, on the basis of which a predictive model is built using machine learning methods. To get the trial version of the indicator, you can contact me in private messages.
How to use the indicator: Apply the indicator to your chosen financial instrument or indicator with the settings you need. The prediction will be
FREE

All-In-One Supertrend Indicator for MT5 A comprehensive multi-source trend-following system that combines 20 different data sources with customizable Supertrend calculations to deliver robust trend analysis and trading signals. ======================================================================================== Key Features Multi-Source Architecture 20 diverse data sources working in perfect harmony Fully customizable parameters for each individual source Non-repainting signals with lightnin
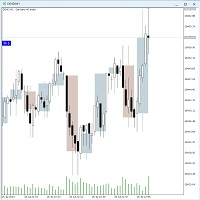
The Twotimeframe-Candles (RFrame) - Indicator for MT5 shows the candles of an higher, timeframe as an overlay on the current timeframe. You can choose the number of candles and color of the overlays. The indicator calculates the candle evevery tick. If you like the indicator, please left a comment. Version 1.1: The second time frame can now be set.
Keywords:
Candlestick, Multitimefram, Two Timeframes,
FREE
Dynamic Swing Anchored Bollinger Bands (Swing Point Based) Overview Dynamic Swing Anchored Bollinger Bands is a technical analysis tool that combines swing point price structure with Bollinger Bands to create a flexible, adaptive average price zone. Instead of relying on VWAP (volume-weighted average price), this indicator anchors the calculation at Swing High/Low points and uses re-initialized Bollinger Bands that adapt to current market volatility, providing highly relevant support/resistance
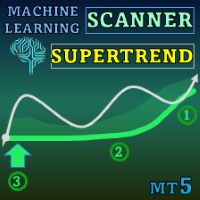
Special offer : ALL TOOLS , just $35 each! New tools will be $30 for the first week or the first 3 purchases ! Trading Tools Channel on MQL5 : Join my MQL5 channel to update the latest news from me Machine Learning Adaptive SuperTrend という先進的なインジケーターを使って、最新の機械学習の力を体験してください。このインジケーターは、変化する市場環境にシームレスに適応するように設計されています。k-meansクラスタリングをSuperTrendメソッドと組み合わせることで、精確なトレンドの識別とボラティリティの評価を実現し、トレーダーにダイナミックな市場での貴重な優位性を提供します。 MT4バージョンはこちら: Machine Learning Adaptive SuperTrend MT4 他の製品を見るには: 全製品

Professional VWAP Trading System with Advanced Signal Detection Transform your trading with the most comprehensive VWAP indicator available for MetaTrader 5. Magic VWAP Key Levels Pro combines multiple timeframe analysis, intelligent signal detection, and professional-grade visualization to give you the edge in modern markets. CORE FEATURES: Multi-Timeframe VWAP Analysis Session, Weekly, and Monthly VWAP calculations Previous 10-day VWAP support/resistance Dynamic anchor periods (Session/Week/Mo

I present the well-known Fractal indicator.
Levels have been added to this indicator.
At the extreme points, you can see the continuation of the price line, which changes when the values of the Fractal indicator change.
The indicator is easy to use. The basic Fractal settings have been saved.
FractalLevels Parameters:
LeftBars - the number of bars on the left
RightBars - the number of bars on the right
FREE

"Five Minute Drive" indicator that is designed to be used in the 5 minute timeframe only. One of its most important advantages is that it shows the general trend in the upper time frames when looking at the 5-minute timeframe. Therefore, when opening positions in the 5 minute timeframe, when it is in line with the trends in the upper timeframes, you are less likely to be upside down. If you can interpret the curvilinear and linear lines drawn by this indicator on the graphic screen with your geo
FREE

A very useful Price Action point is the previous day Closing VWAP. We call it Big Players Last Fight . This indicator will draw a line showing on your chart what was the last VWAP price of the previous trading session. Simple and effective. As an additional bonus, this indicator saves the VWAP value on the Public Terminal Variables, so you EA could read easily its value! Just for the "Prefix + Symbol name" on the variables list and you will see!
SETTINGS How many past days back do you want to s
FREE
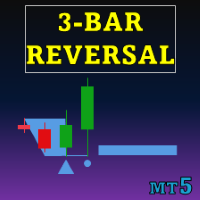
Special offer : ALL TOOLS , just $35 each! New tools will be $30 for the first week or the first 3 purchases ! Trading Tools Channel on MQL5 : Join my MQL5 channel to update the latest news from me スリーバーレバーサルパターンインジケーター は、トレーダーに強力なツールを提供し、価格チャート上で三本の反転パターンを自動的に識別して強調表示します。このインジケーターは、潜在的なトレンドの反転を検出するための貴重なリソースであり、統合されたトレンドインジケーターを通じて信号精度を向上させることができます。 MT4バージョンの詳細はこちら: Three Bar Reversal Pattern MT4 その他の製品はこちら: すべての製品 主な機能 パターンの自動検出: このインジケーターは、三本の反転パターンをスキャンし、視覚的に明確なシグナルで表示し、潜在的な

インジケーターは強気と弱気の乖離を示します。インジケーター自体(通常のストキャスティクスと同様)はサブウィンドウに表示されます。 グラフィカルインターフェイス : メインウィンドウでは、グラフィカルオブジェクト「トレンドライン」が作成されます。「安値」価格から「安値」価格まで(強気の発散の場合)、「高値」価格から「高」価格まで(弱気の発散の場合)生成されます。 )。このインジケーターは、グラフィック バッファー「メイン」、「シグナル」、「ドット」、「買い」、「売り」のみを使用してウィンドウに描画します。 「買い」バッファと「売り」バッファは発散を表示します。これらは実際の指標バッファであるため、EA からすべて読み取ることができます。 ドット バッファは、分岐点をより明確に視覚化するために使用されます。 オプション : 「厳密なシグナル」 - このパラメーターを「true」に設定すると、強気の発散は「メイン」 <= 「値レベル #1」 (デフォルトは '25') の値のみになり、弱気の発散は値は「main」> =「Value Level #2」のみになります(デフォルトは「75」です

インジケータ は、「サポート」ラインと「レジスタンス」ラインを示しています (これらのラインは DRAW_LINE 描画スタイルを使用して描画されます。つまり、グラフィック オブジェクトではありません)。 新しい最小値と最大値の検索は、「シグナル バー」の左右で実行されます。「シグナル バー」は、それぞれの新しい構造の従来の中央です。 インジケーターの名前に「フレキシブル」という言葉が入っているのはなぜですか? 「シグナルバー」の左側 (「左バー」) と右側 (「右バー」) に異なる数のバーを指定できるためです。 インジケーターラインは、チャート上の「シグナルバー」から右の「右バー」バーに描画されます。 特徴 : インジケーターの表示をより美しくするために、2 つの「サポート」バッファーと 2 つの「レジスタンス」バッファーが使用されます (この技術的解決策は、MQL5 の描画スタイルの制限に関連しています)。 将来登場する可能性のあるもの : サウンドアラートまたは(および)新しいインジケーターバッファー(矢印)。 インジケーターの使用方法 : このインジケーターは主に手動取引用
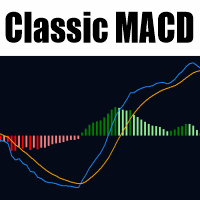
MetaTrader 5 用クラシック MACD このインジケーターは、Gerald Appel が元々設計したクラシックな移動平均収束拡散 (MACD) の忠実な実装を提供し、MetaTrader 5 に特化して調整されています。MACD ライン、シグナルライン、ヒストグラムのコアコンポーネントを通じて、トレーダーが市場トレンド、モメンタムのシフト、潜在的な反転ポイントを特定できるようにします。 MACD ラインは、2 つの指数移動平均 (通常 12 期間と 26 期間) の差として計算され、価格モメンタムの敏感な測定を提供します。シグナルラインは MACD 自体の 9 期間 EMA で、変動を滑らかにしてクロスオーバーによる買い/売りシグナルを生成します。一方、多色ヒストグラムは MACD とシグナルラインのギャップを視覚的に表し、トレンドの強化や弱体化を一目で発見しやすくします。 主な利点には以下が含まれます: 強気/弱気クロスオーバーの信頼できる検出で、エントリー/エグジットのタイミングを決定。 価格アクションと MACD のダイバージェンス分析で反転を検知。 ゼロラインの位置

RSI / TDIアラートダッシュボードを使用すると、取引するすべての主要ペアでRSIを一度に(ユーザーが選択可能に)監視できます。
次の2つの方法で使用できます。
1.複数の時間枠を選択すると、通常の取引条件を超えて延長された複数の時間枠がある場合にダッシュが表示されます。複数の時間枠にわたって買われ過ぎまたは売られ過ぎのレベルを達成したため、価格が最近激しく押し上げられたため、引き戻しまたは逆転が間もなく行われることを示す優れた指標です。
2. 1つの時間枠(トレードするのが好き)と複数のRSIレベルを使用して、その時間枠でのRSIの延長の強さを示します。これは、価格が一方向に非常に長く押し込まれ、市場が利益を得ることになっている場合に、平均回帰取引を行うための優れた戦略です。スクリーンショットの例では、H4 RSIが25レベルを超えて2ペアで拡張されていることがわかります。これは、通常の価格アクションよりもはるかに遠いため、長く行く良い機会です。
ダッシュボードは、選択した時間枠でろうそくが閉じたときに、選択したレベルでの延長された状態(買われ過ぎと売られ過ぎ)を警告

ADRアラートダッシュボードは、価格が通常の1日の平均範囲に関連して現在取引されている場所を一目で示します。価格が選択した平均範囲とレベルを超えると、ポップアップ、電子メール、またはプッシュを介して即座にアラートを受け取るため、プルバックと逆転にすばやくジャンプできます。ダッシュは空白のチャートに配置されるように設計されており、バックグラウンドに座ってレベルに達したときに警告を発するので、座って見たり、まったく見たりする必要はありません。
ここで利用可能なMT4バージョン:https:// www.mql5.com/en/market/product/62756
NEW:毎週と毎月の平均範囲とそれらへのアラートも表示されるようになりました!
ここでチャートのレベルを下げるADRリバースインジケーターを入手してください:https:// www.mql5.com/en/market/product/64477
通常の1日平均レンジ(ADR)内で価格が取引され、これらのレベルを上回っている時間の約60%は、通常、その後の引き戻し(利益確定)の動きを伴う急激な価格の動きの指標です。

革新的なMT5インジケーター「Auto Trendline」をご紹介します。
チャートにトレンドラインを描く。手動でトレンドラインを描くという面倒で時間のかかる作業とはお別れしましょう。
Auto Trendline に作業を任せましょう!
*購入後にご連絡いただければ 、手順とステップごとのガイドをお送りします。 高度なアルゴリズムにより、Auto Trendlineは自動的にトレンドラインを検出して描画します。
時間と労力を節約できます。インジケーターをチャートに添付するだけで、価格変動の高値と安値に基づいてトレンドラインが識別され、描画されるのを確認できます。 自動トレンドラインは高度にカスタマイズ可能で、トレーディング スタイルや好みに合わせてインジケーターの感度を調整できます。
さまざまな線のスタイルや色を選択したり、トレンドラインが破られたときに通知するアラートを設定したりすることもできます。 初心者でも経験豊富なトレーダーでも、Auto Trendline はあらゆる市場のトレンドを識別して分析するための必須ツールです。
ユーザーフレンドリーなインターフェースと高度な機能

This indicator will show a vertical representation of the volume distribution within a selected user range.
This is a free version of the full product. It is limited to use on a week old data or older. Find the full product at https://www.mql5.com/en/market/product/42234 .
Main features: This Indicator will create an image that will allow viewing the tick volume per price level in a graphical form. The indicator will work on any range size in any time-frame, limited only by your computer mem
FREE

Kindly rate and comment about the product for upgradation & Support
The 5 EMA is plotted in green color ( Lime ).
The 14 EMA is plotted in red color ( Red ).
The 20 EMA is plotted in blue color ( Blue ).
The 200 EMA is plotted in yellow color ( Yellow ).
The Quarter EMA that provided calculates and plots four Exponential Moving Averages (EMAs) on the chart using different periods: 5, 14, 20, and 200. Each EMA is represented by a different color on the chart. Here's a description of each EMA:
FREE

魔動MT5はプロの指標のMetaTrader5端子です。
移動平均とは異なり、Magic Movingはより良い信号を提供し、長期的な傾向を特定することができます。
インジケータでは、アラート(アラート、メール、プッシュ)を設定することができますので、単一の取引信号を見逃すことはありません。
インジケータの利点 スキャルピングに最適です。 最小の偽信号を生成します。 初心者や経験豊富なトレーダーに適しています。 すべての時間枠で動作します。 外国為替、CFD、バイナリオプション:任意の金融商品に取り組んでいます。 インジケータは再描画されません。 電子メールやモバイルデバイスへの信号の送信。
推奨シンボル EUR/USD、GBP/USD、AUD/USD、USD/CAD、ゴールド。
使用に関する推奨事項 開買い注文が価格を横切る指標線は上向きになるようにします。 価格が下向きのインジケータラインを横切るときにオープン売り注文。
パラメータ Period -値を増やすとインジケータが遅くなり、信号の品質が向上し、その数が減少します。 減価値は、より積極的なトレー

In which direction should I trade today? For “TREND followers”, we need to determine the TREND . This indicator determines the Trend based on the price High, Low and Close of every bar, for a given period and timeframe. Calculating and plotting the Trend UP and Trend DOWN lines. If the: “Trend UP” line (Green) is above the “Trend DOWN” line (Red), then it is a BULLISH Trend (see "Screenshots" tab). “Trend DOWN” line (Red) is above the “Trend UP” line (Green), then it is a BEARISH Trend (see "
FREE

Tom DeMark developed TD Sequential by hand, through a process of trial and error, in the 1970s. It never ceases to amaze me how something originally created to analyze daily price data can be applied so effectively, more than thirty years later, to any time frame—from one minute to one year—and to any market. The indicator has two components: TD Setup, which relies on momentum to define price ranges, and TD Countdown, which is trend based, and looks for low-risk opportunities to fade establishe
https://www.mql5.com/en/users/gedeegi/seller
GEN FXTrendZones GEN FXTrendZones is a technical analysis indicator designed to identify key price zones using Fibonacci retracement and extension levels, while also detecting market structure changes such as Break of Structure (BoS) and Change of Character (CHoCH). The indicator helps traders visualize critical swing areas and potential trend continuation or reversal zones. It includes a visual info panel and optional price alert system.
FREE

Description
The base of this indicator is an ZigZag algorithm based on ATR and Fibo retracement. This indicator is not redrawing in sense that the ZigZag's last shoulder is formed right after the appropriate conditions occur on the market. The shoulder doesn't change its direction afterwards (can only continue). Note: An indicator with advanced possibilities is also available.
Indicator input parameters
The input parameters allow to change the sensitivity of the ZigZag. ATR period ATR multip
FREE
Volume Flow Indicator (VFI) - User Manual 1. General Introduction The Volume Flow Indicator (VFI) is an advanced technical oscillator designed to measure the strength and sustainability of a price trend by incorporating both price and volume data. Developed based on the concepts of On-Balance Volume (OBV) but with significant improvements, the VFI provides deeper insight into money flow and the conviction behind price movements. This indicator is not an automated trading system but a powerful an
FREE

Resistance and Support is an easy to use indicator to apply horizontal lines of resistance and support. There are two windows for adding levels. When you press the button, a line appears on the price chart. It is possible to move this line with the mouse, thereby changing the indicator readings. In the indicator menu there is a choice of possible alerts - no alert, alert on touching the level and an alert for closing the candle after the level.
FREE

BTMM Session StopHunt Reversal Reentry Indicator (Demo)
This is a fully functional demo version of the BTMM Session StopHunt Reversal Reentry Indicator for MetaTrader 5.
The demo allows traders to experience the complete indicator logic in real market conditions before purchasing the full version.
What the Demo Includes
Full session visualization (Asian, Brinks, New York) Automatic Asian range (High / Low) and range size (R) Stop-hunt (liquidity sweep) reversal detection Entry, Sto
FREE

English
VWAP Daily (Clean) is a simple and lightweight indicator that plots the classic Daily VWAP (Volume Weighted Average Price) directly on your MT5 chart. Features: Classic Daily VWAP calculation Supports real volume (if available) or tick volume Timezone offset option to match your broker’s server time Weekend merge option (merge Saturday/Sunday data into Friday) Clean version → no arrows, no alerts, only VWAP line VWAP is widely used by institutional traders to identify fair value, su
FREE

The Magic LWMA indicator is of great help in determining trend direction. It can be an excellent addition to your existing strategy or the basis of a new one. We humans can make better decisions when we see better visually. So we designed it to show a different color for rising and falling trends. Everyone can customize this in the way that suits them best. By setting the Trend Period, we can optimize it for longer or shorter trends for our strategy. It is great for all time frames.
IF YOU NEE
FREE

You may find this indicator helpfull if you are following a session based strategy. The bars are colored according to the sessions. Everything is customisable.
Settings: + Asia Session: zime, color, high, low + London Session: zime, color, high, low + US Session: zime, color, high, low
Please feel free to comment if you wish a feature and/or give a review. Thanks.
FREE
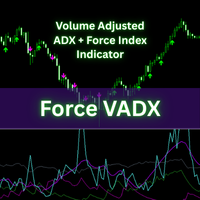
Force VADX Indicator Force VADX is an advanced, multi-factor indicator that fuses volume-adjusted trend strength, normalized force index, and adaptive directional signals. Designed for modern traders, it pinpoints high-confidence buy and sell zones, offering a robust technical foundation for both discretionary and automated trading.
Use this indicator in conjuntion with other tools for confirmation and confluene. This indicator is not intended to be a complete trading system but rather a tool
FREE

Apex Williams %R MT5 is a professional technical indicator that enhances the traditional Williams %R oscillator with advanced momentum analysis and multiple quality filters. Intelligent Signal System - Automatic buy/sell signal generation - Quality filters to reduce false signals - Clear visual indicators on chart
Advanced Divergence Analysis - Automatic divergence detection - Integrated price-oscillator analysis - Technical signal confirmation
Multiple Filter System - Trend and momentum filt
FREE

This indicator is based on the Bollinger Bands indicator. It helps the user identifying whether to buy or sell. It comes with an alert that will sound whenever a new signal appears. It also features an email facility. Your email address and SMTP Server settings should be specified in the settings window of the "Mailbox" tab in your MetaTrader 5. Blue arrow up = Buy. Red arrow down = Sell. Line = Trailing Stop. You can use one of my Trailing Stop products that automatically move the Stop Loss and
FREE
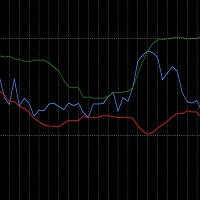
The RSI_BBands is a custom indicator designed to combine the Relative Strength Index (RSI) and Bollinger Bands (BB) for enhanced market analysis. It calculates the RSI using a specified period (default 14) and overlays Bollinger Bands around the RSI values, with adjustable parameters for the Bollinger Bands period and deviation. You can find more free products HERE . If you're looking for a low risk EA , check the Silent Pressure EA .
Key Features: RSI Calculation: The RSI is calcul
FREE

Tops & Bottoms Indicator FREE Tops abd Bottoms: An effective indicator for your trades
The tops and bottoms indicator helps you to find ascending and descending channel formations with indications of ascending and/or descending tops and bottoms. In addition, it show possibles opportunities with a small yellow circle when the indicator encounters an impulse formation.
This indicator provide to you more security and speed in making entry decisions. Also test our FREE advisor indicator:
FREE

Hidden Edge – High-Low PreUS High-Low PreUS is a clean and lightweight indicator that marks key reference levels before the US session begins.
It draws a session box from 00:01 to 09:00 CET, identifying the high and low of the Asian session, and includes additional reference elements to support structured intraday trading decisions. Features Draws a rectangular range from 00:01 to 09:00 CET Marks the high and low of the session clearly Plots a horizontal yellow line as a suggested stop level bas
FREE

If you love this indicator, please leave a positive rating and comment, it will be a source of motivation to help me create more products <3 Key Takeaways Generates buy and sell signals earlier than regular MA This indicator can detect a trend when it is just starting Filter : A special parameter that is useful for filtering out spikes without causing lag. However, like all indicators, it isn't foolproof, to avoid false signals, it's best to use the Dots indicator with other indicators. Te
FREE

The indicator highlights the points that a professional trader sees in ordinary indicators. VisualVol visually displays different volatility indicators on a single scale and a common align. Highlights the excess of volume indicators in color. At the same time, Tick and Real Volume, Actual range, ATR, candle size and return (open-close difference) can be displayed. Thanks to VisualVol, you will see the market periods and the right time for different trading operations. This version is intended f
FREE

The indicator shows separate breakeven levels for short, long, and total positions. It takes into account all current expenses: swap, spread, and commissions (including those incurred upon closing). It has flexible settings for displaying lines, allows the use of Magicnumber, and enables you to set the desired profit level for each level.
Settings list:
Target profit for Buy trades. Target profit for All trades. Target profit for overall break-even level. Show Buy line. Show Sell line. Show ov
FREE

This indicator is a zero-lag indicator and displays strength of trend change . True Trend Oscillator Pro works best in combination with True Trend Moving Average Pro that displays exact trend as is. Oscillator value is exact price change in given direction of the trend.
True Trend Moving Average Pro: https://www.mql5.com/en/market/product/103586
If you set PERIOD input parameter to 1 this indicator becomes a sharpshooter for binary options.
Developers can use True Trend Oscillator in Exper
FREE

Average Session Range: Calculate and Average the Sessions High-Low Range of Specific Time Sessions Over Multiple Days. The Session Average Range is a sophisticated and precise tool designed to calculate the volatility of specific time sessions within the trading day. By meticulously analyzing the range between the high and low prices of a defined trading session over multiple days, this tool provides traders with a clear and actionable average range. **Note:** When the trading platform is closed
FREE

This is the demo version of "All Harmonics 26" indicator . "All Harmonics 26" searches for 26 types of harmonic patterns and outputs them in a convenient way. You can check out the documentation here . This demo version has the following limitations: The indicator searches only for one type of harmonic patterns out of 26:- Gartley. The indicator outputs new patterns with a lag of 10 bars.
FREE

Multicurrency and multitimeframe modification of the ZigZag indicator. Displays the current direction of the market, the height of the last movement, the number of bars in this movement and the breaking of the previous point of the ZigZag (horizontal line). This is MTF Scanner, you can actually see the supply and demand levels.
You can specify any desired currencies and timeframes in the parameters. Also, the panel can send notifications when the ZigZag changes direction or when there was a br

Shows min and max of last M5 Candle. Can be used to trade breakouts of last M5 candle. The M5 Candle Breakout Strategy avoids to stay too long in a sindways phase. See documentation on @swisstrader3713, where you can follow my live trading. The only parameters are the color of the lines defining the M5 stretch. Best use the indicator in M1 timeframe. The M5 Breakout Strategy has helped me to reduce overtrading.
FREE

This indicator is very useful in observing the direction of the market. It allows users to enter multiple MA lines with specific display method. In addition, it is also possible to change the candle color same to color of the background of chart, so that we only focus on the MA lines. When a signal appears, represented by a red or green dot, we can consider opening a sell (red dot) or buy (green dot) order. Note: it need to set stoploss at the highest value of MA lines (with sell order) or lowe
FREE

This indicator allows you to enjoy the two most popular products for analyzing request volumes and market deals at a favorable price: Actual Depth of Market Chart Actual Tick Footprint Volume Chart This product combines the power of both indicators and is provided as a single file. The functionality of Actual COMBO Depth of Market AND Tick Volume Chart is fully identical to the original indicators. You will enjoy the power of these two products combined into the single super-indicator! Below is

Introducing our latest innovation in MetaTrader 5 indicators, designed to dramatically improve your trading workflow with high functionality and ease-of-use. It features a robust collection of features designed to help you streamline chart analysis and make the most of your trading decisions. Here's a quick rundown of its incredible features: Fast Drawing of Objects : Save precious time with the quick draw feature. With just a click of a button, you can create various trading objects on your ch
FREE

This tool is useful for indicating resistance and support levels It bases on zone in setting to identify top/bottom of candles and and draw rectangle according to those resistance/support level Beside user can edit the zone via dialog on specific timeframe and that value will be saved and loaded automatically. User can determine what strong resistance and support and make the order reasonably.
FREE
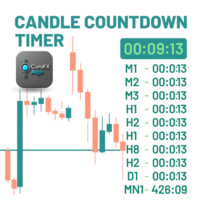
ClaroFxAlgo Candle Countdown Timer – MetaTrader 5 Indicator Overview CandleCountdownTimer is a powerful yet lightweight MT5 indicator that displays dynamic countdowns to the next candle close, helping traders gain precise timing awareness across all timeframes. Its sleek, customizable design ensures critical timing data is visible—without cluttering your charts. Key Features ️ Main Timer Display – Live countdown to the next candle close on current timeframe Multi-Timeframe Panel – View
FREE
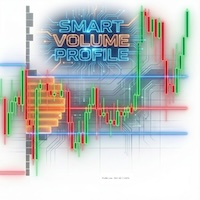
Japanese 「スマートマネー」のスキャン (Volume Markers): 異常な出来高(平均以上)を伴うローソク足を、緑と赤の矢印ではっきりと表示します。大口投資家の参入を見極め、ダマシのシグナルを排除するのに役立ちます。 重要なアラート機能 (Alerts): 画面に張り付く必要はありません。価格がPOC(出来高の中心点)をクロスした瞬間にシステムが通知します。ここはトレンドの継続か反転かの重要な判断ポイントとなります。 現在の市場構造を即座に把握 (Developing Profile): 現在形成中の価格サイクルのプロファイルを表示します。価格が保ち合い(アキュムレーション)ゾーンから抜け出そうとしているのか、それとも平均値に引き戻されているのかを確認できます。

TimeTake v2.00 is a lightweight, ultra-clean candlestick countdown timer indicator for MetaTrader 5 that displays in real time how many minutes and seconds are left until the current candle closes. Designed for traders who love simplicity and hate cluttered charts, TimeTake shows only what matters: a bold, perfectly readable countdown in the lower-left corner. Key Features Real-time countdown timer (MM:SS or HH:MM:SS or even days on monthly charts) Automatically adapts format: → 05:23 on M1–H4 →
FREE

The Trade by levels for mt5 indicator is designed to automatically determine the formation of a model for entering the market on the chart of the selected instrument.
Definitions: ⦁ BFl is the bar that formed the level. ⦁ BCL1 and BCL2 bars, confirming the level.
The graphical model: ⦁ levels high\low the bars BFL and BCL1 must match the accuracy to the point ⦁ there can be any number of bars between BFL and BCL1. ⦁ between BCL1 and BCL2 intermedi
FREE

VR システム は単なる指標ではなく、金融市場で取引するためのバランスの取れた取引システム全体です。このシステムは、古典的な取引ルールと、 移動平均 とドンチャン チャネル の指標の組み合わせに基づいて構築されています。 VR システム は、市場に参入するためのルール、市場でポジションを保持するためのルール、およびポジションを決済するためのルールを考慮します。シンプルな取引ルール、最小限のリスク、明確な指示により、VR システムは金融市場のトレーダーにとって魅力的な取引戦略となっています。 設定、設定ファイル、デモ版、説明書、問題解決方法は、以下から入手できます。 [ブログ]
レビューを読んだり書いたりすることができます。 [リンク]
のバージョン [MetaTrader 4] 取引システムは、移動平均とドンチャン チャネルの 2 つの組み合わせ指標で構成されます。 Donchian channel – 金融商品の現在の状態を判断するために設計されたこのインジケーターは、トレンドまたはフラットを判断するための古典的なルールに従って構築されています。新しい極大値が以前のものより高い、
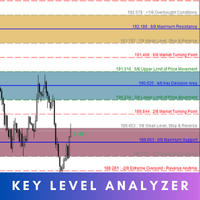
Key Level Analyzer – Know Better, Trade Smarter Key Level Analyzer is a powerful trading tool designed to provide precise market insights by identifying high-probability price zones , market turning points , and key decision areas . Unlike traditional indicators, it uses a smart algorithm to dynamically calculate support, resistance, and balance zones, helping traders make informed, data-driven decisions . MT4 Version - https://www.mql5.com/en/market/product/132809/ With real-ti

The indicator displays candlesticks of a given senior timeframe, on smaller timeframes
TF_Bar - selection of the senior timeframe, based on which candlesticks on the current one will be displayed.;
Number_of_Bars - the maximum number of bars up to which the indicator will be calculated.;
Color_Up - color display of bullish candlesticks;
Color_Down - color display of bearish candlesticks;
Widht_lines - the thickness of the indicator lines.
Other useful free and paid products can be viewed
FREE
MetaTraderマーケットはトレーダーのための自動売買ロボットやテクニカル指標を備えており、 ターミナルから直接利用することができます。
MQL5.community支払いシステムはMetaTraderサービス上のトランザクションのためにMQL5.comサイトに登録したすべてのユーザーに利用可能です。WebMoney、PayPal または銀行カードを使っての入金や出金が可能です。
取引の機会を逃しています。
- 無料取引アプリ
- 8千を超えるシグナルをコピー
- 金融ニュースで金融マーケットを探索
新規登録
ログイン