
AP Day Week Monthly High Low
- Indicators
-
Allan Graham Pike
 I believe markets deserve specialist tools built with the same discipline and focus as the markets themselves. Too many EAs try to trade everything in every way—and end up doing none of it well. My approach is simple: build single-mission systems that express one clear edge with clarity and control.
 - Version: 1.0
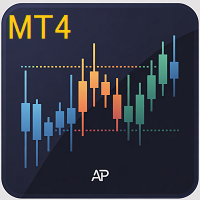
overlay that draws the prior Day, Week, and Month highs/lows on any chart. Great for session planning, confluence, and alerting when price comes back to important swing levels.
What it does
-
Plots 6 lines: Day High/Low, Week High/Low, Month High/Low (from the previous completed sessions).
-
Touch/near alerts when price reaches a selected line (with a user-set tolerance).
-
Works on any symbol and timeframe. Zero external libraries.
How to use
-
Drop it on the chart you trade.
-
Toggle which sets you want (Day / Week / Month).
-
Set the touch tolerance (points) if you want alerts; leave at default for a small buffer.
Inputs
-
Show Day / Week / Month – turn each set on/off.
-
Alerts – enable/disable pop-up alerts on touch/near.
-
Silence in Tester – mutes pop-ups during Strategy Tester runs.
-
Touch tolerance (points) – distance from a line to trigger the alert.
Notes
-
Lines update automatically at the start of a new day/week/month.
-
This is an indicator (not an EA). It does not open or manage trades.




















































Very good indicator, the best i have used so far, working like a charm