Watch the Market tutorial videos on YouTube
How to buy а trading robot or an indicator
Run your EA on
virtual hosting
virtual hosting
Test аn indicator/trading robot before buying
Want to earn in the Market?
How to present a product for a sell-through
New Technical Indicators for MetaTrader 5 - 57

Points of Inertia is a powerful tool for detecting critical points of price movement, based on the idea of calculating the inertia of price fluctuations.
_________________________________
How to use the indicator signals:
The indicator generates a signal after a new price bar appears. It is recommended to use the generated signal after the price breaks through the critical point in the specified direction. The indicator does not redraw its signals.
_________________________________
The in
FREE

Market Palette is a powerful tool for filtering trading decisions based on inertia and acceleration of price fluctuations.
_________________________________
How to use the indicator signals:
The indicator generates histogram signals in three different colors. In the standard color scheme, when blue columns appear, it is recommended to keep only long positions, when red columns appear, only short ones, and when gray columns appear, refrain from trading actions. The appearance of higher column
FREE

** All Symbols x All Timeframes scan just by pressing scanner button ** ***Contact me to send you instruction and add you in "RSI scanner group" for sharing or seeing experiences with other users. Introduction RSI divergence is a main technique used to determine trend reversing when it’s time to sell or buy because prices are likely to drop or pick in the charts. The RSI Divergence indicator can help you locate the top and bottom of the market. This indicator finds Regular divergence for pullba
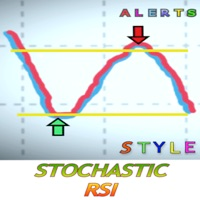
What is Stochastic RSI? The Stochastic RSI (StochRSI) is an indicator used in technical analysis that ranges between zero and one (or zero and 100 on some charting platforms) and is created by applying the Stochastic oscillator formula to a set of relative strength index (RSI) values rather than to standard price data. This version includes alerts to do not miss really good opportunities. You set the parameter when you want to receive a signal buy order or signal sell order. In order to receive

M & W Pattern Pro is an advanced scanner for M and W patters , it uses extra filters to ensure scanned patterns are profitable.
The indicator can be used with all symbols and time frames.
The indicator is a non repaint indicator with accurate statistics calculations.
To use , simply scan the most profitable pair using the statistics dashboard accuracy , then enter trades on signal arrow and exit at the TP and SL levels.
STATISTICS : Accuracy 1 : This is the percentage of the times price hits TP

Market Profile 3 MetaTrader 5 indicator version 4.70— is a classic Market Profile implementation that can show the price density over time, outlining the most important price levels, value area, and control value of a given trading session. This indicator can be attached to timeframes between M1 and D1 and will show the Market Profile for daily, weekly, monthly, or even intraday sessions. Lower timeframes offer higher precision. Higher timeframes are recommended for better visibility. It is als
FREE

本指标 基于 Zigzag 基础上... 增加了: 1.增加了箭头指示,使图表更鲜明 2.增加了价格显示,使大家更清楚的看清价格. 3.增加了报警等设置,可以支持邮件发送 原指标特性: 1.基本的波段指标构型. 2.最近的2个ZIGZAG点不具有稳定性,随着行情而改变,(就是网友所说的未来函数) 3.原指标适合分析历史拐点,波段特性,对于价格波动有一定的指导性.
Zigzag的使用方法一 丈量一段行情的起点和终点 (1)用ZigZag标注的折点作为起点和终点之后,行情的走势方向就被确立了(空头趋势); (2)根据道氏理论的逻辑,行情会按照波峰浪谷的锯齿形运行,行情确立之后会走回撤行情,回撤的过程中ZigZag会再次形成折点,就是回撤点; (3)在回撤点选择机会进场,等待行情再次启动,止损可以放到回撤的高点。 一套交易系统基本的框架就建立起来了。 Zigzag的使用方法二 作为画趋势线的连接点 趋势线是很常见的技术指标,在技术分析中被广泛地使用。 但一直以来趋势线在实战中都存在一个BUG,那就是难以保证划线的一致性。 在图表上有很多的高低点,到底该连接哪一个呢?不同的书上画趋势线的方法
FREE

Gann 9+ Indicator Introduction The "Gann Matrix Chart" is the most simple and clear technical analysis in Gann theory, which is the calculation tool that Gann has always been committed to using. It is the essence of Gann's whole life. The Gann 9+ indicator uses the matrix chart to find the future high or low points of stocks or futures. Indicator Input: The base and step size can be set as 1 by default; When the multiple is -1, the multiple will be automatically obtained, or it can be filled in

Of all the tasks that a trader faces when entering a market, the main task is to determine the direction of the trend. The Artificial Power indicator will help you with this task. Whatever goal the trader sets for himself, the tool to achieve it will be mainly trend indicators.
The Artificial Power indicator without delay and redrawing is used by traders in trend strategies in trading on financial markets (Forex, CFD, binary options). This indicator is designed to detect trends in price moveme

This indicator scans the 1-3 Trendline pattern . The indicator is a 100 % non repaint low risk breakout system . The patterns are formed around swing high and swing lows which make them a low risk pattern with high reward.
PATTERN BACKGROUND The 1-3 Trendline Breakout pattern is formed by four(4) points which are composed of three (3) primary points and the pattern neck. A trendline is always formed by the point 1 and the neck of the pattern . When price breaks out of the trendline formed , it

Flag Pattern pro is a Price Action (PA) analytical tool that scans the continuation patterns known as "Flag and Pennant Patterns" .
Flag and Pennant patterns are continuation patterns characterized by a move in a previous trend direction after a shallow retracement usually below 50% of the original move . Deep retracements can however be sometimes found at the 61.8 % levels. The original move is know as the flag pole and the retracement is called the flag.
Indicator Fundam

Have you ever wondered which currency is the strongest at any particular time? Or which currency pair is trending the most. Well, the currency strength meter helps with just that. It compares USD , EUR , AUD , CHF , GBP , CAD and NZD depending on the timeline you have chosen in settings, and ranks them on the number of pips each has moved compared to the rest. N/B: All currency charts of the above pairs must have loaded. You can do this by highlighting all major and minor currencies in
FREE

The currency strength momentum has a lot of similarities with currency strength meter presented in the previous page, but the difference are much more pronounced. You can try putting both in the same chart and see the difference in results. Currency strength momentum measures strength of a currency based on (you guess it) it's momentum relative to other currencies, while currency strength meter measures the strength of a currency based on pips it has moved in a certain direction.
FREE

Presentation
Another indicator that makes scalping on tick charts easier, it displays an Heiken Ashi graph in Ticks.
It allows to detect entry points and trend reversals. Recommended number of ticks in a candle : 5, 13 or 21.
Parameters Ticks in candle: Number of ticks in a candle (default 5), Displays Trend arrows : displays a trend arrow based on EMA8 and EMA20 crossing, Displays MM50, Displays MM100, Max Candle (CPU): number of candles max to manage, low value will save ressources of your
FREE
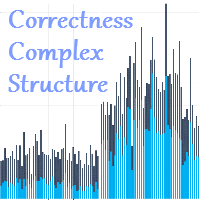
The Correctness Complex Structure indicator displays the complex structure of the bar, taking into account tick volumes in digital terms. How to interpret the information provided by the indicator. It's very simple, it's enough to analyze the chart. We will explain the work using an example, take the EURUSD instrument on the D1 timeframe, install this indicator and analyze the information provided by the indicator. The indicator works in the bottom of the chart and gives the result in the form
CalcFlat Creative is a flat indicator.
This is a more advanced version of the CalcFlat indicator. Three lines have been added for this indicator, which significantly improve the performance of the predecessor indicator. In addition to the two existing levels that the user reacted to and which were static, now the indicator has three dynamic lines on top of the main chart and interpreted as: signal line base, signal minimum, signal maximum.
These lines are formed due to the additional indicato

This indicator is very useful in observing the direction of the market. It allows users to enter multiple MA lines with specific display method. In addition, it is also possible to change the candle color same to color of the background of chart, so that we only focus on the MA lines. When a signal appears, represented by a red or green dot, we can consider opening a sell (red dot) or buy (green dot) order. Note: it need to set stoploss at the highest value of MA lines (with sell order) or lowe
FREE

This indicator combines RSI(14) and ADX(14) to find out the signal that price moves strongly. When it appears signal (represent by the yellow dot), and price is going down, let consider to open a SELL order. Otherwise, let consider to open a BUY order. In this case, the strength of moving is strong (normally after sideway period), so we can set TP by 3 times of SL .
FREE

Trendlines are the most essential tool of technical analysis in forex trading. Unfortunately, most traders don’t draw them correctly. Automated Trendlines indicator is a professional tool for serious traders that help you visualize the trending movement of the markets .
AMAZING OFFER --> Activations from 5 to 20 for "MTF Supply Demand Zones" and "Automated Trendlines"
There are two types of Trendlines Bullish Trendlines and Bearish Trendlines.
In the uptrend, Forex trend line is drawn throu

https://c.mql5.com/31/761/best-trend-indicator-logo-200x200-8493.png The indicator uses a solid line of red and green to reflect the myriad changes in market prices. The green line indicates a period of rising market prices and the red line indicates a period of falling market prices. Solid line color change indicates that the market has changed and the market is likely to reverse! It is recommended that you use this indicator on your daily K-chart. This indicator is not suitable for you to do
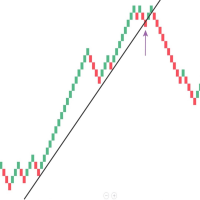
Mean Renko Bars are used for alternate price charting. Unlike the usual time framed chart – where every candle represents a fixed time interval – the goal of Renko chart is to display price movement in increments, called bricks. Best with the momentum strategies. Can make some Algo with this candel ---- ---- ---- ---- ---- ---- ---- ---- ---- ---- Support: primecapitalvn@ gmail. com
FREE

Introduction to Chart Pattern MT Chart Pattern MT is a chart pattern scanner to detect the triangle pattern, falling wedge pattern, rising wedge pattern, channel pattern and so on. Chart Pattern MT uses highly sophisticated chart pattern detection algorithm. However, we have designed it in the easy to use with intuitive user interface. Chart Pattern MT will show all the patterns in your chart in the most efficient format for your trading. You do not have to do tedious manual pattern detection an
Trading Direction is an indicator that will never go against a long trend, stable, accurate and without the slightest redrawing. The indicator goes through the whole story! You can find settings for any tool for which there is a free TDO utility .
Trade rules. When a signal appears (always at the bar opening price), we immediately close the opposite position, if it exists, despite the fact of a drawdown or profit. And we open a new position following the arrow in the right direction. And these

The Recuroid indicator shows very good entry points. Just look at the screenshots, then download the free version and look in the strategy tester and see for yourself.
The system is based on two key algorithms. The first algorithm (managed) creates a system of balanced transition from the buy zone to the sell zone and vice versa, draws arrows and lines, and forms entries. The second algorithm (managing) corrects the initial data for the first algorithm (managed) by measuring virtual windows, t

This is a buyer and seller aggression indicator that analyzes the shape of each candle and project this data in a histogram form. There are 4 histograms in one. On the front we have two: Upper - Buyer force. Lower - Seller force. At the background we also have two histogram, both with same color. They measure the combined strenght of buyers and sellers. This histograms can be turned off in Input Parameters. It is also possible to have the real or tick volume to help on this force measurement. IN
FREE

Relative Volume or RVOL is an indicator that averages the volume of X amount of days, making it easy to compare sessions volumes.
The histogram only has 3 colors:
Green - Above average volume
Yellow - Average volume
Red - Below average volume
The default setting is 20 days, which corresponds more or less to a month of trading.
In this version is possible to choose between tick and real volumes (if you are using a broker which offers future contracts)
With the data obtained from this in
FREE

This indicator provides several drawing tools to assist in various methods of chart analysis.
The drawings will keep their proportions (according to their handle trendline) across different chart scales, update in real time, and multiple drawings are supported.
#
Drawing Option
Description
1 Grid box draggable boxed grid, user defines rows x colums, diagonal ray option 2 Grid partial or fullscreen grid, sized by handle line 3 Grid flex a diagonal grid, sized and sloped by handle line
4 Cyc

This indicator is designed for those people who want to trade and earn on any instruments and timeframes.The indicator gives out very good points to enter the market,it is very easy to trade,the arrows will show when to open trades,set and trade without thinking about anything,stop loss and take profit, set each one yourself,it all depends on your trading style,someone scalps and someone holds trades on a few days.In the strategy tester, the indicator simply cannot physically show accurate resu

This indicator provides common shapes as drawing object options. The shapes are rotatable, resizable, draggable, and will keep their proportions (according to their handle trendline) across different chart scales. Multiple drawings are supported.
Shapes: Square Rhombus
Triangle (quadrilateral & isosceles) Circle (grid, overlapped grid, flexi grid, rotatable grid, concentric circles) Features: rays (all object edges will be rays) show/hide each individual drawing type, or all delete last drawn ob
FREE
Divergence is one best ways to trade the financial market as it is a leading indicator of price action that detect high probability reversal and continuation setups. The AlgoKing Divergence Detector is an RSI and Stochastics Indicator with Divergence Detection. Features Hidden Divergence for trend continuation. Standard or Normal Divergence for trend reversal. Screen Alerts. MetaQuotes Notifications. Email Notifications. RSI Indicator built in. Stochastics Indicator built in. Types of Divergen

Speed resistance lines are a powerful tool for determining trend and resistance lines. The indicator builds lines using chart extremes and special mathematical formulas. The indicator can be used to determine the trend direction and pivot points.
<---------------------------->
Indicator Parameters:
"Depth of search" - depth (in bars) of the search for chart extremes "Back step of search" - minimum distance (in bars) between extremes "Deviation of price" - permissible price difference between
FREE

UR TrendExhaustion MT5 UR TrendExhaustion MT5 is the best solution for traders who don't want to deal with parameter values nor other set-ups - it is both easy and visually-understandable for everyone. Advantages of using UR TrendExhaustion MT5: No parameters You have 3 lines that describe best what's going on on the chart: Trend Exhaustion Line , Whale Money Line and Retail Money Line . The interface showcases the exhaustion of either line on both extremes (red areas) The best adva

UR Highs&Lows MT5 UR Highs&Lows MT5 does an in-depth analysis of price movement and its volatility, and creates a channel within which the price is moving. That channel moves now as an oscillator and is overlayed with price's deviation to signal potential exhaustions and possible reversals. Advantages of using UR Highs&Lows MT5 : No parameters You have 3 lines that describe the price movement - White Line which is an average of the price, and Blue Lines which are its extremes The histogram is a

The indicator refers to the means of probabilistic analysis. Prediction is performed by the Monte Carlo method together with a mathematical model of a neuron. But, the modeling of samples for this method is made not artificially, but comes from the original "nature", that is, from history. The number of samples and the detail of their modeling is achieved using the lower (relative current) timeframe.
Indicator algorithm :
In general terms, the algorithm boils down to the fact that the indica

LEVELS (extremes, stops, takeprofits)
The indicator visualizes the levels of recent price extremes. Such values are searched for by means of an internal algorithm. It does not redraw. It is used to change stop order placement levels (done manually by the user, the indicator only visualizes the level). It can also be used for taking partial profits at opposite levels of the movement. The indicator will allow you to take most of the strong movements. You don't have to worry about exiting a positi
Impulse Creative is a more advanced indicator of impulses for making decisions (compared to the Impulse Change indicator). The main task of this indicator is to warn the trader about the moment of price changes and also to give a command to enter according to the current trend. To determine the trend, use any other tool, this development forms only an entry point but not the entry direction.
First, look at the screenshots and notice that we see clearly expressed figures that the indicator form

Shift Trend is an indicator of the formation of entry signals, entry points. The indicator must be selected to work for a sufficiently short period of time. But who works in short ranges, then this indicator is well suited.
Options: Length1 - The first parameter. Length2 - Second parameter; PointActivity - Parameter controlling peak levels. PointMinDist - The parameter that sets the minimum distance. AvgLengthBar - Bar averaging.
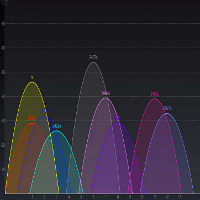
Change Analyzer - The indicator can be called an indicator of market balance. Since the indicator is on the zero line, then the market is balanced in a certain timeframe and a certain instrument.
Based on two virtual windows and their mutual placement, this graph is built. As a result of its work, the price chart normalizes relative to the zero line, which helps to draw conclusions about the price behavior. The indicator is somewhat reminiscent of the overbought and oversold system, but the al

With Renko Plus you can use the features in the Indicator functionality, just add it to the Metatrader5 chart.
The Renko chart is a type of chart, developed by the Japanese, that is constructed using price movement rather than standardized prices and time intervals like most charts. It is believed to be named after the Japanese word for bricks, "renga", as the graphic looks like a series of bricks.
A new brick is created when the price moves a specified pri
For Nasdaq trading, the most important principle is to know the trend of the fund.
This indicator with 6 green and red lights provides you with the daily path of this important indicator.
This indicator has been tested for 6 months and has a win rate of over 85%.
Be sure to contact me before purchasing to get the necessary instructions on how to use and set up this indicator.
You should use a broker that has dollar index, vix, and commodities. MT4 Version
You can contact us via Instagram, Teleg
Acceleration Force Meter Indicator - is a trend system that join market in trend phase and after trend pull-back. AFM indicator - is the system that watchs market phases from flat to extreme volatility and prefers to enter in market when it's active, more volatility, ignoring most flat places. This is 100% complete trading system including enter and exit points. It works well with profitable trades - maximizing take profit targets(analysis of recent market volatility, its pips range to adapt cur

Overlay indicator on chart between 2 pairs
The Timeframe Overlay indicator displays the price action of timeframes on a single chart, allowing you to quickly assess different timeframes from a single chart. The advantage is to observe and follow the correlations of price movements in real time to help you find potential trades at a glance.
---- Symbol 1 ----
Symbol = EURUSD
Correlation Inverse = false
Display = true
Ratio
FREE
Golden section price action indicator - is a trend-scalping complete system with enter and exit points. Indicator is based on most powerfull price action japan patterns that are filtered by volume, volatility, market phase. Pattern is not a simple combinations of candles. Patterns must have "weight" to move market in right direction. "Weight" - is the summary of pattern's volume, the size of pattern candles according to last average volatility and ofcourse pattern must appear in correct market p

Identification of support and resistance areas
A useful indicator for traders
completely free
Can be used in all symbols
Can be used in all time frames
It has three different trends: short term, medium term, long term
Settings:
Clr1,2: You can change the color of the lines
Type Trend: You can determine the trend
Message me for questions, criticism and suggestions
FREE

AlgoKing Chandelier Exit Indicator (MT5)
The Chandelier Exit Indicator is a volatility based indicator that maximizes returns using the Average True Range (ATR) value and the highest high or lowest low of a period. Benefits Should be used as a trailing stop. Helps you exit a position when you have a respectable profit. Identifies a high probability of a trend reversal when the price moves against the prevailing trend by a distance equal to 3x the average volatility. Join the AlgoKing Lightning

Volality Index scalper indicator Meant for Volality pairs such as Volality 10, 25, 50, 75 and 100 The indicator works on all timeframes from the 1 minute to the monthly timeframe the indicator is non repaint the indicator has 3 entry settings 1 color change on zero cross 2 color change on slope change 3 color change on signal line cross Orange line is your sell signal Blue line is your buy signal.

Diagnosis of major and minor pivot
Trend detection
with many signals
Can be used in all symbols
Can be used in all time frames
Settings:
Back Show: The number of candles it displays
If you need any adjustments, or have any questions or suggestions, message me
How to trade:
Blue: sell signal
Red: buy signal
Blue and red at the same time: no signal
Exit signal: Opposite signal

Forecasting the future by combining trend and average price
with many signals
Can be used in all symbols
Can be used in all time frames
Settings:
BackShow: The number of candles displayed
Osi: Main setting, the larger the number, the longer the trend
If you need more settings, or have any questions or suggestions, message me
How to trade:
Blue: sell signal
Red: buy signal
Blue and red at the same time: no signal
Multi-Timeframe Chart Overlay Indicator
The Timeframe Overlay indicator displays price action for multiple timeframes on a single chart, allowing you to quickly assess different timeframes from a single chart. The advantage is to observe and follow the correlations of price movements in real time to help you find potential trades at a glance.
---- Symbol 1 ----
Symbol = EURUSD
Correlation Inverse = false
Display = true
Ratio

UR DivergenceSpotter MT5 UR DivergenceSpotter MT5 is the result of many years of experience and sometimes the easiest ways are the best. There is a good correlation between a few indicators, but when they mismatch - the price tries to "re-adjust" - and it's at that moment when we get a signal with UR DivergenceSpotter MT5. Advantages of using UR Divergence Spotter MT5: No parameters Doesn't repaint after the candle is created Signals when the signal is not valid anymore (meaning that you c

UR VolumeTrend MT5 UR VolumeTrend MT5 is the clearest volume indicator showing the ongoing trend in terms of volume. Works perfectly with other indicators just like UR TrendExhaustion to signal local tops and bottoms. Limited to just 2 parameters - the higher values, the longer trends it will show. Gradient extremes show possible exhaustions of volume to catch a potential reversal. Two lines - The Volume trend and It's average. The best advantage: Easy and adjusted to all assets. There is a

Dealing Expert Pro Method to Install Download the indictaor. Attach to the Chart of Symbol. A subwindow would appear with all indictaor values for the timeframe slected. Study the trend of indictaor values for better analysis. Better the time to read better the values would be. The indictaor would provide its values for both directios where upward or downward.
Impulse Change is an indicator of impulses for decision making. The main task of this indicator is to warn the trader about the moment of price changes.
Do you often doubt when to make a decision? Leave the market or wait? This indicator is for you, Impulse Change will help you and provide a clearly defined correct hint.
There are always moments in history in which the behavior of the market differs sharply from what happens for the longest periods of time, such uncharacteristic behavior can
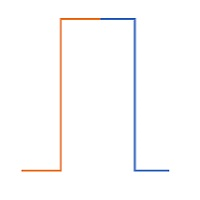
A Good , Easy , Readable and handy indicator for experienced and professional traders. It gives bounded signals between zero and one. Easy for investors to comprehend. It gives near and longer trading outlook to investors and helps them to find good opportunities. Indicator gives zero signal on price downturns and signal value equals to one on price upturns. Once again a new type of indicator and rangebound between zero and one .
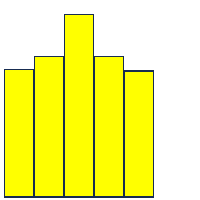
Sales Sales for seasonal traders.A new type of indicator for Professional and Experienced Traders. Specifically designed for trend identification. A great tool for investors to invest at the right and suitable time for decent trading. You can present it to your potential clients and customers for their satisfaction. A very handy and trendy tool. Easy to read , comprehend and user friendly. By this tool you can easily identify the potential to enter in trading and low potential to exit.
It c

Free version of the TickScalper indicator. The Tick Scalp indicator is a trading assistant for a scalping trader. Works in a separate window. Tracks the momentary activity of the market, shows the graph of the movement of ticks and the strength of bulls or bears. Sometimes it can anticipate the beginning of a strong movement before any other indicators. Helps the trader to make a decision to open the desired order. Designed to work on any instrument. Used timeframes from M1 to M15. Has simple a
FREE

Here is the boom and crash crazy Ma scalper a secretly coded color MA that is 1000% NON-REPAINT Works best on boom and crash 1000 Can be used on all timeframes from the 1 Minute timeframe to the Monthly timeframe The indicator is also a multi-time frame indicator you can select which timeframe to use The indicator is made for scalping purposes. as the trend changes the color of the indicator changes all well

In the Apple is a stable indicator of exit points, no signal will change or redraw.
The indicator displays buy and sell signals with recommended markers for exiting a position. Each exit marker is accompanied by an information mark about the profit from the operation. The label consists of two parts. The first label displays the profit from the last operation in instrument points, and the second label displays the total balance. The total balance starts to be calculated from the moment when th

In the Forex trading system, the Pivot Points trading method is a classic trading strategy. Pivot Points is a very simple resistance support system. Based on yesterday’s highest, lowest and closing prices, seven price points are calculated, including one pivot point, three resistance levels and three support levels.
The resistance line and the support line are one of the tools that are often used in technical analysis, and the role of the support line and the pressure line can be mutually trans

!! FLASH SALE !! Over 80% off !! For ONE week only. Now only $47 - normally $297! >>> Ends on 30 June 2023 - Don't miss it!
Buy and Sell Arrows On The Chart According To Price Action Sends Alerts On MT5 To Your Phone To You Email
Does NOT repaint. Works on any pair, any timeframe.
10 Activations allowed so you are free from limitations. MT4 Version here . For spreads from a tiny 0.1 pips RAW/ECN Accounts, click here . Check out my Waka Esque EA signal here: >> High Risk Se
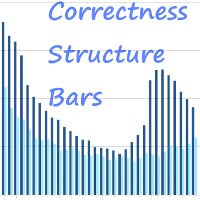
The Correctness Structure Bars indicator displays the bar structure in digital terms. How to Interpret the Information Provided by the Indicator It is very simple, all you have to do is analyze the chart. We will explain the work using an example, take the EURUSD instrument on the D1 timeframe, install this indicator and analyze the information provided by the indicator. The indicator works in the bottom of the chart and gives the result in the form of a histogram, that is, each bar (when a bar
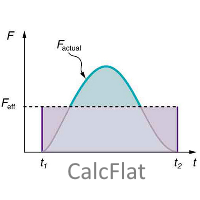
CalcFlat is a flat indicator.
At first glance, a simple indicator, but if you look at the screenshots for people who are not specialists, it may seem that the indicator is not very informative. But in fact, the indicator is very informationally active. It needs to be adjusted for each instrument and each timeframe. Very flexible in the settings there are two key settings, but they can significantly change the results of the display of the indicator. In addition to the main histogram, the indic
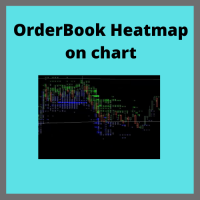
Ever needed a Boomap-like indicator for you MT5? Here you are!!
FULL WORKING DEMO VERSION available on Channel:
https://www.mql5.com/en/channels/011107AFAAE3D801
With this indicator you will see all the important levels, in which the largest bid and ask order are sitting. This indicator will show show all the history on limit order planed on the book. It will work only for futures broker who support level 2 order book. You can visualize the orders with colors and or with a text indicating the

Candle counter This indicator counts and identifies candles based on a longer time frame Bigger Timeframe You can choose the daily timeframe as " Bigger Timeframe ", and run it within any smaller chart. that it will count the bars based on the daily chart . If you pass as a parameter the timeframe " H1 " then the indicator will know how to count the bars inside the H1 chart you just need to run it on smaller charts. The main parameter is the " Bigger Timeframe " which is a larger timeframe than
FREE
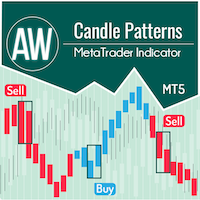
The AW Candle Patterns indicator is a combination of an advanced trend indicator combined with a powerful candle pattern scanner. It is a useful tool for recognizing and highlighting the thirty most reliable candlestick patterns. In addition, it is a current trend analyzer based on colored bars with a plug-in multi-timeframe trend panel that can be resized and positioned. A unique ability to adjust the display of patterns depending on the trend filtering. Advantages: Easily identifies candle p

Volatility Vision: Essential for Forex and Stock Markets
Discover Volatility Vision: Your Trading Revolution Perfect for Both Beginners and Expert Traders Easy Start Guide: Learn how to use it effectively with our User Manual .
The Volatility Vision indicator is a powerful tool that maps out precise volatility levels on your charts. This versatile tool is essential for integrating into your trading strategy, compatible across all currency pairs and stock markets. Utilize volatility thresholds t

Auto Fibo Expansion is an indicator that projects the Fibonacci expansion levels above and below the opening price of the day. It does the calculation based on the previous day and projects the levels on the current day. It is very efficient to find "psychological" zones of support and resistance. Its appearance is all configurable and you can set up to 30 different levels. Enjoy! This is a free indicator, but it took hours to develop. If you want to pay me a coffee, I appreciate a lot <3 PayP
FREE

Indicator developed by the Brazilian and analyst Odir Aguiar (Didi), consists of "Moving Averages", famously known as "Didi needles", where it allows the viewing of reversal points.
The concept is very simple, when you enter 3 Moving Averages on display, a period equal to 3, one equal to 8 and the other equal to 20, then the formation of the indicator that works in axis or line center equal to 0 (zero) appears. ). Moving averages must intersect when approaching line 0.
The scanner monitors 10
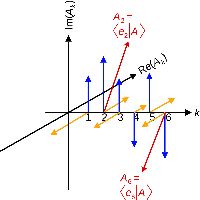
ComplexVectorHL is an indicator that characterizes the change in short-term market trends. The indicator is based on market analysis using the mathematical apparatus of complex numbers. The essence of the indicator is that it, with clear impulses, indicates the points in time when it is necessary to make decisions. The impulses are like a cardiogram showing the heartbeat of the market. The indicator has pulses only in one direction (unlike the previous development of ComplexVector), the pulses

Tape Reading, flow monitoring.
FabFlowInPrice is a powerful indicator for those who like Tape Reading (Times & Trades). It presents the volumes traded at each price level, considering the purchase, sale and direct aggressions for each level. Excellent tool for market flow analysis. Thought of flow so monitor who is attacking the most, buyers, sellers or direct exchanges, thought FabFlowInPrice. The indicator displays information in 4 distinct and fixed periods, on any timeframe: @Day - All t
The MetaTrader Market is a simple and convenient site where developers can sell their trading applications.
We will help you post your product and explain you how to prepare your product description for the Market. All applications on the Market are encryption-protected and can only be run on a buyer's computer. Illegal copying is impossible.
You are missing trading opportunities:
- Free trading apps
- Over 8,000 signals for copying
- Economic news for exploring financial markets
Registration
Log in
If you do not have an account, please register
Allow the use of cookies to log in to the MQL5.com website.
Please enable the necessary setting in your browser, otherwise you will not be able to log in.