Watch the Market tutorial videos on YouTube
How to buy а trading robot or an indicator
Run your EA on
virtual hosting
virtual hosting
Test аn indicator/trading robot before buying
Want to earn in the Market?
How to present a product for a sell-through
New Technical Indicators for MetaTrader 5 - 55

This is a non-parametric ZigZag providing 4 different methods of calculation. Upward edge continues on new bars while their `highs` are above highest `low` among previous bars, downward edge continues on next bars while their `lows` are below lowest `high` among previous; Gann swing: upward edge continues while `highs` and `lows` are higher than on the left adjacent bar, downward edge continues while `highs` and `lows` are lower than on the left adjacent bar. Inside bars (with lower `high` and
FREE

Victory Price Direction I'm glad to present you my new indicator.
This indicator includes all the best strategies that I have researched. When developing and optimizing, I used ML algorithms. The indicator is very easy to use.
Now the indicator has 3 basic strategies and the ability to customize your own strategy. I am constantly looking for better strategies.
You get: A simple and effective indicator of reversals. The indicator will help you place Take Profit correctly.

The indicator plots a curve of the difference between the values of two trading instruments (currency pairs).
The purpose of the indicator is to observe the processes of divergence and convergence of the values of two trading instruments. The results obtained can be used for trading strategies of statistical arbitrage, pair trading, correlation, and others.
Trading strategy
The indicator is attached to the chart of any trading instrument. In the input parameters, the names of trading i
FREE

The previous day's vwap is used by some traders as a support and resistance point, after all it is one of the ways to consider the fair price of that asset or that pair the day before. Possible defenses can occur in this region indicating a reversal, or triggering stops starting a new, more directional movement. It is a matter of analyzing how it will add to your operational.
To avoid manually drawing the previous day's vwaps and saving time for your analysis, use the Vwap Freeze indicator,

WT Vwap 5 Bands
The WT Vwap Bands indicator is an indicator that combines price and volume, helping to show whether the price is within the "fair price", overbought or oversold.
The indicator code was designed for performance and has already been tested in a real trading account.
In addition to the visual inputs (color, thickness and line style), the user can define a% value that depends on the price.
The default values work with the most distant band at 1% of the price and then di

Buy and sell signals based on the Wave Setup strategy for entering a trade on the pullback after a reversal.
How does the indicator work? The indicator activates the buy and sell signal when their respective conditions are met. For an uptrend, we need a reversal up on the EMA9 followed by prices above the ascending SMA21 making a pullback and a touch on it. For a downtrend, we need a reversal down on the EMA9 followed by prices below the descending SMA21 making a pullback and a touch on it.

It is the very same classic Stochastic indicator, but with a little twist: NO NAME and data is shown in the sub window. It could be stupid, BUT, if you are running out of space in Micro windows like Mini Charts, where the indicator's name is totally useless, you came to the right place. And that's it! I know it seems stupid but I needed the classical version of Stochastic indicator without that annoying name on my Mini Chart, so I did it that way... The original formula is right from Metaquote's
FREE
Indicator summary Индикатор информационная панель отображает значения и торговые действия, а так же выводит сводную информацию о торговых действиях, основанных на 11 встроенных индикаторах. Встроенные индикаторы:
RSI (Relative Strength Index )- пересечение зоны перекупленности сверху вниз - сигнал на продажу. Пересечение зоны перепроданности снизу вверх - сигнал на покупку. При колебаниях в зоне между перекупленостью и перепроданостью сигнал формируется в зависимости от нахождения значения о

The Trend Quality Indicator (by David Sepiashvili) is intended to measure trend activity. Some benchmarks can be used to determine the strength of a trend.
In the range of values from -1 to +1 ( Ignored zone parameter) , the trend is buried beneath noise. It is preferable to stay out of this zone.
The greater the value, the less the risk of trading with a trend, and the more reliable the trading opportunity.
The range from +1 to +2, or from -1 to -2, may be treated as zone of weak tr

Support And Resistance Screener Breakthrough unique Solution With All Important levels analyzer and Markets Structures Feature Built Inside One Tool ! Our indicator has been developed by traders for traders and with one Indicator you will find all Imporant market levels with one click.
LIMITED TIME OFFER : Support and Resistance Screener Indicator is available for only 50 $ and lifetime. ( Original price 125$ ) (offer extended) The available tools ( Features ) in our Indicator are : 1. HH-LL

Trend Power Indicator is an indicator which helps to identify trend direction and its power by using moving averages ZigZag pattern and correlations of tradable instruments. It provides trend power data with user-friendly interface which can be read easily and fast. This indicator by default is configured for trading of Adam Khoo's ( Piranhaprofit ) strategies. It saves mass of time for searching of tradable pairs by his strategies. It indicates when all required moving averages are align
Indicator VolumeTick https://youtu.be/tmHZKdMCMGo
made for rapid identification of possible reversal points, when the conditions of consolidation and bi-directional trading traders, the number of volumes in the market increases sharply, which shows the interest of the participants to change the direction of movement of the tool market and counts the number of ticks on each bar, made in the form of an oscillator. This way we can foresee stopping trading or trading in the other direction, or add

This is an advanced multi-timeframe version of the popular Hull Moving Average (HMA) Features Two lines of the Hull indicator of different timeframes on the same chart. The HMA line of the higher timeframe defines the trend, and the HMA line of the current timeframe defines the short-term price movements. A graphical panel with HMA indicator data from all timeframes at the same time . If the HMA switched its direction on any timeframe, the panel displays a question or exclamation mark with a tex

The new indicator is a trend predictor for the current chart as well as other symbols and timeframes. Every button on the board is interactive. By default, you have 20 currency pairs in the watchlist and three timeframes (M5, H1, D1) but you can choose the periods and symbols you want to display from the menu.
If the indicator is blue, it indicates the beginning of an uptrend. If it is red, it indicates the beginning of a downtrend.
In capture # 3 (Daylight mode) I will explain each element

The indicator is based on a proven successful strategy. It shows buys and sello signals with suggested stop and target. In the same way, it calculates the essential trading analysis statistics as successful and profit ratio. KEY LINKS: Indicator Manual – How to Install - Frequent Questions - All Products Indicator features Effective and understandable signals. It can be used as a complete trading strategy. Complete trading statistics to evaluate the indicator performance. It shows exact

Graph configuration and buy and sell signals based on Stormer's (Alexandre Wolwacz, Brazilian trader) swing, position and day trade strategy, described on his youtube channel (https://www.youtube.com/watch?v= 0QZ_NjWkwl0)
The buy and sell indications are based on 2 candle patterns ( Inside Bar [Yellow] and Reversal Closing Price [Blue and Red] ), 3 Moving Averages and 1 Stochastic .
Indicators: Inside Bar - Candle pattern indicating trend continuity, or reversal Reversal Closing Price - Ca
FREE

O Indicador CoioteChart foi construído pra facilitar desde a leitura de contexto de mercado até a micro estrutura do candle, facilitando ajustes operacionais e tomadas e decisão com alta eficácia.
Possui um controle para habilitar e desabilitar a visualização das pocs, vwap, zonas de máxima e mínima negociação, pode ser utilizado data sources de tempos gráficos para cálculos ou utilizado os ticks de agressão do time and trades, funciona com volume real e volume de ticks.
As colorações são at

ToolBot Probabilistic Analysis - FREE An effective indicator for your negotiations
The toolbot indicator brings the calculation of candles and a probabilistic analysis so that you have more security on your own.
Also test our FREE tops and bottoms indicator: : https://www.mql5.com/pt/market/product/52385#description Also test our FREE (RSI, ATR, ADX, OBV) indicator : https://www.mql5.com/pt/market/product/53448#description
Try our EA ToolBot for free: https://www.mql
FREE

It is a Graphical and Trend indicator that brings several advantages. Eliminates noise.
Facilitates the identification of the trends. Can be used as directional force indicator. Identify lateralization: candles with close and open price closer. Identifies high volatility: candles with shadows larger than the body. Attention!!! Works on any asset and any time frame.
Easy setup Symbol: anyone Time frame: anyone Parameters: Indicator Period Recommended Period : betw

The indicator identifies two most important patterns of technical analysis - Pin Bar and Engulfing. MT4-version: https://www.mql5.com/en/market/product/53591 Settings: Mincandle size for PinBar - The minimum size of the Pin-Bar candlestick; Percentage of candle body on size - The percentage of the candle body in relation to its length; PinBar Alert - Alert when a Pin-Bar is detected; PinBar Mail - Sends an email when a Pin Bar is found; PinBar Notification - Sends a push notificati

This Indicator is based on the high's moving average and the low's moving average for trend following and/or trailing stops.
How does the indicator work? The indicator plots the uptrend dots until there is a close below the moving average of the lows. When this happens, a downtrend begins and is plotted until there is a close above the moving average of the highs. When this happens, another uptrend begins. And so it goes.
How to use it? - Trend following: You can use it as buy signals when
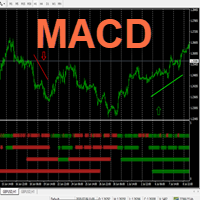
Hello This Indicator will draw Green (Up) and Red (Down) small arrows from Multi TimeFrames based in ( MACD ) to help you to take decision to buy or sell or waiting If there 4 green arrows in same vertical line that's mean (Up) and If there 4 Red arrows in same vertical line that's mean (Down) and the options contain (Alert , Mobile and Mail Notifications). Please watch our video for more details https://youtu.be/MVzDbFYPw1M and these is EA for it https://www.mql5.com/en/market/product/59092 G
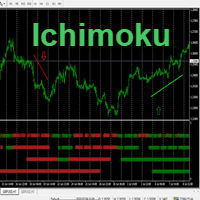
Hello This Indicator will draw Green (Up) and Red (Down) small arrows from Multi TimeFrames based in ( Ichimoku ) to help you to take decision to buy or sell or waiting If there 4 green arrows in same vertical line that's mean (Up) and If there 4 Red arrows in same vertical line that's mean (Down) and the options contain (Alert and Mobile , Mail Notifications). Please watch our video for more details https://youtu.be/MVzDbFYPw1M and these is EA for it https://www.mql5.com/en/market/product/590

SR Breakup Indicator it is an indicator based on support and resistance . It makes price breakout levels visible by opening the trader's mind to spot market opportunities.
Attention!!! This Indicator can be used in any time frame.
Suggestion of use Wait until the support and resistance lines are horizontal and closer. Do Trade (BUY): if price breakout resistance level (outside line). Do Trade (SELL): if price breakout support level (outside line). Use internal lines as Sto

To calculate strength of currencies and to show in table There is 1 parameter: . Show recommended pairs: true/false -> To show top 1 of strong and weak currency Tips to trade: . To trade only with strongest vs weakest currency . When H1, M30, M15, M5 of specific currency is up or down -> consider to open BUY/SELL . It can combine: + strongest currency vs weakest currency + strongest currency vs 2nd weakest currency + 2nd strongest currency vs weakest currency
FREE

Candle de Volume Coiote O Candle de Volume Coiote é um indicador que mede a variação do volume no tempo, seu corpo é pela variação do volume anterior pelo volume atual, sua direção pelo fechamento do preço.
1. identificado um topo no indicador Candle de Volume Coiote (marcado o fechamento do preço).
2. identificado um fundo no indicador Candle de Volume Coiote (marcado o fechamento do preço).
3. fundo 3 igual fundo 2 no indicador Candle de Volume Coiote, preço no 3 é diferente de fundo 2

Candle com coloração de Volume Price Analysis (VPA) segundo as definições da Anna Coulling, é possível configurar períodos de climax e rising, fator de extreme e fator de rising.
Pode-se usar volume real ou volume de ticks. O VPA considera a variação de preço por volume do período, indicando se um movimento está recebendo ignição, está em seu climax ou se já não existe mais interesse.
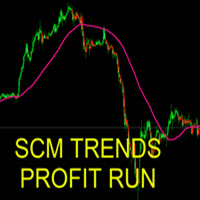
The indicator can be used in several ways. The simplest is to buy when the SCM Trends Profit Run line is painted green and sell when it is red. This indicator that allows you to detect several changes and dynamics in price that many traders can’t estimate or see without an indicator, which highlights its essence and usage.
Accordingly, traders can draw conclusions and make estimates about how the prices will change based on the information they have and then they can modify their strategy fo

Indicador que cria um painel para acompanhamento to total de posições abertas no ativo do gráfivo.
São apresentados os dados: Ativo do gráfico Total de posições de venda em aberto Quantidade do volume de posições de venda em aberto Total de posições de compra em aberto Quantidade do volume de posições de compra em aberto.
Painel simples mas eficiente para o equilíbrio das ordens
FREE

The Price Action Finder indicator is an indicator of entry points, which is designed to search and display patterns of the Price Action system on a price chart. The indicator is equipped with a system of trend filters, as well as a system of alerts and push notifications. Manual (Be sure to read before purchasing) | Version for MT4 Advantages
1. Patterns: Pin bar, Outside bar, Inside bar, PPR, Power bar, Hanging man, Inverted hammer 2. Pattern filtering system. Removes countertrend patterns fro
MT4: https://www.mql5.com/en/market/product/52715
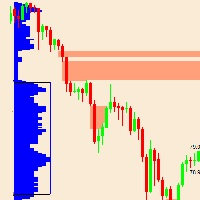
This indicator is based on market profile theory. What exactly is a singles area? Theory: Market Profile Singles : Singles or single prints or gap of the profile are placed in the inside of a profile structure, not at the upper or lower edge. They are represented with single TPOs printed on the Market profile. Singles draw our attention to places where the price moved very fast (impulse movements). They leave low volume nodes with liquidi
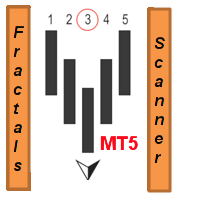
This multi time frame and multi symbol indicator identifies fractals patterns. As a bonus it can also scan for Parabolic SAR (pSAR) trend changes. Combined with your own rules and techniques, this indicator will allow you to create (or enhance) your own powerful system. Features
Can monitor all symbols visible in your Market Watch window at the same time. Apply the indicator to just one chart and instantly monitor the entire market. Can monitor every time frame, from M1 to MN, and sends you a r

KT Renko Patterns scans the Renko chart brick by brick to find some famous chart patterns that are frequently used by traders across the various financial markets. Compared to the time-based charts, patterns based trading is easier and more evident on Renko charts due to their uncluttered appearance.
KT Renko Patterns features multiple Renko patterns, and many of these patterns are extensively explained in the book titled Profitable Trading with Renko Charts by Prashant Shah. A 100% automate

FXC iRSI-DivergencE MT5 Indicator
This is an advanced RSI indicator that finds trend-turn divergences on the current symbol. The indicator detects divergence between the RSI and the price movements as a strong trend-turn pattern.
Main features: Advanced divergence settings
Price based on Close, Open or High/Low prices Give Buy/Sell open signals PUSH notifications
E-mail sending Pop-up alert Customizeable Information panel Input parameters: RSI Period: The Period size of the RSI indicator.
R
VolumeDeltaScanner is a volume delta monitor for multiple (up to 10) time scopes. It works by online ticks or history ticks. Indicator monitors tick volumes for buys and sells separately, and find their delta on every bar and larger scopes, then displays the volume deltas for all the scopes. Every scope is presented by its own buffer/line. The smallest scope is the current timeframe. It's required. All other scopes should be multiples of it. For example, if placed on a M5 chart, it can calculat

ToolBot Advisor Indicator (RSI, ATR, ADX, OBV) FREE An effective indicator for your negotiations
The toolbot indicator and advisor brings leading (OBV) and lagging (RSI, ATR, ADX) indicators so that you have more security in your negotiations. In addition, it informs you of possible up and down trends as well as providing you with incredible advisors who will give you information about trading opportunities.
With this indicator you will have more security and speed in your decision making
FREE

Moving average indicator to work with the F12 Replay simulation and replay tool.
In this way, the F12 Replay tool now supports the moving average indicator.
F12 Replay: https://www.mql5.com/pt/market/product/38313
This is a product developed by Renato Fiche Junior and available to all MetaTrader 5 users!
Partners: "Águia Traders" team ( Eagle Traders ) by Larissa Sihle #aguiatraders #larissasihle
Input Parameters
Period Shift Method
FREE

Mostra a média móvel quando ADX > 20 e pinta de verde ou vermelho quando os valores de ADX estão subindo indicando tendência. Quando o ADX é menor que 20 indica movimento lateral consolidado. O indicador não define pontos de entrada, somente mostra a média colorida quando a tendência está se fortalecendo. Faz parte do grupo de indicadores do Indicador Tavim.
FREE

Description
Range Detector is an indicator that identifies ranges in the market and displays their presence on the price chart.
Recommendations
You can use this indicator to determine the flet and, accordingly, to determine the direction of opening a position or closing an opposite position.
Parameters
Maximum History Bars - maximum number of history bars for calculating the indicator. Average True Range Period - ATR indicator period (used to calculate the difference between mov

O indicador imprime a linha da média longa quando as médias media e curta estão confinadas dentro dos limites de 1 ATR (average tru range) da média longa. Após períodos de congestão os preços se movimentam fortemente em uma direção. Este indicador não fornece pontos de entrada, apenas mostra que as médias estão bastante próximas. Parâmetros: Periodmalongo: Período da média longa. Periodmamedio: Período da segunda média. Periodmamedio2:Período da terceira média. Periodmacurto: Período da média cu
FREE

Description : Rainbow MT5 is a technical indicator based on Moving Average with period 34 and very easy to use. When price crosses above MA and MA changes color to green, then this is a signal to buy. When price crosses below MA and MA changes color to red, then this is a signal to sell. The Expert advisor ( Rainbow EA MT5 ) based on Rainbow MT5 indicator is now available here .
MT4 version is available here .
FREE

Slightly changed for speed. testers are required for a new adviser, who is interested, write to me by e-mail 777basil@mail.ru
The indicator is calculated based on price changes in the history and is calculated mathematically, recalculated each time the data is received again. It can be used on different timeframes. From the borders of the indicator in 70% there is a change in the direction of price movement, or consolidation. In this way, you can trade both on the trend and in the middle of t
FREE

The indicator is based on indicators built-in standard indicators, the indicator take into account the current indicators 30 indicators and give a signal to buy or sell, the General trend of all trends of other indicators. In the input parameters, you can configure special parameters for each indicator. the indicator is executed in the form of an oscillator and shows the General trend and the preponderance of all indicators in one or the other direction. https://youtu.be/UG2ZZEH9B_U
FREE

This indicator has the main purpose of showing the current spread of the asset in which the indicator was placed. Depending on the photos, visually and within the graph itself, it is possible to view the spread value at the current time, it is possible to change the vertical position of the text and the horizontal position, in addition to the font size and color of the text.
FREE

FXC iCorrelatioN MT5 Indicator (Specialized for DAX - DowJones)
The indicator shows the correlation soefficient between two assets. Correlations are useful because they can indicate a predictive relationship that can be exploited in practice. The correlation coefficient shows the relationship between the two symbols. When the correlation is near 1.0, the symbols are moving togerhet in the same direction. When the correlation is near -1.0, the symbols are moving in opposite direction. Main featu

Horizontal Level indicator - reflects, using a histogram, the horizontal volumes of transactions at a certain price without reference to time. At the same time, the histogram appears directly in the terminal window, and each column of the volume is easily correlated with the quote value of the currency pair. The volume of transactions is of great importance in exchange trading, usually an increase in the number of concluded contracts confirms the trend, and their reduction indicates an imminent

This indicator will draw two lines to represent the adjustment value, which can be used in both the Dollar and the Index.
The main advantage of this indicator is that it has two lines, one representing the adjustment calculated from the previous day and the other representing the adjustment calculated on the current day. The calculation of the adjustment on the current day is a great differential, since it will be possible to make operations in order to sleep bought or sold according to the a
FREE

Description: Never guess again which currency pairs are trending and which ones are not! This indicator shows exactly which currencies are gaining strength and which currencies are losing strength. The indicator can be used to very quickly determine which currency pairs are trending and which currency pairs are in a sideways motion. When one currency is gaining strength and another is losing strength, the corresponding currency pair is trending. Its as easy as that! For instance, if EUR is showi

This multi time frame and multi symbol indicator scans for pin bars. Combined with your own rules and techniques, this indicator will allow you to create (or enhance) your own powerful system. Features Can monitor all symbols visible in your Market Watch window at the same time. Apply the indicator to just one chart and instantly monitor the entire market. Can monitors every time frame, from M1 to MN, and sends you a real-time alert when a pin bar is identified. All Metatrader native alert types

This indicator serves as an alert for climax regions.
How does it work? When the 20-period arithmetic moving average meets the 200-period arithmetic moving average, a conflict region forms with two major opposing forces fighting. This causes the price to show random peaks until a winner side is defined, which can be dangerous. Therefore, the indicator paints the region between the moving averages to alert you.
How to use it? It can be used for specific volatility or support and resistance s
FREE

It is very easy to use the Fibrillar indicator, since the simplest is to look at the chart and act according to the indications of the colored arrows. The algorithm takes into account the measurement of prices, and this method also focuses on measuring each of the price drops (H / C, H / O, LC, LO) - which gives more detailed information, but also more averaged.
When calculating this indicator, logarithmic gains are first calculated at the closing price, which allows you to filter out the tre

Buy and sell signals based on the Continuous Point Setup for trend continuation, popularized in Brazil by Stormer and Palex.
How does it work? The indicator activates the buy signal when we have prices above the ascending 21-period Simple Moving Average (SMA21) followed by a pullback and a touch on it.
For a sell signal we need the prices below the descending SMA21 followed by a pullback and a touch on it.
How to use it? One way of using it, as suggested by Stormer, is to enter the

Buy and sell signals based on Larry Williams's exponential moving average strategies 9.1, 9.2, 9.3 and 9.4 for trend reversals and continuations.
To understand the logic and how to trade the signals, please check: Setup 9.1: https://www.mql5.com/pt/market/product/50986 Setup 9.2: https://www.mql5.com/pt/market/product/52268 Setup 9.3: https://www.mql5.com/pt/market/product/52269 Setup 9.4: https://www.mql5.com/pt/market/product/52273
Notices: - This indicator displays a lot of signals.

Limitless MT5 is a universal indicator suitable for every beginner and experienced trader.
works on all currency pairs, cryptocurrencies, raw stocks
Limitless MT5 - already configured and does not require additional configuration
And now the main thing
Why Limitless MT5?
1 complete lack of redrawing
2 two years of testing by the best specialists in trading
3 the accuracy of correct signals exceeds 80%
4 performed well in trading during news releases
Trading rules
1 buy signa

Buy and sell signals based on Joe DiNapoli's shifted 3 period exponential moving average strategy for trend reversals.
Who is he? Joe DiNapoli is a professional trader and author that has been involved in the markets for more than 38 years. He is also a registered Commodity Trading Advisor (C.T.A.) for over 15 years and has taught his techniques in the major financial capitals of Europe, Asia, South Africa, the Middle East, Russia and in the United States.
How does the indicator work? The i

The fundamental technical indicator Ripple, allows you to assess the current market situation in order to enter the market of the selected currency pair in the trend and with minimal risk. It uses in its basis the process of identifying the rate of change in price growth and allows you to find points of entry and exit from the market.
This indicator was created on the basis of the original indicators of the search for extremes, the indicator is well suited for detecting a reversal or a large

O Indicador valida a força da tendência utilizando o volume negociado. Os candles são mostrados na cor verde indicando força compradora e cor vermelha na força vendedora. O movimento é encerrado pelo SAR parabólico. Vantagens: Filtra distorções de preço sem volume financeiro; Filtra consolidações e movimentos laterais; Filtra divergências de volume pelo indicador Money Flow. Desvantagens: Não filtra todos os falsos rompimentos, visto que rompimentos importantes geram altos volumes financeiros; N
FREE

Indicator with 3 features
- Clock : Clock independent of the chart, counting continues even when the market is closed.
- Template : After setting up a configuration in any graphic, be it color patterns, indicators, zoom ... The configuration will be copied to all active graphics.
- TimeFrame : Set the TimeFrame on a chart, and with just one click all the active charts will be changed to the same TimeFrame.

Utility for show on charts the visual informations about:
- a vertical line at start of each bar of selected timeframe
- a vertical line at start of each day
- a vertical line at start of each week
- vertical lines at start / end of trading sessions selected
- bid / ask prices, spread, money value for each point (of 1 standard lot) and last tick time recived"
You can enable / disable each information and set the color for each line
FREE

This indicator is an utility for have always under control, how much time is left at the end of the bar setted.
The utility show on the lower right of the chart, the countdown to the end.
When the remaining seconds is = to the seconds set in the input, the color of remaining seconds on chart, change color and play a warning sound to warn you that the bar is about the end. When the remaining seconds is < to the seconds set in the input, the utility play a beep to warn you that the bar is in
FREE

The indicator tracks the trend in 5 different chart times for the same asset, based on 6 signals for each chart time.
The main objective of the indicator is to show us the majority trend of the financial asset in which it was placed. The system transmits the information of the trends in several graphical times, in this way the user is able to have a wide view of the movement of the asset, this type of tool makes the user have a higher hit rate by helping the operator to execute orders in fa

Introduction to Fibonacci Volatility Indicator Volatility indicator can help you to detect any statistical advantage for your trading. Especially, if you are trading with Price Action and Price Patterns, then we recommend to use the Volatility indicator together with your strategy. Especically, Fibonacci Volatility indicator combines the market volatiltiy with Fibonacci Analysis to provide you more advanced volatiltiy indicator. Main Features Fibonacci Volatility in Z score Configuration Mode Fi

The intention of the dashboard is to provide a quick overview of the daily, weekly and monthly range of configured assets. In "single asset mode" the dashboard shows you possible reversal points directly in the chart, thus making statistics directly tradable. If a configured threshold is exceeded, the dashboard can send a screen alert, a notification (to the mobile MT5) or an email. There are various ways of using this information. One approach is that an asset that has completed nearly 100% o

BeST_Keltner Channels Strategies MT5 is an MT5 Indicator based on the original Keltner Channels Indicator and it can display in the Chart all the known Variations of Keltner Channels and also the corresponding 10 totally Strategies. Every such generally consists of a Central Moving Average Line and two Boundary Bands at a distance above and below it and can be traded mainly in a Trending Mode but also in a Ranging ReEntry Mode.
BeST_Keltner Channels Strategies Indicator Draws definite Bu

Thread indicator is calculating possible values for the upcoming periods. It is built by author’s system, with ability to learn. Input data ( recommended interval ): Sensitivity to oscillatory motion (integer value, 0 - 8) increase of value shifts priority of calculation towards high-frequency vibrations (increase loads the system) Shift of diagram (integer value, 0 - 8) shifts output of indicator to the right Diagram forecast (integer value, maximum 10) defies the number of periods calculated
FREE

If you like to use traditional Moving Averages (like SMAs and EMAs) to provide your trades for dynamic levels of Support and Resistance, you will love the Adaptive Moving Average (AMA). Created in 1995 by Perry Kaufman and presented to the world in his book " Smarter Trading : Improving Performance in Changing Markets ", the Adaptive Moving Average (also known as KAMA - Kaufman Adaptive Moving Average) has the goal to be the perfect companion for following a trend without noise, but s
FREE

Qstick is a way to objectively quantify candlestick analysis and improve the interpretation of candlestick patterns. Qstick was developed by Tushar Chande and published in his book " The New Technical Trader - Boost Your Profit by Plugging Into the Latest Indicators (1994) ". Qstick is built based on a moving average of the difference between the Open and Close prices. The basis of the idea is that the Opening and Closing prices are the heart of candlestick analysis. We strongly recommend the re
FREE
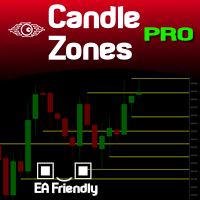
You probably heard about Candlesticks behaviors, which in most of the times could denote and trace Volume behaviors even if you are not watching Volume itself... Well, this indicator will do this. Naked traders love to rely solely on candlesticks patterns and with Candle Zones you can trap special patterns and DRAW THEM on your chart. As simple as that. There are several filters you can tweak in order to achieve the analysis you want. Just give it a try. After several months of testing, we think
AKT for MT5 (Traders Club)
機能: MAゴールデンクロスで買いサイン、デットクロスで売りサインを表示します。 MAの期間は短期足と長期足を入力できます。 MAの種類を選択できます。(SMA、EMA、SMMA、LWMA) 適用する価格を選べます。(CLOSE,OPEN,LOW,HIGH,MEDIAN,TYPICAL,WEIGHTED) サインをアラートで通知します。 サイン発生をE-mailやSNSで通知します。 表示するサインを変更することが出来ます。
サインの色を変更することが出来ます。
サインの表示された時間と価格が表示されます。
※価格は終値になります。
Indicator Noを変えることによるこのインジケータを複数適用することができます。
これにより違う MAの期間による ゴールデンクロスと デットクロスのサインを
表示できます。
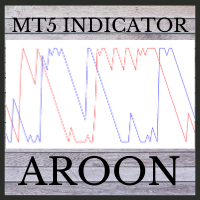
This indicator is powerful for detecting the trend.
The crossing between to line is the entry signal. Buffer 0 is UP line. Buffer 1 is DOWN line. Note: 1. Aroon is great tool for trending detecting. Please try to select the best period for each instrument.
Input AroonPeriod =14- Aroon period
MailAlert =false- Send email when entry signals appeared.
SoundAlert =false- Notify on MT5 platform.
The MetaTrader Market is the only store where you can download a free demo trading robot for testing and optimization using historical data.
Read the application overview and reviews from other customers, download it right to your terminal and test a trading robot before you buy. Only on the MetaTrader Market you can test an application absolutely free of charge.
You are missing trading opportunities:
- Free trading apps
- Over 8,000 signals for copying
- Economic news for exploring financial markets
Registration
Log in
If you do not have an account, please register
Allow the use of cookies to log in to the MQL5.com website.
Please enable the necessary setting in your browser, otherwise you will not be able to log in.