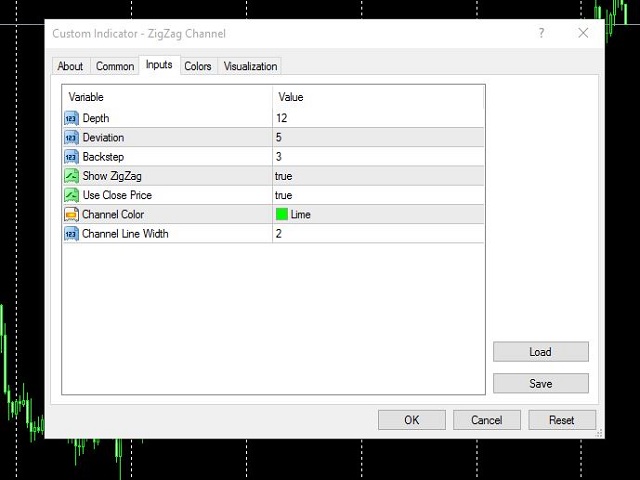
- Overview
- Reviews
- Comments
Zigzag Auto Channel
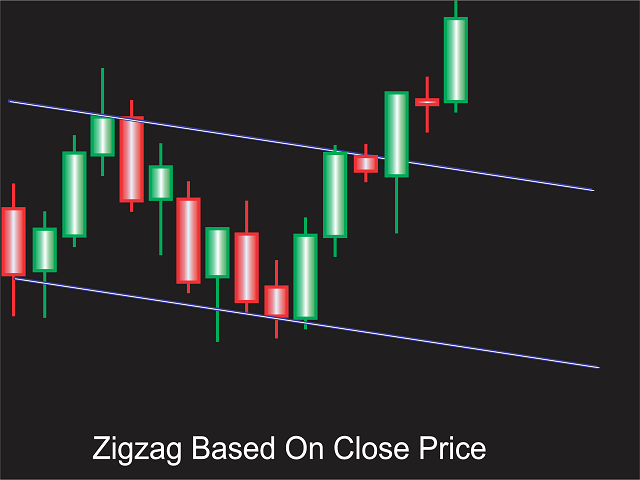
Automatically draws channel base on zigzag, with option to draw zigzag based on candle wicks or close prices.
All zigzag parameters can be adjusted in settings, option to display or hide zigzag also available, every other adjustable settings are self explanatory by their name, or at least so I believe.
Only download this indicator if you need a program to automatically plot channels for you based on zigzag of any specific settings.
Recommended products

XLines MT4 Free
FREE
Farid Shyhaliev
Free and limited version ( only one alert ) of the popular X-Lines indicator. X-Lines 2.0 Pro I want to present for your attention a new and completely updated and expanded version of X-Lines indicator. Version 2.0 Pro has many new features and can make your analysis more productive.
Please read full instructions here . Purchasing full version here .
1) Multi-timeframe settings and user-friendly control panel. You can dynamically select and save indicator settings not only for each c

Rainbow MT4
FREE
Jamal El Alama
Rainbow MT4 is a technical indicator based on Moving average with period 34 and very easy to use. When price crosses above MA and MA changes color to green, it’s a signal to buy. When price crosses below MA and MA changes color to red, it’s a signal to sell. The Expert advisor ( Rainbow EA MT4) based on Rainbow MT4 indicator, as you can see in the short video below is now available here .

Open All FREE
FREE
Chantal Sala
The Open All indicator uses a simple market information that is "Open Candle". This is the FREE version of paid indicator. This tool is able to show all the openings of all time frames in order to extract information of strength and trendy. You can display 28 instruments with relative time frame interior for a total of 252 informations. The display is fully customizable, you can choose either the symbol and enable/disable Time Frames. Using it correctly you could get valuable aid to intercept co

New Bar Alarm Free
FREE
Tomoyuki Nakazima
This indicator alerts you when/before new 1 or 5 minute bar candle formed. In other words,this indicator alerts you every 1/5 minutes. This indicator is especially useful for traders who trade when new bars formed.
*This indicator don't work propery in strategy tester.Use this in live trading to check functionality.
There is more powerful Pro version .In Pro version,you can choose more timeframe and so on.
Input Parameters Alert_Or_Sound =Sound ----- Choose alert or sound or both to not

Hourly Fibo
FREE
Khurram Mustafa
This is a product for Fibonacci fans.
Fibonacci is a tool mostly used to define support/resistance levels and decide on market entries and exits. The responsibility of this indicator is to manage Fibonacci Retracement of the last week. Product is especially developed for H1 and D1 chart. This indicator maintains Fibonacci retracement of last week High to Low where trader will find exact support/resistance levels. In this indicator, some extra levels are added. If you found any discrepancy, ple

Trend arrow Indicator
FREE
NGUYEN NGHIEM DUY
Trend arrow Indicator is an arrow Indicator used as an assistant tool for your trading strategy. The indicator analyzes the standard deviation of bar close for a given period and generates a buy or sell signals if the deviation increases. It good to combo with Martingale EA to follow Trend and Sellect Buy Only/Sell Only for EA work Semi-Automatic. Best for combo with some EA Money Printer EA , Forex Miner EA , Gold Miner MT4 , The King EA
You can use this Indicator with any EAs in my Produ

AMD Exclusive Two Separate Window Free
FREE
Szymon Palczynski
With this AMD Exclusive Two Separate Window Free indicator, you will be able to spot, predict, trade and profit from strong trends of markets
This is not a simple indicator, it is a ready to use trade system.
AMD Exclusive Two Separate Window Free works only on USDCAD currency pair. The full version of the product has no limitations.
Full version: https://www.mql5.com/en/market/product/33589
What we have? Automatic optimization Overbalance (manual, semi-automatic and automatic) Fibonacci P

MTF Heiken Ashi MA
FREE
Brian Lillard
MTF Heiken Ashi MA is a multiple timeframe Heiken Ashi & Moving Average indicator. Fully customizable for advanced & unique Heiken Ashi & Moving Average calculations.
Key Features This indicator has three historical bar price inputs of Close, High and Low. Multiple timeframe making it a great tool for trend and confirmations. No repaint is possible making it a great tool for scalping strategies. Tails are not shown in this evaluation of the traditional calculation.
Inputs MA Period(# of Peri

HMA Trend
FREE
Pavel Zamoshnikov
A trend indicator based on the Hull Moving Average (HMA) with two periods. The Hull Moving Average is an improved variant of the moving average, which shows the moment of trend reversal quite accurately. It is often used as a signal filter. Combination of two types of Hull Moving Averages makes a better use of these advantages: HMA with a slow period identifies the trend, while HMA with a fast period determines the short-term movements and signals in the trend direction.
Features The movement

Price Action With Fibbonaci and Divergance
FREE
Dedy Prasetiyo
How To Trade
Execute your trades in 3 Easy Steps!
Step 1: Trade Setup Entry Buy in Signal Arrow Divergance color DarkBlue. Entry Sell in Signal Arrow Divergance color Maroon. Success Rate ≥ 75% 100:25 Step 2: Set Stop Loss Stop loss BUY ----> You can set stop loss on line Fibonacci level 0.00, 23.6. Stop loss SELL ----> You can set stop loss on line Fibonacci level 0.00, 23.6. Step 3: Set Take Profit Take profit BUY on line Fibonacci level 38.2 or 50.0. Take profit SELL on line Fibonacci leve

ExitPoints MACD
FREE
Thomas Register
This is ExitPoints's version of the MACD (Moving Average Divergence Convergence) indicator. The MACD has been widely used for decades by financial analysts as a momentum indicator. This version has been normalized to expand the analysis characteristics of the indicator. Since the pattern of the MACD is preserved and only the scale has been normalized, a trader can use all the pattern recognition usage built in to the MACD such as trend changes and reversals. The indicator can be used effectively

Net Change FREE
FREE
Chantal Sala
This is the FREE version of Net Change Indicator. Only a Symbol! The indicator Net Change is a very useful tool able to extrapolate a percentage in order to have a real reference on the performance of the instrument. This indicator is designed to show the main values: you could monitor the Daily, Weekly, Monthly, Quarterly, Semi-annual and Annual percentages. A necessary tool for those who want to really explore the quantitative logic of the market. To see the FULL version: https://www.mql5.com

SR indicator
FREE
Alexander Chertnik
SR is a support and resistance indicator, it shows major highs and lows by different colors. The color of a level is changing if the last high or low are touching it. After the closing of a bar above or below level, it will delete it. extern inputs: loop for candles / colors / drawing time *This indicator signal is not perfect and have to be used with other market analysis and confirmations.

Coolest PAR
FREE
Aurora Minna Kiss
If you would like to facilitate the trading, this indicator is for you. Very easy to use: a small dot is placed below the price when the trend of the asset is upward (BUY position), while a dot is placed above the price when the trend is downward (SELL position). You will receives a sound signal, and a pop-up window warns you in order to Buy, or Sell. Parabolic indicator, individually tested settings for better results, with alerts. You can use on any TimeFrame. M1 - M15 for scalping, M30-H4 fo

Daily Fibonacci Levels
FREE
Andriy Svyetlichnyy
The Daily Fibonacci Levels is an indicator designed for displaying the Fibonacci levels by days using horizontal lines. Displayed levels: +100% (high) +61,8% +38,2% +23,6% average = (high+low)/2 -23.6% -38.2% -61.8% -100% (low) The indicator provides the ability to specify the hour to consider the start of the day. This may be necessary if the dates on the server are changed during the trading session.
Parameters StartHour — the hour for this indicator to consider as the start of a new day.

MTF Stochastic and RSI
FREE
Georgiy Gazaryan
A simple but effective helper that will allow you to track both global and local market trends. The indicator combines the work of two oscillators: Stochastic and RSI. Both indicators can be set to any timeframe.
Advantages of Use Multitimeframe - you can adjust both indicators to the desired timeframes. To obtain the entry points, you can use the Elder's triple screen system. Highly customizable - you can configure not only the parameters of the indicators, but also their appearance (color an

BB Trend Flat
FREE
Pavel Zamoshnikov
The indicator determines trend/flat status of the market using Bollinger Bands. Bollinger Bands diverge when the market moves sharply and converge when there is flat. The indicator uses this peculiarity. When the market is calm and distance between Bollinger Bands is less than some value, the indicator shows flat (gray histogram by default). When the market starts moving and divergence of Bollinger Bands exceeds this value, the indicator determines direction of the movement and shows an up trend

Strength Box
FREE
Khurram Mustafa
Strength Box is a very simple indicator to understand and anyone can use it. This is a totally free version. I am working on other indicators and Expert Advisors and I will add them to the Market soon. This indicator shows trends and is based on Relative Strength Index (RSI)
Features
20 and 80 - danger area (confirms trend pull back chances) 30 and 70 - thinking area (price pull back chances) 50 - neutral area Happy Trading!

HMA Dynamic Color
FREE
Wojciech Kuczer
HMA – Hull Moving Average is an indicator created by Allan Hull . HMA calculates the average price and draws results as a line on a chart. The biggest advantage of HMA is minimal lag comparing to SMA ( Smooth Moving Average ) or WMA ( Weighted Moving Average ) Moving averages are always popular among traders. Investors trust them because they can be very accurate trend indicators.
HMA strategy do’s and don’ts.
HMA used properly can be very helpful as a part of the trading strategy. I’m goi

Traditional MACD MT4
FREE
Daniel Lewis
MACD indicator in MetaTrader 4/5 looks different than MACD does in most other charting software. That is because the MetaTrader 4/5 version of MACD displays the MACD line as a histogram when it is traditionally displayed as a line. Additionally, the MetaTrader 4/5 version computes the Signal line using an SMA, while according to MACD definition it is supposed to be an EMA. The MetaTrader 4/5 version also does not compute a true MACD Histogram (the difference between the MACD/Signal lines). This

SFT Trend Chart
FREE
Artem Kuzmin
Opening positions in the direction of the trend is one of the most common trading tactics.
This indicator determines the direction of the local movement and colors the candles on the chart in the appropriate color.
Allows you to enter the transaction at the very beginning of the movement
Thanks to the flexible settings you can use on any currency pairs, metals and cryptocurrency
Can be used when working with binary options
Distinctive features Does not redraw. Additional parameters for

Simply The Best Pro Free
FREE
Szymon Palczynski
This indicator displays the histogram and arrows on chart. When Simple The Best Pro Free are placed on a chart, they identify the trend. The color of may be blue or red. The blue color stands for upside moves and the red color stands for downside trends. The indicator offers to set Stop Loss (SL) and Take Profit (TP) setting. The default value is ATR. Indicator has automatic optimization. The STB is a unique indicator that shows the tendency (button Bars) of a particular signals. The STB te

HMA Trend Professional demo MT4
FREE
Pavel Zamoshnikov
Demo version of the HMA Trend Professional indicator. The main feature of the "HMA Trend Professional" indicator is the ability to predict the trend reversal with high probability. The trend reversal forecast is based on the statistical analysis of history data. The indicator plots statistical diagrams which can be used by traders to see the current phase of the market (impulse or correction, the beginning, middle or end of the movement) and evaluate the probability of a reversal.
See the main

Price Reversal Demo
FREE
Alexey Surkov
The demo version of the indicator does not display data on the last 25 bars but is perfect for testing. The oscillator Price Reversal identifies potential price reversal points, while being in the overbought/oversold. It also displays the entry signals against the trend (sometimes these points coincide with the beginning of a new trend) (blue and red zone) and the entry points by trend (gray areas). It consists of two lines. The blue line is a fast line, the red line is a slow one. A market ent

Follow The Line
FREE
Oliver Gideon Amofa Appiah
FOLLOW THE LINE GET THE FULL VERSION HERE: https://www.mql5.com/en/market/product/36024 This indicator obeys the popular maxim that: "THE TREND IS YOUR FRIEND" It paints a GREEN line for BUY and also paints a RED line for SELL. It gives alarms and alerts of all kinds. IT DOES NOT REPAINT and can be used for all currency pairs and timeframes. Yes, as easy and simple as that. Even a newbie can use it to make great and reliable trades.
NB: For best results, get my other premium indicators for mo

Next Candle History Info
FREE
Aleksei Beliakov
How does this work? This indicator analyzes the history of the current timeframe and reports the information on: 1. The probability of the next 1-3 candles being bullish on this day of the week. 2. The probability of the next 1-3 candles being bearish on this day of the week. This information might be useful to people who believe in the repetition of history. Suppose you think that GBP always moves in a certain direction before the London Stock Exchange opens. This indicator will help you check

Power Trend Free
FREE
Yurij Kozhevnikov
Power Trend Free - the indicator shows the trend strength in the selected period.
Input Parameters The indicator has three input parameters: Period - a positive number greater than one, it shows the number of candlesticks used for calculations. If you enter one or zero, there will be no error, but the indicator will not be drawn. Applied Price - the standard "Apply to:" set meaning data used for the indicator calculation: Close - Close prices; Open - Open prices; High - High prices; Low - Low

Free automatic fibonacci
FREE
Tonny Obare
Free automatic fibonacci is an indicator that automatically plots a fibonacci retracement based on the number of bars you select on the BarsToScan setting in the indicator. The fibonacci is automatically updated in real time as new highest and lowest values appears amongst the selected bars. You can select which level values to be displayed in the indicator settings. You can also select the color of the levels thus enabling the trader to be able to attach the indicator several times with differe

Show Pips
FREE
Roman Podpora
This information indicator allows you to always be aware of the current account status. The indicator shows various data, including profit in points, percentage and currency, as well as a current symbol spread and time before a bar is closed on the current timeframe. You can select one of the different info line location types: To the right of the price (always following it); As a comment (in the upper left corner of the chart); In a selected screen corner. You can also select a data separator:

Support and Resistance Custom For Free
FREE
Wen Cheng Wen
Support and Resistance is a very important reference for trading. This indicator provides customized support and resistance levels, automatic draw line and play music functions. In addition to the custom RS, the default RS includes Pivot Point, Fibonacci, integer Price, MA, Bollinger Bands. Pivot Point is a resistance and support system. It has been widely used at froex,stocks, futures, treasury bonds and indexes. It is an effective support resistance analysis system. Fibonacci also known as t
Buyers of this product also purchase

Entry Points Pro
125 USD Yury Orlov
This is a trend indicator for MT4 providing accurate signals to enter a trade without redrawing or delays.
It can be applied to any financial assets: forex, cryptocurrencies, metals, stocks, indices . The best results are on the timeframe M15+
Our Telegram group | MT5 version of the indicator
IMPORTANT! Contact me after your purchase to get the detailed guide and bonus. Video (6:22) - one signal that made a profit equal to triple the price of the indicator. Video (4:4

Advanced Supply Demand
148 USD Bernhard Schweigert
CURRENTLY 33% OFF !! Best Solution for any Newbie or Expert Trader! This indicator is a unique, high quality and affordable trading tool because we have incorporated a number of proprietary features and a new formula. With this update, you will be able to show double timeframe zones . You will not only be able to show a higher TF but to show both, the chart TF, PLUS the higher TF: SHOWING NESTED ZONES . All Supply Demand traders will love it. :) Important Information Revealed
Maximize th

Advanced Currency Strength28 Indicator
148 USD Bernhard Schweigert
CURRENTLY 26% OFF Best Solution for any Newbie or Expert Trader! This Indicator is a unique, high quality and affordable trading tool because we have incorporated a number of proprietary features and a new formula. With only ONE chart you can read Currency Strength for 28 Forex pairs! Imagine how your trading will improve because you are able to pinpoint the exact trigger point of a new trend or scalping opportunity? User manual: click here That's the first one, the original! Don't buy a worthle

PipFinite Breakout EDGE
98 USD Karlo Wilson Vendiola
The Missing Edge You Need To Catch Breakouts Like A Pro. Follow a step-by-step system that detects the most powerful breakouts!
Discover market patterns that generate massive rewards based on a proven and tested strategy.
Unlock Your Serious Edge
Get it here www.mql5.com/en/blogs/post/723208
Have access to the game changing indicator that will take your trading to the next level!
How To Trade
Execute your trades in 3 Easy Steps!
Step 1: Trade Setup Enter a signal if Success Rate is

Nasdaq100 Power Indicator
149 USD Teboho Edgar Rakotsoane
The NASDAQ 100 Power Indicator serves with TREND and trend reversals indication using automated arrows that indicates buy or sell at that price and has built-in signal provider across all time frames with alerts and provides also the automated support and resistance that can draw technical analysis patterns like double bottom, double top, head and shoulders etc using closing and open prices, in assistance for if a trader did not see the pattern sooner for their technical analysis. The indicator

Best Currency Strength Indicator
149 USD Tumelo Rakotsoane
Advanced Currency Strength Indicator
The Advanced Divergence Currency Strength Indicator. Not only it breaks down all 28 forex currency pairs and calculates the strength of individual currencies across all timeframes , but, You'll be analyzing the WHOLE forex market in 1 window (In just 1 minute) . This indicator is very powerful because it reveals the true movements of the market. It is highly recommended to analyze charts knowing the performance of individual currencies or the countries ec

VR Sync Charts
52 USD Vladimir Pastushak
VR Sync Charts is a program designed as an indicator for the MetaTrader trading terminal. The program solves the problem of synchronization of chart windows by drawing a trend line in one chart window. the program copies and synchronizes the line with another chart in the MetaTrader terminal. Syncing will occur regardless of which period is set in the other chart. In the picture below, you can see how the trader manages the trend line, and the program synchronizes the line in another chart. The

PipFinite Trend PRO
98 USD Karlo Wilson Vendiola
Breakthrough Solution For Trend Trading And Filtering With All Important Features Built Inside One Tool! Trend Pro's smart algorithm detects the trend, filters out market noise and gives entry signals with exit levels. The new features with enhanced rules for statistical calculation improved the overall performance of this indicator.
Important Information Revealed Maximize the potential of Trend Pro, please visit www.mql5.com/en/blogs/post/713938 Test the demo version and explore its feature

Bermaui Deviation Percent
50 USD Muhammad Elbermawi
Or ( BD% ) which is a volatility index that measures volatility in percent rather than points. The idea of BD% is to make an index depending on the Classic Standard Deviation (CSD) that moves between 0 and 100 percent.
You can use BD% to compare volatility for the same security in different time periods or different time-frames. In addition, you can use BD% to compare volatility between different securities in different markets in terms of percent rather than points.
The idea behind th

FX Volume
75 USD Daniel Stein
You want to become a constantly profitable 5-star forex trader? 1. Read the basic description of our simple trading system & and it's major strategy update in 2020 2. Send a screenshot of your purchase to get your personal invitation to our exclusive trading chat
Following the smart money is finally possible! FX Volume is the FIRST and ONLY volume indicator that provides a REAL insight into the market sentiment from a broker's point of view. It provides awesome insights into how ins

Infinity TrendLine PRO
99 USD Evgenii Aksenov
PROMO: Buy Trend Line PRO today and contact me to get for free:
1) User's Manual about the indicator and built in pop-up Scanner 2) Settings files for Bitcoin, GOLD, EURUSD, GBPUSD 3) HTF Histogram (basement indicator) which shows Higher TimeFrame trend in the bottom of chart Contact me after purchased to receive useful files: profitcamp@mail.ru
TrendLine PRO indicator is based on the analysis of the strength of bulls and bears. TrendLine PRO never repaint and does not change the

Advanced Currency IMPULSE with ALERT
78 USD Bernhard Schweigert
CURRENTLY 39% OFF !! Best Solution for any Newbie or Expert Trader! This indicator is a unique, high quality and affordable trading tool because we have incorporated a number of proprietary features and a secret formula. With only ONE chart it gives Alerts for all 28 currency pairs . Imagine how your trading will improve because you are able to pinpoint the exact trigger point of a new trend or scalping opportunity! Built on new underlying algorithms it makes it even easier to identify an

FX Power
75 USD Daniel Stein
️️️️️ You want to become a constantly profitable 5-star forex trader? ️️️️️ 1. Read the basic description of our simple trading system & and it's major strategy update in 2020 2. Send a screenshot of your purchase to get your personal invitation to our exclusive trading chat
FX Power is the first currency strength meter with a complete history across all time frames.
It analyzes the momentum and strength of all major currencies to determine high probability trades. Key Fe

Buy Sell zones x2
99 USD Andrii Malakhov
Индикатор "Buy Sell zones x2" основан на принципе "остановка/разворот после сильного движения". Поэтому, как только обнаруживается сильное безоткатное движение, сразу после остановки - рисуется зона покупок/продаж. Зоны отрабатывают красиво. Или цена ретестит зону и улетает в космос, или пробивает зону насквозь и зона отрабатывается с другой стороны так же красиво. Работает на всех таймфреймах.
Лучше всего выглядит и отрабатывает на Н1.
Может использоваться как: индикатор зон, где лучше

SimSim arrow open up or down
50 USD Aleksandr Tyunev
SimSim arrow open up or down
The indicator calculates and summarizes data from 23 standard indicators. What standard indicators to use, the trader chooses himself. As a result of the calculation, we obtain the current signal level. Positive values of the signal indicate a possible purchase, negative values indicate a sale.
The indicator implements a testing system that can be tested by downloading the demo version.
An indicator can be a good addition to your trading strategy.
The indic

Heiken Ashi Scanner
50 USD Philip Pankaj
Heikin-Ashi charts , developed by Munehisa Homma in the 1700s. Munehisa Honma was a rice merchant from Sakata, Japan who traded in the Dojima Rice market in Osaka during the Tokugawa Shogunate. He is considered to be the father of the candlestick chart. Th e man who invented the use of candlestick charts for finding and profiting from chart patterns.He was a billionaire trader on those days if we compared his net-worth with todays dollar . Heikin Ashi Scanner is an Multi-Currency and Multi

Trading Chaos Map
125 USD Andrey Sinegovskiy
For those who studies Bill Williams' books "New Trading Dimensions" and "Trading Chaos (Second Edition)" and tries trading using these methods, it becomes evident that the standard set of indicators is not sufficient for full-fledged work. The Trading Chaos Map indicator draws the "market map", thus allowing you to the charts the same way as the author of the trilogy. Parameters provide options for enabling and disabling each signal. You can use any of the methods, or use them in conjunction. Yo

VR Small Chart
59 USD Vladimir Pastushak
The indicator displays a separate mini chart in a working window similar to МТ5 mini charts. You can expand/collapse the chart, change the chart symbol, period, as well as time and price scales. The app works in the strategy tester and you can switch the period of a mini chart.
Settings Select symbols - All Symbols: all symbols provided by a broker, Only market watch: only the symbols present in the Market Watch Prefix - two letters for distinguishing between a few indicator copies (if more th

Best And Worst Dashboard
100 USD Chantal Sala
Best and worst Dashboard was born from the idea to have a panel that includes all the symbols in a chart. It is very importance to understand which symbols are both positive and negative. In the past, we realized the single indicator Best and Worst ( https://www.mql5.com/en/market/product/11784 ), now thanks to the upgrading of the Metatrader the dashboard displays all the instruments simultaneously. A great revolution. This Dashboard is able to calculate performance at any time frame and clicki

True Direction Oscillator
60 USD Muhammad Elbermawi
Or (TDO) which is an index that measures the price rate of change using the principle of " Pure Momentum ".
When a security price advances from 10 to 15 then the price rate of change is 150% but when it declines back from 15 to 10 then price rate of change is 33.3% only. That is why technical analysis indicators like "Price Rate of Change" (ROC) or "Momentum" gives higher readings for ascending price movements than that given to descending ones. TDO fixes this problem to help traders at

TickUnit Scalper Currency Strength28 PRO
148 USD Bernhard Schweigert
CURRENTLY 26% OFF !! This indicator is a super combination of both our main indicators ( Advanced Currency Strength 28 and Advanced Currency IMPULSE with ALERT ). It shows Currency Strength values for TICK-UNITS and alert signals for 28 Forex pairs. 11 different Tick-Units can be used. Those are 1, 2, 3, 4, 5, 6, 10, 12, 15, 20, and 30 Seconds. The Tick-Unit bar in the sub-window will be shown and shifted to the left when there is at least 1 tick within the second’s timer. With only ONE

TPA True Price Action MT4 Indicator
168 USD InvestSoft
TPA True Price Action indicator reveals the true price action of the market makers through 100% non-repainting signals (except early signals mode) strictly at the close of a candle!
TPA shows entries and re-entries, every time the bulls are definitely stronger than the bears and vice versa. Not to confuse with red/green candles. The shift of power gets confirmed at the earliest stage and is ONE exit strategy of several. The first part of the TPA manual "The Basics" is now available (free to g

Blahtech Supply Demand
124 USD Blahtech Limited
Supply Demand uses previous price action to identify potential imbalances between buyers and sellers. The key is to identify the better odds zones, not just the untouched ones. Blahtech Supply Demand indicator delivers functionality previously unavailable on any trading platform. This 4-in-1 indicator not only highlights the higher probability zones using a multi-criteria strength engine, but also combines it with multi-timeframe trend analysis, previously confirmed swings and engulfing detector

Netsrac ADR Dashboard
59 USD Carsten Pflug
The intention of the dashboard is to provide a quick overview of the daily, weekly and monthly range of configured assets. In "single asset mode" the dashboard shows you possible reversal points directly in the chart, thus making statistics directly tradable. If a configured threshold is exceeded, the dashboard can send a screen alert, a notification (to the mobile MT4) or an email. There are various ways of using this information. One approach is that an asset that has completed nearly 100% of

Semafor 3LZZ Scanner Dashboard
60 USD Abir Pathak
3 Level ZZ Semafor Scanner:
This is a Dashboard indicator which uses 3LZZ Indicator in the background to find semafors. It will give priority to the semafors3 because they specify a strong signal. You can go through this video tutorial to see how it works: https://youtu.be/Z4v4h8U6RiM Get all extra Indicators/Template from here: https://abiroid.com/extras/semafor-3lzz-scanner-dashboard
To use this template just specify "3LZZ" in Dashboard Property: "Use Template For New Window" (without the

Bermaui Pin Bars
50 USD Muhammad Elbermawi
Bermaui Pin Bars
Or (BPB) is an indicator that find Pin Bars price action pattern on the chart. Pin Bars is a shortcut for "Pinocchio Bars" which is a classic bar pattern alternative to Japanese candlesticks with tall upper or lower shadows and very small bodies like Hammer, Inverted-Hammer, Hanging Man, Shooting Star, Dragon Fly Doji or Grave Stone Doji. Bermaui Pin Bars indicator find this pattern depending on a formula that can be explained in the next steps:
At first BPB calculate the

Lighthouse
75 USD Daniel Stein
You want to become a constantly profitable 5-star forex trader? 1. Read the basic description of our simple trading system & and it's major strategy update in 2020 2. Send a screenshot of your purchase to get your personal invitation to our exclusive trading chat
Lighthouse is an amazing precise and reliable support and resistance indicator.
It displays the most important trading levels and draws them according to their relevance.
If a level is clearly broken, it changes its rol

Bermaui Bands
50 USD Muhammad Elbermawi
Bermaui Bands (BB) is a technical analysis tool that helps filter between ranging and trending price movements. The idea behind this indicator can be explained in the next steps: Calculate Standard Deviation as an oscillator that moves between 0 and 100. I will name it Bermaui Deviation percent (BD %). If "BD %" is near zero then volatility is at its extreme. In addition, if "BD %" is near 100 then volatility is very low. High volatility means a great probability for a trending market, whi

Advanced Dashboard for Currency Strength and Speed
199 USD Bernhard Schweigert
CURRENTLY 20% OFF !! Best Solution for any Newbie or Expert Trader! This dashboard software is working on 28 currency pairs. It is based on 2 of our main indicators (Advanced Currency Strength 28 and Advanced Currency Impulse). It gives a great overview of the entire Forex market. It shows Advanced Currency Strength values, currency speed of movement and signals for 28 Forex pairs in all (9) timeframes. Imagine how your trading will improve when you can watch the entire market using a sin

FX Trend
75 USD Daniel Stein
️️️️️ You want to become a constantly profitable 5-star forex trader? ️️️️️ 1. Read the basic description of our simple trading system & and it's major strategy update in 2020 2. Send a screenshot of your purchase to get your personal invitation to our exclusive trading chat
FX Trend displays the trend direction, duration, intensity and the resulting trend rating for all time frames in real time.
You'll see at a glance at which direction the trends are running, how long
More from author

Obaforex Symbol Changer
FREE
OBAFEMI BABATUNDE DESMOND Obafemi
Seamlessly switch between different pairs from one window, while maintaining your current chart template across all pairs. This tools simply obtain all pairs in your market watch window and grant you the ease of switching between them from one window while maintaining your current chart setup and all loaded indicators and chart objects across all the pairs available in your market watch window.

Time Frame Changer
FREE
OBAFEMI BABATUNDE DESMOND Obafemi
Seamlessly switch between 13 (9 mt4 default and 4 popular custom) time frame with this tool. Real ease of switching between default and custom time frames. Note indicator does not create custom time frame chart data, it only enables you to switch to and from them. Creating a custom time frame can be done using the default mt4 period converter script attached to a lesser default mt4 time frame. Example attach period converter on M1 and set period multiplier to 10 to have a custom M10 chart.

Obaforex Tops and Bottoms
30 USD OBAFEMI BABATUNDE DESMOND Obafemi
Obaforex Tops & Bottoms is a trading tool born out of a personal need to accurately filter tops and Bottoms and ensure consistency in the way tops and bottoms are picked for technical analysis. Mt5 version https://www.mql5.com/en/market/product/55417
It does not repaint (once top or bottom is printed, it don't disappear) It only prints tops and bottoms after a specified No of bars or candles to the right
This tool is expected to significantly improve the decision making of almost any form

Obaforex TrendLine Trader
70 USD OBAFEMI BABATUNDE DESMOND Obafemi
Obaforex TrendLine Trader is a tool developed to improve trading with trend lines. It was developed initially as a personal tool to trade trendlines drawn from connecting tops and bottoms generated by obaforex Tops and Bottoms Indicator https://www.mql5.com/en/market/product/53637 This tool is highly functional and yet extremely simple and safe to use. Simply draw trendlines and make them active for trading by renaming them based on what purpose you want them to serve. buy (to open a long trade

Obaforex Tops and Bottoms mt5
30 USD OBAFEMI BABATUNDE DESMOND Obafemi
Obaforex Tops & Bottoms is a trading tool born out of a personal need to accurately filter tops and Bottoms and ensure consistency in the way tops and bottoms are picked for technical analysis. Mt4 version https://www.mql5.com/en/market/product/53637
It does not repaint (once top or bottom is printed, it don't disappear) It only prints tops and bottoms after a specified No of bars or candles to the right
This tool is expected to significantly improve the decision making of almost any form o
Filter:
No reviews