Watch the Market tutorial videos on YouTube
How to buy а trading robot or an indicator
Run your EA on
virtual hosting
virtual hosting
Test аn indicator/trading robot before buying
Want to earn in the Market?
How to present a product for a sell-through
Free Technical Indicators for MetaTrader 4 - 12

The Volume Weighted ATR indicator is a helpful tool for measuring market activity. It is based on the idea of the Volume-Weighted ATR. Combining these two elements helps identify potential turning points or breakout opportunities. The indicator for the classification of the activity of the market uses the moving average and its multiples. Accordingly, where the VWATR bar is located (relative to the moving average), it is labelled as ultra-low, low, average, high, very high or ultra high. Th
FREE
The Forex S canner I ndicator is a tool that helps traders identify and analyze 9 different strategy signals in 28 different Forex Markets. This way you can find potentially profitable trades on almost every currency exchange.
What It Does? Scan all 28 Forex Pairs at the current timeframe to find the signal. Color the button Green/Red/Yellow it finds the condition. Clicking on the button instantly changes the market.
How To Use It? Select the signal condition th
FREE

The VR Grid indicator is designed to create a graphical grid with user-defined settings. Unlike the standard grid , VR Grid is used to build circular levels . Depending on the user's choice, the step between the round levels can be arbitrary. In addition, unlike other indicators and utilities, VR Grid maintains the position of the grid even when the time period changes or the terminal is rebooted. You can find settings, set files, demo versions, instructions, problem solving, at [blog]
You can
FREE
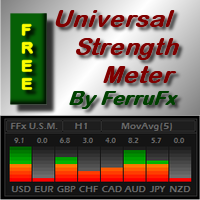
PRO version is available here: https://www.mql5.com/en/market/product/12648 FFx Universal Strength Meter is more than a basic strength meter. Instead of limiting the calculation to price, it can be based on any of the 19 integrated strength modes + 9 timeframes. With the FFx USM, you are able to define any period for any timeframe. For example, you can set the dashboard for the last 10 candles for M15… Full flexibility! Very easy to interpret... It gives a great idea about which currency is weak
FREE
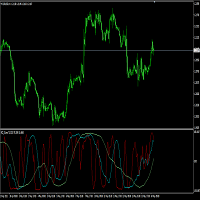
RCI is one of the technical charts and is an abbreviation that stands for "Rank Correlation Index". It is an index to judge overbought or oversold based on how much the latest stock price has risen or fallen. RCI ranks dates and prices over a period of time and indexes the correlation between -100% and + 100%. For example, if the calculation period is 9, it will be + 100% if the price continues to rise for 9, and -100% if the price continues to fall for 9. Generally, it is judged that it is over
FREE
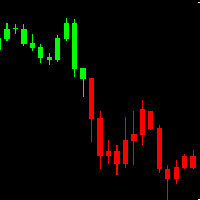
AH Candles MT4 AH Candles MT4 is a new product that allows identifying the current market phase (uptrend and downtrend ).
This indicator paints bars in different colors depending on the current state of the market trend ( Green and Red )
AH Candles MT4 is use for trading currencies
Advantages Suitable for intraday and swing trading. The indicator base on EMA method to calculate Period Parameters It can be used as a standalone tool or together with other indicators.
How to use
FREE

Fisher Yur4ik Indicator is a momentum indicator originated by Yuri Prokiev (Russian). I combined the Fisher Test indicator with other indicators to sieve/filter signals. It is not used as a standalone indicator but in combination to filter out Price Action signals. I have uploaded this indicator (Fisher test) for download alongside the 3Bar_Play signal indicator for signals to appear. It is free.
FREE

[DESCRIPTION] A Simple Moving Average with period 20 that changes color to green when the price is above the moving average and to red when the price is below the moving average. A simple moving average (SMA) calculates the average of a selected range of prices (closing prices), by the number of periods in that range. The SMA is a technical indicator that can aid in determining if an asset price will continue or reverse a bull or bear trend [WARNING AND RECOMMENDATIONS] Trading Forex and
FREE

The indicator displays two Moving Average lines on the chart with parameters specified in the settings. It issues a signal in the form of arrows and a sound at the intersection of these Moving Average. In the indicator settings, you can set the period of fast Moving Average ( Fast MA Period ) and slow Moving Average ( Slow MA Period ). And also Shift, Applied Price, Method and Timeframe for two Moving Averages separately. Important:
The main difference from oth
FREE
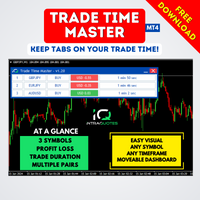
Enhance your trading precision with our revolutionary product, Trade Time Master Pro. This indicator provides unique insights into the duration of your active trades, offering a comprehensive view of their time in Days, Hours, Minutes, and Seconds. Note: It is requested that download must be refrained from if the user is from India, Bangladesh, or Pakistan, as developer support for these regions is unavailable due to legal restrictions. Indicator Features:
Time Display:
Indicator shows first
FREE

Ska ZigZag Line indicator determines the overbought and oversold regions within a trend. The indicator determines the overbought region by the candlestick high and the oversold region by the candlestick low in a form of a line. To utilize the full strategy i recommend using "Ska ZigZag Line" together with "Ska ZigZag BuySell". NOTE: This indicator is a line based indicator. HOW TO USE: Sell Signal; Place a sell trade when the Ska ZigZag BuySell indicator arrow appear on top of the Ska ZigZag Lin
FREE

SKAN This indicator helps you to scan all symbols which are in the Market Watch window and filter out a trend with alerts. It works on five most effective indicators which are used by most of traders for trading: Moving Average Super Trend (ST) Bolinger Band (BB) OPRC BFD It calculates two bars for scanning. When box colour changes to coral or royal blue colour, it indicates you for trend change for long and short entry. And also you will get alert on screen. When it changes to royal blue, it
FREE

This indicator is designed to find the difference in MOMENTUM price and indicator. This indicator shows the price and indicator difference on the screen. The user is alerted with the alert sending feature. Our Popular Products Super Oscillator HC Cross Signal Super Cross Trend Strong Trend Super Signal Parameters divergenceDepth - Depth of 2nd ref. point search Momentum_Period - Second calculation period indAppliedPrice - Applied price of indicator indMAMethod - MA calculation method findEx
FREE
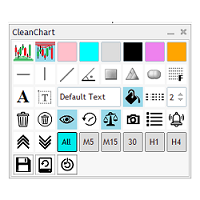
Do you get tired of having a messed up chart with chart objects from various pairs showing up on your current chart? Do you find it boring to have to click multiple clicks to update object colors and styles? Do you want to be able to load a specific set of configurations for your mostly used chart objects? Look no further, CleanChart has it all. 6 customizable Colors User configurable Support and Resistance Colors 10 mostly used chart objects Timeframe visible of any of the objects created Set m
FREE

MASi Three Screens is based on the trading strategy by Dr. Alexander Elder. This indicator is a collection of algorithms. Algorithms are based on the analysis of charts of several timeframes. You can apply any of the provided algorithms.
List of versions of algorithms:
ThreeScreens v1.0 - A simple implementation, with analysis of the MACD line; ThreeScreens v1.1 - A simple implementation, with analysis of the MACD histogram; ThreeScreens v1.2 - Combines the first two algorithms
FREE
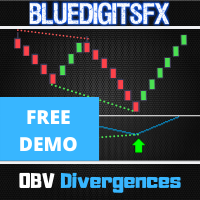
NOTE : This Free version only works for the EURUSD & AUDUSD Symbol !
MT4 Version Available Here: https://www.mql5.com/en/market/product/48040
MT5 Version Available Here: https://www.mql5.com/en/market/product/50538
Telegram Channel & Group : https://t.me/bluedigitsfx
V.I.P Group Access: Send Payment Proof to our Inbox
Recommended Broker: https://eb4.app/BDFXOsprey
* Non-Repainting Indicator To Trade Divergences for any Newbie or Expert Trader ! BlueDigitsFx's OBV Divergence
FREE

After 7 years I decided to release some of my own indicators and EAs for free.
If you find them useful please Show support with a 5-star rating! Your feedback keeps the free tools coming! See other my free tools as well here
_________________________________ Bollinger Bandwidth Indicator for Advanced Market Volatility Analysis The Bollinger Bandwidth Indicator, meticulously developed in MQL4, is a sophisticated tool designed to elevate forex trading analysis. It harnesses th
FREE

Binary options tester Trading panel to test your strategies according to the rules of binary options. Scope: Set the percentage of profit from the transaction. Set the expiration time in seconds. Set the bet size Set the Deposit amount. Make several deals in a row. Keep track of the time before expiration. The tick chart with trade levels is duplicated to an additional window for accuracy. It allows you to work both in the testing mode and in the real quotes mode. The program gives an idea of bi
FREE

Key Features: Type of Indicator: Line Break Chart Indicator Usage: Identifying trend reversals and potential market turning points. Input Parameters: The primary input parameter is 'Lines_Break,' which represents the number of lines the price needs to move to create a new line in the opposite direction. How it works: The indicator draws green and red histogram bars to represent the line break chart. Green bars indicate an upward trend, and red bars indicate a downward trend. The indicator calcul
FREE
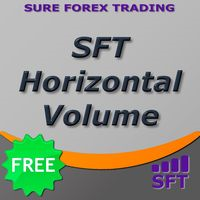
The indicator shows on the selected range tick volumes in the form of a horizontal histogram Highlights the maximum and most significant price levels near which correction and price reversals are most likely Allows you to conduct trend and counter trend trading using support and resistance levels It works on all timeframes, on any currency pairs, metals and cryptocurrency Can be used when working with binary options Distinctive features Shows the most significant levels of support and resistanc
FREE

FZR indicator determines fractal zigzag reversal pattern of all the time frames of the chosen symbol and shows the information in the Info label. Indicator draws the detected pattern in the chosen time frame and also you can select in the menu to draw the trend line according to FZR peaks. What it is FZR? See the first picture in the screenshots. As you can see for every peak of FZR the AO indicator must cross zero line. FZR indicator determines the trend direction.
How to use FZR for trading?
FREE

The support and resistance levels are among the main components of the entire technical analysis. They are used both by professional traders and by beginners. Prices usually move within the price channels. The upper boundary of such a channel is called resistance, and the lower one is support. This indicator plots fractal support and resistance lines at the highest and lowest local price values (fractals).
Distinctive features Does not redraw. Clear and understandable signals. It is possible t
FREE

Indicator Description If you need to know future volatility for trading, this indicator is what you need! With the Predictor of the ATR you trading system will be more perfect. This indicator predicts future volatility, and does it quite well. Prediction accuracy is up to 95% at a distance of up to 5 bars into the future (on the period H1). The average forecast accuracy is about 85%, the number of predicted bars is limited by your imagination only. There are five methods used for prediction. The
FREE

Targets is an indicator to determine potential turning points , targets are calculated to determine levels in which the sentiment of the market could change from "bullish" to "bearish." This indicator can be used in any timeframe and any currency pair: IN CASE YOU DON'T SEE THE INDICATOR WHEN YOU ADD IT TO YOUR CHARTS JUST OPEN THE INDICATOR MENU AND CLOSE THE MENU AGAIN PLEASE TAKE NOTICE: For best results use this indicator as an extra tools after you have completed your regular analysis an
FREE

Esse indicador mede o 1º Canal de referencia e a 1º Zona Neutra * configurar o canal macro para verificar a frequencia MAIOR H1 H4 1D * configurar o canal micro para verificar a frequencia Menor 1M 5M 15M Como instalar o Indicador fimathe. E uma pré mentoria tem uma estrategia Secreta bonus nesse video . assitao o video para enteder as logicas que podemos iniciar com esse indicador.
https://www.youtube.com/playlist?list=PLxg54MWVGlJzzKuaEntFbyI4ospQi3Kw2
FREE

MACD is well known indicator that still can be use for prediction where price will go next few minutes, hours or even weekly With colored bar of Macd, your eyes can easily catch when color is changed based what market price movement to find any early trend on market. here is the parameter of the indicator: TF_MACD , default is 1 Hour , this mean you can see clearly MACD of 1 Hour TimeFrame on Lower TimeFrame. InpPrice , default is Price Close , this is original MACD parameter from Metaquotes st
FREE

I created this simple indicator while I was learning about Rob Smith's TheStrat and find it so helpful, I thought I would share it with you. If you find it useful, please look at the other indicators I have published on MQL5. The indicator simply draws a single line on the chart showing the price level you select from a higher timeframe. Using the settings you have full control over the timeframe it displays but b y default, it calculates the higher timeframe itself, just moving up the scale by
FREE

Small free indicator to detect certain chart patterns, shoulder head shoulder / reverse, triple top / bottom, cup, flags and others... I designed it a while ago, it detects figures in m1, m5, m15, m30 and h1.
I hope it will be useful to you because I don't trade much with this indicator, I have a few others that I will try to put online quickly maybe you will find it useful, good Trade friends.
FREE

CoralDash is a simple symbol shortcut dashboard. The Symbol List has many presets to choose from: Market Watch Open Orders Current Chart Majors A custom list Clicking the symbol has two available actions Set the current chart symbol Filter the list of symbols shown in the dashboard based on one currency (e.g., see all EUR pairs) Click the "PAIR" cell in the header to toggle between the two available actions Click the symbol cell to apply the action For the filter, click the left side to selec
FREE

STOCHASTIC Dashboard Panel This indicator helps you to scan symbols which are in the Market Watch window and filter out a trend according to STOCHASTIC .
In technical analysis of securities trading, the stochastic oscillator is a momentum indicator that uses support and resistance levels. Dr. George Lane developed this indicator in the late 1950s.[1] The term stochastic refers to the point of a current price in relation to its price range over a period of time.[2] This method attempts to pr
FREE

The three white soldiers and the three black crows candlestick patterns are reversal patterns that predict a change in the direction of a trend. The pattern consists of three consecutive long-bodied candlesticks that open within the previous candle's real body and a close that exceeds the previous candle's. It's important to note that both formations are only valid when they appear after a strong uptrend or a downtrend, while their efficiency decreases in choppy markets.
Inputs AlertOn - e
FREE

The YK-LOT-SIZE is an indicator that displays the total Lot Size and profit/loss of all trade orders for the current symbol on the price chart. It has the following features: Shows the total Lot Size of buy orders (BUY) and sell orders (SELL) on separate lines. Displays the profit/loss of buy orders (BUY) and sell orders (SELL) by calculating the sum of profit, commission, and swap. Users can customize the color of the displayed text through the input parameter. The information is displayed at t
FREE

!!! In [CodeBase] I published Mql4 indicator code. Download the code for free!!! (You have to adapt the code when you update the terminal).
This indicator is a trader's tool. It shows the movement of stochastics on all periods and symbols: М1, М5, М15, М30, Н1, Н4 every minute (the time scale from the current to -240 minutes, i.e. tha last 4 hours). Step_Stoch overcomes the disadvantage of stochastic indicators - lagging. For example, a rise after a fall on H1 (or M30) after can be seen on a us
FREE

RaysFX EMA Crossover Scopri i potenziali punti di inversione del mercato con l’indicatore di Crossover EMA di RaysFX. Questo indicatore utilizza una combinazione di due medie mobili esponenziali (EMA) - una più veloce e una più lenta - per identificare i possibili punti di ingresso e uscita. Caratteristiche principali : Due EMA : Utilizza una EMA più veloce e una più lenta per catturare i movimenti di mercato a breve e lungo termine. Segnali di crossover : Genera un segnale quando l’EMA più v
FREE

This indicator monitors the vital constants of your trading account to keep it healthy and away from excessive risks. It monitors all trades, absolute exposure, account floating point and leverage currently in use, using different color codes for your interpretation. [ Installation Guide | Update Guide | Troubleshooting | FAQ | All Products ] Amazingly easy to understand The indicator is clean and simple It calculates exposure by pairs and currencies Keep your used leverage controlled at all ti
FREE

Search for an entry with low risk for trading by Lisek Waves Indicator. Using Lisek Waves Indicator can improve your trading performance. In it’s simplest form, this trading tool make it easy to s earch for an entry with low risk and to manage your trade and risk. Lisek Wave analysis is based on the notion that markets follow specific patterns called waves which are the result of a natural rhythm of crowd psychology that exists in all markets. You can avoid the loss from taking trades that are
FREE
Suitable for multi time frame market direction prediction. Green and red color indicate the buy and sell call respectively. Green indicator is denote buy call and Red indicator denote the sell call. push notification is available to send instant message to you when green or red indicator will be appear. you have to activate the option at the time of mapping this indicator to you chart
FREE
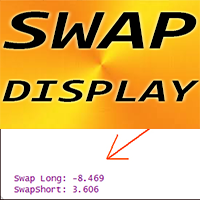
This is Free product you are welcome to use for your needs! Also, I very appreciate your positive feedbacks! Thanks a lot! // More great Expert Advisors and Indicators are available here: https://www.mql5.com/en/users/def1380/seller // Also you are welcome to join to profitable , stable and reliable signal https://www.mql5.com/en/signals/1887493 Forex Indicator SWAP Display for MT4 , Trading Support . SWAP Display indicator shows current swaps for long and short trades of forex pair
FREE

The purpose of this new version of the MT4 standard indicator provided in your platform is to display in a sub-window multiple timeframes of the same indicator. See the example shown in the picture below. But the display isn’t like a simple MTF indicator. This is the real display of the indicator on its timeframe. Here's the options available in the FFx indicator: Select the timeframes to be displayed (M1 to Monthly) Define the width (number of bars) for each timeframe box Alert pop up/sound/ema
FREE
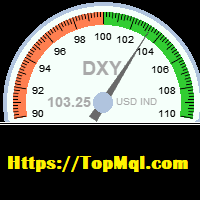
This indicator is used to calculate the dollar index according to the formula of currency pairs(EURUSD ,GBPUSD,USDJPY,USDSEK,USDCHF,USDCAD)Even if the broker does not have the dollar symbol. this Indicator displays the dollar index chart in a separate window at the bottom of the chart. It also displays the current dollar index graphically. In this indicator, it is possible to set the minimum and maximum value of the indicator as well as its size scale on the chart as an input parameter, and it
FREE

Now there is no need to check volatility on third-party websites in order to determine the average movement rage of a certain currency pair. The Truly Volatility indicator is designed for determining volatility for the specified period and is displayed in a separate window as a histogram and line. If attached to a chart with the Н1 timeframe, the indicator displays the average price movement for each hour (from 0 to 23) based on the history data. On the D1 timeframe it displays the average movem
FREE

Dies ist ein durchschnittlicher Index basierend auf einem benutzerdefinierten Algorithmus. Je nach Band können Uplink und Downlink farblich identifiziert werden. Das Pop-up-Feld kann ein- oder ausgeschaltet werden, um anzuzeigen, dass der aktuelle Kauf- oder Verkaufsauftrag platziert werden soll.
Beschreibung der Parameterliste:
Extern int price = 0; / /anfänglicher Durchschnittspreis des Indikators
Externe int length = 20; / / der Indikator berechnet den Durchschnittszeitraum,
FREE
Dear everyone, Today, I would like to introduce you to an amazing tool on the MetaTrader 4 platform - "Pivotal Moments." This indicator will be a reliable companion on your trading journey in the financial market. "Pivotal Moments" is not just an ordinary indicator, but an intelligent tool that helps you better understand significant fluctuations on the chart. With a variety of customization options, it provides valuable information and deep insights into the market. The key features of "Pivotal
FREE
The indicator shows the regression channel, in the calculation of which the gold Fibonacci section is used Levels are not built as graphical objects, but use indicator buffers - this allows using this indicator in Expert Advisors Near the channel borders price corrections and reversals are most probable Allows trend and counter trend trading within the channel The slope of the channel shows the direction of the market, and its width - the current volatility. Works on all timeframes, all currency
FREE

Pivot levels is indicator showing 7 pivot levels. It is adjusted for major use, including: all standard time frames
choice of periods to show three popular calculation formulas (typical, median, weighted) 9 level Camarilla pivot
pivot day shift choice of properties for lines and labels choice of showing alerts when crossing pivot lines Parameters: ----------Main parameters----------- Timeframe - time frame for pivot levels
Number of periods to show - displays pivot levels for number of period
FREE

The indicator searches for and displays Doji candlesticks on the chart and signals the appearance of such a candle. The direction of the signal depends on the direction of the previous candles, as the Doji signals a reversal or correction. In addition to the possibility of signaling, the power of the reversal is graphically shown (the more green, the more likely growth, the more red, the price will fall). In the indicator settings, you can change the parameters of the Doji candlestick, the closu
FREE
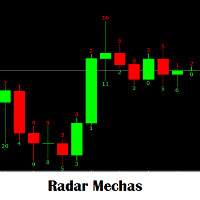
Indicator that serves to look at the size of the wick that leaves the candles according to the size that generates an alert to make manual entries. Take advantage of it to the maximum that a strategy poses vaces of the size of the wick of the previous candle or of the same current candle. to enter to buy and sell. It is an indicator that is necessary for any analysis that is taken for a new entry. It will be your favorite tool.
FREE
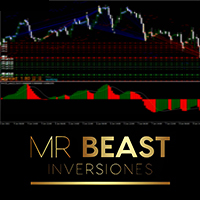
Indicador Gratuito desarrollado por Mr Beast Inversiones Mr Beast : Gestión de riesgo profesional. Brindo a la comunidad la entrada a productos de M Beast. Echar un vistazo a mis señales y expert advisors. Descuentos de hasta 70% Diclaimer: La negociación en Forex, CFD y Opciones conlleva un riesgo de pérdida sustancial y no es adecuada para todos los inversores. El alto grado de apalancamiento puede actuar en su contra y también en su favor, Antes de decidirse a operar en productos tan apalanca
FREE

There is a very simple and surprisingly effective indicator called Pi Cycle, which starts to give the first warning. It is worth a look, so as not to miss the giant elephant in the living room!))
What is Pi Cycle?
Pi Cycle is a very simple indicator created by analyst Philip Swift . It takes into account two (DMA biased moving averages ): 350-day average x 2 111-day average Both can be considered long-term indicators. The second one is obviously more sensitive to current market changes, sin
FREE

This indicator studies price action as an aggregation of price and time vectors, and uses the average vector to determine the direction and strength of the market. This indicator highlights the short-term directionality and strength of the market, and can be used to capitalize from short-term price movements by trading breakouts or binary options. [ Installation Guide | Update Guide | Troubleshooting | FAQ | All Products ] Find market direction easily Confirm with breakouts or other indicators D
FREE
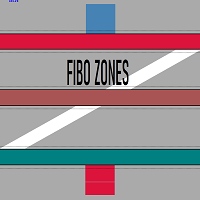
Индикатор предназначен для разметки ,фибо уровней и фибо зон.Также есть возможность удаления и редактирования уровней на текущем графике. При установке нескольких индикаторов (FIBO-ZONES)на график,не забывайте менять имя в поле (NAME).В утилите также есть возможность менять цвет зон, толщину линий и стиль линий уровней фибо. При установке индикатора ,зоны выстраиваются автоматически.
FREE

RaysFX StochRSI Presentiamo un indicatore MQL4 sviluppato da RaysFX, un rinomato sviluppatore nel campo del trading algoritmico. Questo indicatore è una combinazione semplice ma potente di due indicatori popolari: RSI e Stocastico. Caratteristiche principali: RSI : Un indicatore di momentum che misura la velocità e il cambiamento dei movimenti dei prezzi. Stocastico : Un indicatore di momentum che confronta il prezzo di chiusura di un titolo con la gamma dei suoi prezzi durante un certo periodo
FREE

Introducing MACD Jurik—an advanced indicator designed to enhance your forex trading strategy by integrating custom moving averages based on the Moving Average Convergence Divergence (MACD) with the MetaTrader 4 indicator, MACD.
Jurik moving averages are renowned for their accuracy and reliability in analyzing price movements in the forex market. They offer traders smoother representations of price action, reducing noise and providing clearer signals for identifying trends and potential revers
FREE

False Breakout Stochastic to be used with our Elliott Wave Indicator as part of the overall strategy on trading the 5th wave.
As we cannot upload multiple files, we have listed this separately. False Breakout Stochastic is best used as a confirmation tool rather than the sole signal indicator The Elliott Wave Indicator Suite is designed around a simple but effective Swing Trading Strategy. The Indicator Suite is great for Stocks, Futures and Forex trading on multiple timeframes You can find the
FREE

Индикатор отображает бары в системе High-Low-Close ( HLC ). Имеется возможность выделять бары с увеличенным объемом. Простые понятные настройки цвета, толщины баров. Входные параметры Width Line – толщина баров. Color Down Bar – цвет медвежьего бара. Color Up Bar – цвет бычьего бара. Color Undirected Bar – цвет ненаправленного бара. Volume Level (0-off) – уровень объема для показа бара с увеличенным объемом (0-отключено). Color Volume Bar – цвет бара с увеличенным объемом.
FREE
Traders Dynamic Index (TDI) Signal Input parameters: signal mode: set it to true if you want to plug it into STAT (Signal Tester and Trader) arrow shift: distance between fast EMA line to arrow on chart middle band filter price line filter RSI period RSI price method Volatility period MA period 1 MA period 2 Averaging method You can find the best setting for 4 hour EURUSD on this video
FREE

The indicator shows the maximum and minimum number of lots, as well as the size of the symbol spread. This information is needed to make a quick market entry decision based on the deposit maximum. The calculation considers free funds and funds sufficient for opening one lot. Such situations are common when you participate in various forex contests or trade in the market using your funds to the maximum, as well as during periods of increased or decreased volatility. The indicator provides the nec
FREE

Th3Eng Panda trend is a powerful indicator that works perfectly for scalping trades as well as swing trades. Th3Eng Panda trend is not just an indicator, but a very good trend filter. You can setup it on H4/H1 to Find the main trend and start scalping on M5/m15/m30 Time Frames. Works with all pairs and all Time Frames.
Inputs:
Section #1 History : Maximum number or bars to draw the last signals. (Default 5000) Draw Candles : Draw red candle when sell signal and green when buy signal. (tr
FREE

Pattern Explorer is a reliable tool for applying all the power of the most popular Japanese Candlestick Patterns . It uses Machine Learning algorithms to confirm all the patterns. What is the most impressive thing about it? Select Take Profit and Stop Loss and click on “Backtest your strategy” button to backtest your strategy in real time and to see according to your selection: Total signals Testable signals (signals that are reliable to be tested) Profitable signals (%) Loss signals (%) Total p
FREE

The RSI Arrows MTF indicator is based on the RSI indicator. Represents input signals in the form of arrows. It has 6 types of calculation. All signals are generated on the current bar of the selected period.
Signals do not redraw in the first 4 modes! But it is possible to redraw in cases of a sharp change in market movement.
All signals in MTF mode correspond to signals of the period specified in MTF. It is maximally simplified to use both for trading with only one indicator and for using
FREE

The MT4 indicator that we are describing is designed to provide traders with an alert, notification, and email when Fibonacci levels are crossed. The Fibonacci levels are calculated based on the zigzag indicator, which helps to identify potential trend reversals in the market. When the indicator detects that a price has crossed a Fibonacci level, it will trigger an alert and send a notification to the trader's MT4 mobile app. Additionally, the indicator can be configured to send an email to the
FREE

It's a simple indicator based on Moving Average. It's still a beta version. Good for a Day trader to identify market movement. No Repaint but It doesn't mean that all signals should be a win. There are no trading rules which you can gain 100%. You have to accept the losses.
Recommendations: 5 or 15 Min Any Pair Try to switch the timeframe 5 or 15 to find out best TF for your pair. Tips - Don't forget to set SL and TP. Thank you.
FREE

Indicador "Trade Zones: Supply and Demand Opportunities" para MetaTrader: Eleva tu Trading con Precisión Estratégica El indicador "Trade Zones: Supply and Demand Opportunities" es una herramienta revolucionaria diseñada para potenciar la toma de decisiones de los traders al identificar claramente las zonas de oportunidad basadas en los principios fundamentales de oferta y demanda. Este indicador, compatible con MetaTrader, proporciona una visión intuitiva de las áreas críticas del mercado donde
FREE
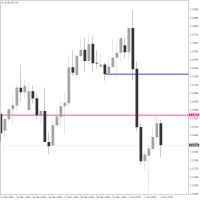
Crosshair Levels : Free version of Object Synchronizer. ** No synchronization of objects among grouped charts and no group chart features supported in this version. Are you bored to save and load template many times for the same symbol for many chart time frames? Here is the alternative. With this indicator, you enjoy creating 3 objects. All objects that you created/modified always are moved easily with clicking the object, moving cursor to the point you wanted and clicking again). Supported
FREE

An indicator for visualizing time ranges of key trading sessions: Asian, European, and American. The indicator features functionality for setting the start and end times of each trading session, as well as an adjustable timezone of the trading server. The main advantages of the indicator include the ability to operate with minimal CPU load and memory usage. Moreover, it offers the option to specify the number of displayed historical days, providing the user with flexible market dynamics analysis
FREE

The product Divergence Cci Force Stddev Ac Atr is designed to find the differences between indicators and price. It allows you to open orders or set trends using these differences. The indicator has 4 different divergence features.
Divergence types Class A Divergence Class B Divergence Class C Divergence Hidden Divergence
Product Features and Rec ommendations There are 5 indicators on the indicator Indicators = CCI, Force, Stdandard Deviation, Acelereator, Atr 4 different divergence ty
FREE

For traders, monitoring price movements is a constant activity, because each price movement determines the action that must be taken next. This simple indicator will helps traders to display prices more clearly in a larger size. Users can set the font size and choose the color that will be displayed on the chart. There are three color options that can be selected to be displayed on the chart.
FREE

BuySell Volume is an indicator that approximates Buy and Sell volumes based on price movement. Input Description: applied_model: Choose the applied model. In low reversal mode, price is considered receive low bearish pressure during bullish candle's creation (high bearish pressure on high reversal model. In other words, Bullish Marubozu candles has really high Buy Volumes in low reversal model than in high reversal one.
Output Description: Buy and Sell Volume: Determines how many Buy and Sell v
FREE
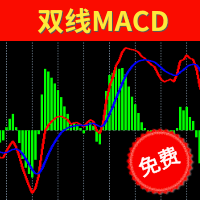
Two Lines MACD Many people who conduct technical transactions on MT4 like to use MACD to judge the turning or continuation of the market. When everyone uses the MACD indicator that comes with MT4, they find that the indicator is a single-line MACD, and the histogram seems to be similar to the past. The MACD that I understand does not match. In order to provide traders with a perfect trading experience, we especially provides free two-line MACD indicators for all traders! The single line in the
FREE
The Variations Moving Average indicator has eight types of non-standard moving averages.
Double MA - DMA Triple MA - TMA Hull MA - HMA Jurik MA - JMA Adaptive MA - AMA Fractal Adaptive MA - FAMA Volume Weighted MA - VWMA Variable Index Dynamic MA - VIDMA
Works as a trend indicator. Indicator settings Type MA Shift MA Show Trend Period MA Method MA Applied Price MA Color MA
FREE
MetaTrader Market - trading robots and technical indicators for traders are available right in your trading terminal.
The MQL5.community payment system is available to all registered users of the MQL5.com site for transactions on MetaTrader Services. You can deposit and withdraw money using WebMoney, PayPal or a bank card.
You are missing trading opportunities:
- Free trading apps
- Over 8,000 signals for copying
- Economic news for exploring financial markets
Registration
Log in
If you do not have an account, please register
Allow the use of cookies to log in to the MQL5.com website.
Please enable the necessary setting in your browser, otherwise you will not be able to log in.