
Analyzing Price Time Gaps in MQL5 (Part I): Building a Basic Indicator

In modern algorithmic trading, one of the key tasks is to detect the presence of major players in the market. Institutional investors, hedge funds, and banks leave distinctive "fingerprints" of their activities that experienced traders can learn to recognize and use in their trading. One of the most interesting and little-studied phenomena is time gaps — zones that price traverses so quickly that only an algorithm can reliably detect them.
In this article, we will look at the development of a unique indicator for MetaTrader 5 that specializes in the automatic detection and analysis of time gaps. Our main hypothesis is that when large volume enters the market, price moves through certain price zones so quickly that a time gap is created - a period when there is virtually no trading activity in that zone.
Theoretical foundations of time gaps
When a large institutional player decides to enter a position, it faces a fundamental liquidity problem. To achieve the required volume without significantly impacting the price, algorithmic execution is used, with large orders distributed over time. Hidden liquidity is also used through iceberg orders and dark pools, and the actions of multiple funds are often coordinated to synchronize entries.
The result of such activity is a situation where the price very quickly passes through a certain zone, completely "exhausting" all available liquidity. After that, the zone remains practically "empty" for a long time, since the institutional algorithms have already completed their task and switched to other price levels.
The analysis of various types of institutional influence allows us to better understand the mechanics of the formation of time gaps:
| Institutional impact type | Volume character | Execution speed | Absence duration | Typical reaction during the test |
|---|---|---|---|---|
| Hedge funds (mid-size) | USD 5-20 million | Fast (2-5 bars) | 8-15 bars | Strong rebound (75%) |
| Pension funds | USD 50-200 million | Slow (10-20 bars) | 20-40 bars | Moderate rebound (60%) |
| Central banks | USD 500+ million | Very fast (1-3 bars) | 30-60 bars | Sharp rebound (85%) |
Mathematical model
To quantify time gaps, we developed a volume-based impact coefficient (VIC), which is calculated using the formula:
VIC = (V × ΔP × LF × SF) / (T²)

where:
V - volume of trades in the zone
ΔP - price change during passage
LF - liquidity factor
SF - session activity factor
T - execution time in bars
The quadratic time dependence reflects a fundamental fact: the faster the price movement occurs with significant volume, the more likely it is that a large institutional player will influence the market. This mathematical apparatus allows for the automatic identification of zones with abnormally high transaction execution speeds.
Indicator architecture
The Volume Time Gap Analysis indicator is built on a modular architecture, including a scanning module for identifying potential impact zones, an analytical engine for calculating gap characteristics, a monitoring system for tracking active zones, and a visualization module for displaying results on a chart.
The architecture is based on the VolumeTimeGap structure, which encapsulates all the necessary time gap characteristics:
struct VolumeTimeGap
{
   datetime formation_time;           // Gap formation time
   double   price_low, price_high;    // Price zone boundaries
   double   volume_concentration;     // Concentration of volume-based impact
   double   institutional_footprint;  // Imprint of institutional impact
   double   memory_strength;          // Market memory strength
   double   liquidation_speed;        // Position liquidation speed
   int      test_count;               // Number of zone tests
   double   success_rate;             // Percentage of successful rebounds
   bool     is_active;                // Gap activity status
};
This structure contains both static parameters, determined at the moment the gap is formed, and dynamic characteristics, which are updated with each interaction of the price with the zone.
Time gap detection algorithm
The process of detecting time gaps is a complex sequence of operations. The first step is to create an adaptive grid that breaks down the current price range into analysis zones. The grid density automatically adapts to the instrument volatility and the depth of analysis.
The second stage performs a forensic-style analysis of each zone, including a detailed analysis of the time intervals of price presence and absence, calculation of volume-based characteristics, and determining the speed of entry and exit from the zone.
The third stage validates whether the collected evidence is sufficient to classify the zone as a time gap based on rigorous statistical criteria.
void ScanForVolumeTimeGaps(int analysis_depth)
{
   double highs[], lows[], opens[], closes[], volumes[];
   datetime times[];

   if(!PrepareMarketData(highs, lows, opens, closes, volumes, times, analysis_depth))
       return;

   double price_range_max = highs[ArrayMaximum(highs)];
   double price_range_min = lows[ArrayMinimum(lows)];
   double total_range = price_range_max - price_range_min;

   int grid_density = CalculateOptimalGridDensity(total_range);
   double grid_step = total_range / grid_density;

   for(int level = 0; level < grid_density; level++)
   {
       double zone_center = price_range_min + (level * grid_step);
       double zone_width = grid_step * Price_Zone_Sensitivity;

       AnalyzeZoneForVolumeGaps(zone_center - zone_width/2,
                               zone_center + zone_width/2,
                               highs, lows, opens, closes, volumes, times);
   }
}
Each potential area is subject to detailed analysis. ZoneForensics, a specialized structure, systematically accumulates evidence about the nature of price behavior in the studied zone:
struct ZoneForensics
{
   int total_appearances;            // Total number of price occurrences in the zone
   int longest_absence;              // Longest period of absence
   double volume_burst_intensity;    // Volume spike intensity
   double exit_velocity;             // Zone exit velocity
   datetime first_contact;           // Time of first contact with the zone
   datetime last_contact;            // Last contact time
};
The examination process includes the analysis of each historical bar, determining whether the price is in the studied zone, measuring the intensity of volume activity at each contact, and calculating the characteristics of the speed of entry and exit from the zone.
Evidence sufficiency criteria
The creation of a time gap occurs only when strict signal sufficiency criteria are met. The system checks the minimum duration of the absence of a price in the zone, the maximum permissible stay time, the threshold values of the volume-based impact and the speed characteristics.
bool IsEvidenceSufficientForGap(const ZoneForensics &evidence)
{
   if(evidence.longest_absence < Min_Gap_Bars) return false;
   if(evidence.total_appearances > Max_Time_In_Zone) return false;

   double volume_impact = CalculateVolumeImpactCoefficient(evidence);
   if(volume_impact < Volume_Impact_Threshold) return false;

   double velocity_score = evidence.exit_velocity / GetAverageMarketVelocity();
   if(velocity_score < VELOCITY_THRESHOLD) return false;

   double confidence_score = (volume_impact * 0.4) +
                            (velocity_score * 0.3) +
                            (evidence.longest_absence / Min_Gap_Bars * 0.3);

   return confidence_score > CONFIDENCE_THRESHOLD;
}
The overall confidence_score assessment combines three key components: volume-based impact, speed characteristics, and time duration of the gap. Only when the threshold value is exceeded is a new time gap created.
The indicator's central innovation is the calculation of the "institutional fingerprint" — a complex metric that quantitatively assesses the likelihood of a major institutional player's presence in the formation of a zone. The calculation is based on the analysis of three components: the temporal concentration of activity, the relative volume intensity and the speed characteristics of price movement.
double CalculateInstitutionalFootprint(const ZoneForensics &evidence)
{
   double speed_component = (evidence.total_appearances > 0) ?
       evidence.longest_absence / evidence.total_appearances : 0.0;

   double volume_component = evidence.volume_burst_intensity / GetAverageVolume(100);
   double velocity_component = evidence.exit_velocity / GetAverageMarketVelocity();

   return (speed_component * 0.4 + volume_component * 0.3 + velocity_component * 0.3);
}
The time component reflects the degree of concentration of trading activity over time: the greater the ratio of the absence period to the presence period, the higher the likelihood of institutional influence. The volume component normalizes trading intensity relative to average market activity, while the speed component measures the anomaly of price movement speed.
Each time gap has a dynamic "memory strength" characteristic, which reflects the degree of influence of the zone on the current price behavior. Memory strength changes over time according to a complex formula that takes into account both the natural process of market forgetting of historical events and cyclical factors of trading activity.
void UpdateGapMemoryStrength(VolumeTimeGap &gap)
{
   double time_elapsed_hours = (double)(TimeCurrent() - gap.formation_time) / 3600.0;
   double base_decay_rate = 0.05;

   double daily_cycle = MathCos(2.0 * M_PI * time_elapsed_hours / 24.0);
   double cycle_factor = 1.0 + 0.1 * daily_cycle;

   gap.memory_strength = gap.institutional_footprint *
                        MathExp(-base_decay_rate * time_elapsed_hours) *
                        cycle_factor;
}
Exponential decay models the natural process of decreasing influence of historical events on current prices. The cyclical component takes into account daily fluctuations in trading activity, reflecting the fact that the influence of institutional zones can strengthen or weaken depending on the time of the trading session.
An important element of the system is the automatic tracking of the moment of "closing" or "filling" of the time gap. This occurs when the price completely passes through the zone, demonstrating that institutional interest in this level has been exhausted.
bool IsGapBeingMitigated(double current_price, const VolumeTimeGap &gap)
{
   for(int i = 0; i < 5; i++)
   {
      double high = iHigh(_Symbol, PERIOD_CURRENT, i);
      double low = iLow(_Symbol, PERIOD_CURRENT, i);
      double open = iOpen(_Symbol, PERIOD_CURRENT, i);
      double close = iClose(_Symbol, PERIOD_CURRENT, i);

      if((high >= gap.price_high && low <= gap.price_low) ||
         (open >= gap.price_high && close <= gap.price_low) ||
         (open <= gap.price_low && close >= gap.price_high))
      {
         return true;
      }
   }
   return false;
}
When a gap closure is detected, the system automatically changes the visual display of the zone, transferring it to the "closed" status and notifying the trader about the end of the life cycle of this institutional level.
Adaptation to the specifics of different instruments
Forex instruments are characterized by high liquidity and relatively low volatility, which requires reducing Volume_Impact_Threshold to the range of 1.5-2.0 and reducing Min_Gap_Bars to 5-10 bars. The continuous nature of forex trading makes time gaps less pronounced but more stable over time.
The stock market, with its session structure and closing periods, creates natural conditions for the formation of time gaps. Recommended settings include Volume_Impact_Threshold in the range of 2.0-3.0 and Min_Gap_Bars from 8 to 15 bars. Particular attention should be paid to gaps that form during periods of corporate events and financial reporting.
Cryptocurrency markets are characterized by extreme volatility and the presence of large institutional players, which requires increasing the Volume_Impact_Threshold to 2.5-4.0 while simultaneously reducing the Min_Gap_Bars to 3-8 bars due to the high speed of price movements.
Indicator signals
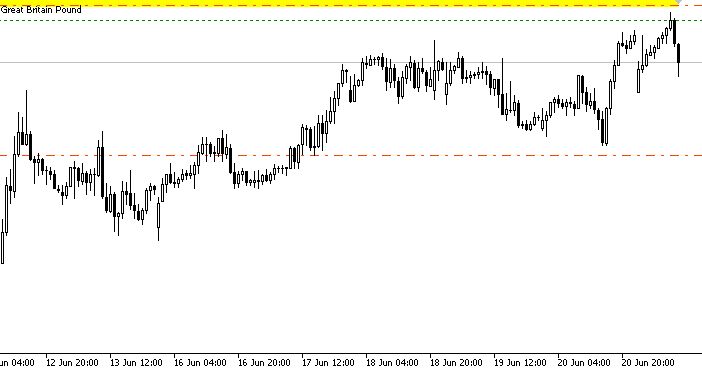
Time gaps provide unique opportunities for generating high-quality trading signals. The most effective signal is a rebound from the gap boundary when the price approaches the zone and shows signs of a reversal. The probability of a successful rebound is directly correlated with the strength of the gap memory and its statistics from previous tests.
A gap closing signal occurs when the price completely passes through the zone and can be used to trade for continuation in the direction of the move once the gap is filled. Of particular interest are false breakout signals, when an unsuccessful attempt to close a gap leads to a strong move in the opposite direction.
Rebounds have turned out the most efficient in my case:
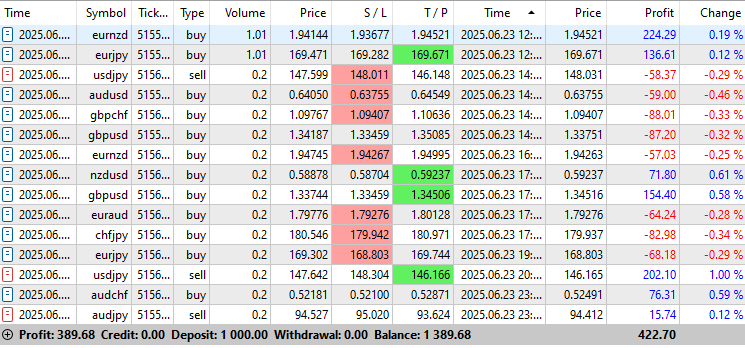
This indicator has been tested quite successfully on the account:
Conclusion and prospects
The indicator identifies zones of institutional activity using a mathematical model, market memory assessment and a notification system. It enhances the signals of other methods and helps to manage risks more precisely.
The indicator demonstrates particular efficiency as part of complex trading systems, complementing and enhancing signals from other technical analysis methods. The ability to quantify the quality of each trading signal allows for differentiated approaches to risk management and positioning.
Development plans include:
- machine learning for adaptation to specific instruments;
- new metrics based on market microstructure;
- versions for different asset classes;
- multi-timeframe analysis for building multi-level strategies.
The implementation of multi-timeframe analysis will allow us to identify hierarchical structures of time gaps, when large institutional zones on higher timeframes contain many smaller gaps on lower periods. This will open up new opportunities for building multi-level trading strategies with different planning horizons.
Translated from Russian by MetaQuotes Ltd.
Original article: https://www.mql5.com/ru/articles/18592
Warning: All rights to these materials are reserved by MetaQuotes Ltd. Copying or reprinting of these materials in whole or in part is prohibited.
This article was written by a user of the site and reflects their personal views. MetaQuotes Ltd is not responsible for the accuracy of the information presented, nor for any consequences resulting from the use of the solutions, strategies or recommendations described.

- Free trading apps
- Over 8,000 signals for copying
- Economic news for exploring financial markets
You agree to website policy and terms of use
Good day! There are warnings during compilation, I have attached a screenshot.
caused lock of mt5 terminal and data transfer; maybe my PC is so old for new type of applications