
Application of the Grey Model in Technical Analysis of Financial Time Series

Introduction
Technical analysis is one of the most important tools in trading. Based on historical data, the trader seeks to predict future price movements. However, financial markets are characterized by their unpredictability and volatility, which is why standard technical analysis methods can give false signals. In this regard, there is a need to search for new approaches that can improve the accuracy of price behavior forecasting.
In this article, we will consider one such approach – the Grey model. This model allows for more efficient analysis of market information. We will discuss the basic principles of the grey model, its practical application, as well as its main advantages and disadvantages.
Grey model
Grey modeling was proposed by Professor Deng Julong in 1982. This model is a mathematical tool for analyzing systems with incomplete information. Unlike traditional statistical models that require large amounts of data, the grey model can work with a limited set of data and still reveal hidden patterns. This is particularly valuable in financial markets, where information may be limited and the data may contain significant levels of noise.
The essence of the grey model is to transform the original non-stationary data into a smoother and more predictable sequence. This is achieved using cumulative summation, which allows trends to be highlighted and the influence of random fluctuations to be reduced. The most common is the first-order grey model - GM(1,1). From now on I will simply refer to it as GM.
To build a grey model, we first need to transform the time series. Let's assume that we want to analyze a series of 3 prices. Then, the transformation of the original time series into a grey series will look like this:
![]()
![]()
![]()
That is, the values of the grey series represent the sum of the current price and all previous ones. In short, this transformation can be written as follows:
![]()
The price can move in any direction - up, down, sideways. Under any conditions, as a result of this transformation we will obtain a strictly increasing series.

Here we come across GM's first advantage. The original time series may contain noise. Sequential summation helps smooth out noise. The longer the original time series, the weaker the influence of noise will be. This concludes the theoretical part, we can now move on to practice.
Grey indicators
So, we have built a GM - we have transformed the original time series into some other one. And now the question arises: what information can we get from this transformation? At first glance, the GM values appear to follow a linear relationship:
![]()
Here, t is a time-like index that increases from past to future:
![]()
To calculate the parameters of the linear dependence, we will use the Theil–Sen estimator. To do this, we first need to find all the values of the normalized differences:
![]()
After that, we need to find the median of these differences. It will be the most accurate estimate of the linear dependence parameter:
![]()
And this estimate, in turn, is an estimate of the average value of the original time series. This average has two interesting features. Let's assume that we decide to build an indicator with a period equal to 2. Then the estimate of the mean obtained using GM is known in advance.
![]()
![]()
![]()
If the indicator period is equal to 3, then the value of the average can also be calculated in advance. First, we build a model.
![]()
![]()
![]()
Now we calculate the values of the differences.
![]()
![]()
![]()
For any price values, the median will be their half-sum. The average price value estimate has been obtained.
![]()
But if the indicator period is 4 or more, then nothing can be calculated in advance. The only thing that can be said is that the average of the original time series can take the value of any of the prices, or any sample average, even with a shift. For example:
![]()
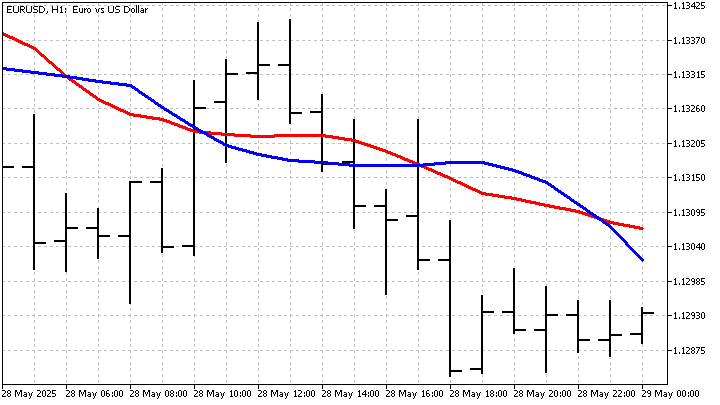
Another peculiarity of GM is its sensitivity to the order in which prices are arranged. When calculating SMA, we can rearrange the prices in any order. This will not affect the result in any way – the SMA value will remain the same. When using grey modeling, even swapping two prices can affect the linear relationship estimate and the final result. In other words, GM can distinguish between upward and downward trends, albeit implicitly. This gives us a rather unusual moving average. This is how it looks on the chart.
Using GM, we can also build more complex indicators. Let's assume that prices follow a linear trend:
![]()
Then the values of the grey series will change according to a quadratic law:
![]()
In this case, we can proceed as follows. First, estimate the parameters of the trend model using the least squares method. Then we find new estimates of the values of the grey series:
![]()
Using the last 2 values of our model, we can find the current value of the indicator:
![]()
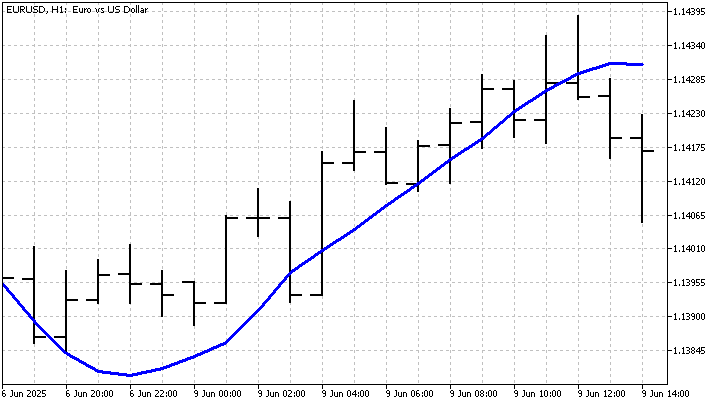
Although the final equation for the indicator looks a bit scary, the result is a linear smoothing of the original time series.
Another trend variant that can be applied to the grey series is the power trend. In this case, the values of the grey series will change according to the following formula:
![]()
The indicator built on a power-law trend does not appear to be smoothing. But it can also be useful in trading. Its main advantage is its quick response to changes in the market situation.

GM can also be used to construct analogues of some classical indicators. For example, let's recall how the CCI indicator is calculated. Leaving aside some subtleties, the essence of this indicator is very simple:
![]()
We have already learned how to build an analogue of SMA. Now, let's try to calculate the standard deviation using GM. To do this, we will proceed as follows. First, we will calculate absolute values of differences between prices and our SMA analogue:
![]()
Based on these differences, we build a new model and obtain the average of these differences. This is the value that I will use instead of the standard deviation. This is what our Grey CCI looks like.

In some areas, the new indicator lags behind, while in others it leads the standard CCI. This means that the new indicator will give completely different results in trading.
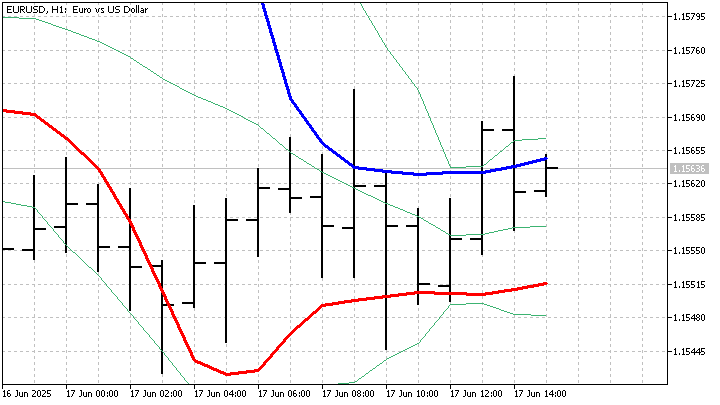
Now that we have learned how to estimate standard deviation, we can construct other indicators that use it. Let's take Bollinger Bands. We know its formula, and if we do not take into account the multiplier, it looks like this:
![]()
Due to the use of GM, the behavior of the Grey Bands indicator differs from the classic one.
Even our first encounter with the grey model showed us that it could be useful. We were able to build several new indicators. Let's see how these indicators will behave in trading.
Grey strategies
The indicators we have built look promising on the chart. Now we need to find out how useful they are in trading. Based on the GM with a linear trend, I will create a trading strategy with the following rules:
- open a buy position if the indicator rises and the price falls;
- open a sell position if the indicator falls and the price rises;
- positions are closed on the opposite signal.
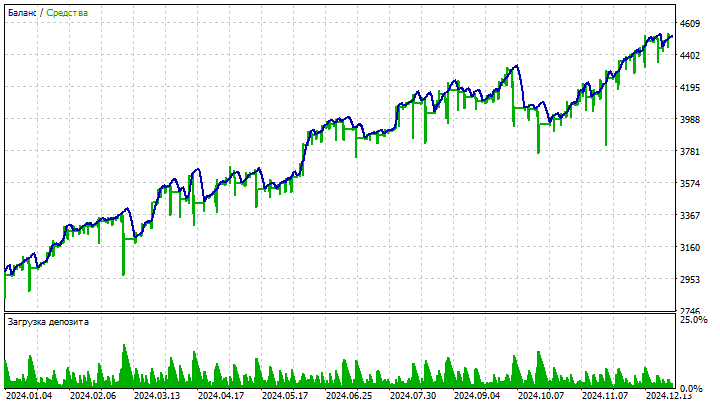
The essence of this strategy is that it tries to catch the moment when a new trend is emerging. When opening positions, I will use an additional filter - the distance between the indicator and the price should be no less than the set value. This filter allows us to discard small price fluctuations and increase the likelihood of success in trading. Despite the simplicity of the strategy, the result is quite good.

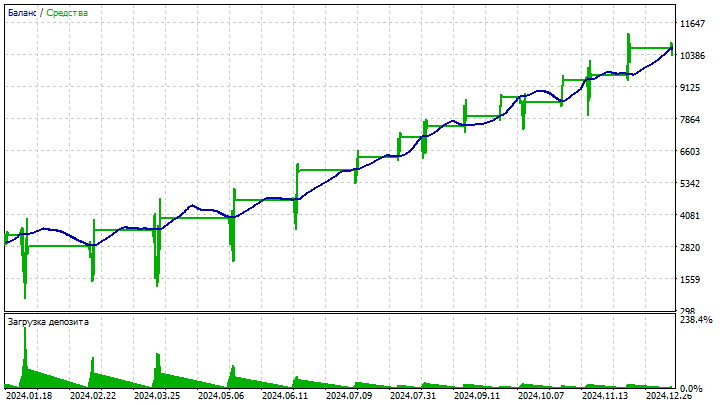
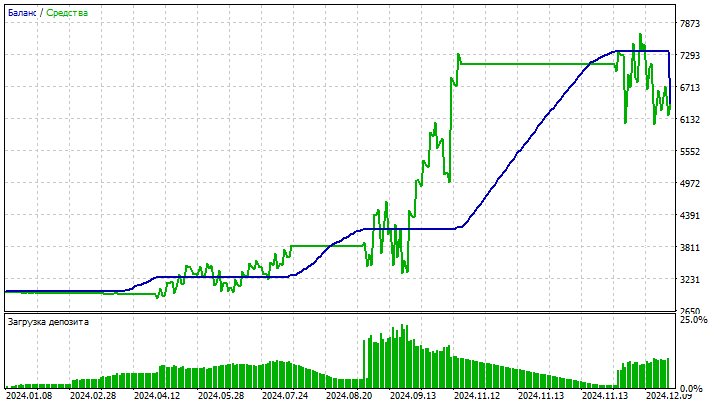
The next strategy will be similar, but I will use an indicator built on a model with a quadratic trend as the main one. Instead of prices, there is an indicator with a linear trend GM. This approach allows us to compare trend and smoothed price movements. The rules for opening and closing positions remain the same. The key feature of this strategy is its aggressiveness. The load on the deposit can be quite high. But the higher the risk, the greater the profit.
Finally, based on the Grey CCI indicator, I will create an EA that combines 2 strategies. The first strategy will only open positions when the indicator line crosses zero. The direction of the positions will depend on the direction in which this crossing occurred. The second strategy will open and close positions if the indicator value becomes higher/lower than the specified level. As an additional filter, I will compare the current indicator value with the previous one. The strategies are simple, but quite effective.
Using 2 strategies at the same time can increase the EA profitability and reduce risks. It is important to remember that, like any technical analysis tool, GM and the indicators based on it are not the "holy grail". They only provide additional information about the market. Indicator and EA parameters require careful adjustment for a specific currency pair and timeframe. For example, the Grey CCI indicator can also give the following results.
By experimenting with various parameters, a trader can find optimal values that will allow them to effectively use GM in their trading strategies.
Conclusion
The Grey model provides interesting opportunities for analyzing financial time series and constructing new indicators. Its sensitivity to price order and ability to distinguish between uptrends and downtrends make it a valuable tool in a trader's arsenal. However, like any other technical analysis tool, GM requires careful study and adaptation to specific market conditions.
The Grey model has a number of advantages. It does not require a large amount of data, is resistant to noise, and allows us to identify hidden patterns in price movements. Based on this model, various indicators can be developed that use new methods of market analysis. This allows traders to react more quickly to changing situations and find more attractive trading opportunities.
In addition, GM can be used to develop new forecasting methods that can be adapted to different market conditions. However, constructing such forecasts is associated with certain difficulties, and their description is long, tedious and boring. If you are interested, we will overcome these difficulties as well.
However, the grey model also has its drawbacks. Forecasting accuracy may decrease in conditions of high market volatility and sudden trend changes. In addition, selecting the optimal parameters may require some time to go through possible options.
When writing this article, I used the following programs.
| Name | Type | Features |
|---|---|---|
| Grey MA | indicator | The indicator uses different approaches to processing the grey series. This results in various methods of smoothing the financial time series.
|
| Grey CCI | indicator |
The indicator correction coefficient was left the same as that of the classic CCI. |
| Grey Bands | indicator |
|
| EA Grey MA | EA | The EA generates signals by comparing the price and the indicator value.
|
| EA Grey MA LQ | EA | The EA generates signals by comparing the values of 2 Grey MA indicators. |
| EA Grey CCI | EA | EA based on Grey CCI. |
Translated from Russian by MetaQuotes Ltd.
Original article: https://www.mql5.com/ru/articles/18553
Warning: All rights to these materials are reserved by MetaQuotes Ltd. Copying or reprinting of these materials in whole or in part is prohibited.
This article was written by a user of the site and reflects their personal views. MetaQuotes Ltd is not responsible for the accuracy of the information presented, nor for any consequences resulting from the use of the solutions, strategies or recommendations described.

- Free trading apps
- Over 8,000 signals for copying
- Economic news for exploring financial markets
You agree to website policy and terms of use
Interesting stuff. I wanted to test EA. Where can I find the file "Grey MA.ex5"? Thanks in advance
Hello Aleksej - the code for Grey MA is missing - there is a duplicate entry of the EA.
Hello Alexey - there is no code for Grey MA - there is a duplicate EA entry.