
Beyond Maximum Drawdown: Building a Drawdown DNA Analyzer in MQL5

Introduction
A while ago I ran two of my own strategies side by side, and both reported almost the same headline figure: a maximum drawdown of roughly 18%. On paper they looked like twins. In practice, they were nothing alike. One of them fell hard, then clawed its way back to a new equity high in about two weeks. The other drifted lower in small steps and stayed below its previous peak for the better part of four months. The number on the report was the same. The experience of holding each one was not.
That gap is the problem this article is about. Maximum drawdown is the single statistic most traders quote when they describe risk, yet it compresses a rich, time-based story into one number. It tells you how far the equity fell from its highest point. It says nothing about how often that happened, how long the account stayed underwater, or how quickly it came back.
In this article we will build a script that reads a daily closed-profit series, rebuilds an equity curve from it, and dissects the full structure of its declines. I will refer to that structure as the drawdown DNA: the depth, the frequency, the duration, and the recovery profile that together describe how an equity curve actually behaves in a downturn. By the end, you will have a working analyzer that
- Rebuilds the equity curve and its underwater curve from a daily profit-and-loss file.
- Splits the underwater curve into discrete drawdown episodes, each with its own depth, duration, and recovery time.
- Computes the Ulcer Index, the Pain Index, the Recovery Factor, and the share of time spent below a previous peak.
- Combines those measurements into a single resilience score, graded from A+ to F, with written recommendations.
Everything runs natively inside MetaTrader 5. There are no external libraries, no Python, and no machine learning. The whole tool is a single MQL5 script plus a small helper that exports the data from a backtest.
Why Maximum Drawdown Is Not Enough
Let us make the opening example concrete. Suppose two strategies are tested over the same period and the same account size, and both reach a maximum drawdown of 18%. Consider how differently they can get there:
- Strategy A has one deep decline. It loses 18% over three weeks, then recovers to a new high within two weeks. For the rest of the year, it trades near its peak.
- Strategy B never falls 18% in a single move. Instead, it grinds down in a long series of small losses, spends seven months below its previous peak, and only touches 18% at the very bottom of that long slide.
Both report the same maximum drawdown. A risk filter that looks only at that number would treat them as equal. They are not. Strategy A is a sharp shock followed by a clean recovery. Strategy B is a slow bleed that keeps an account underwater for most of the year, which is far harder to hold and far more likely to make a trader abandon the system at the worst possible moment.
The point is simple. A drawdown you can sit through is survivable. A drawdown that lasts for months tests your discipline, and it tests the patience of anyone whose money you manage. To tell these two cases apart, we need to look past the single worst point and measure the shape of the whole decline.

Fig. 1. Two equity curves with the same maximum drawdown but very different recovery profiles.
The Anatomy of a Drawdown
Before writing any code, we need a precise vocabulary. Every drawdown is bounded by three reference points on the equity curve:
- The peak, also called the high-water mark, is the highest equity reached before the decline begins.
- The trough: the lowest equity reached during the decline.
- The recovery point: the moment equity returns to the old peak and sets a new high.
From those three points, we derive the measurements that describe a single episode:
- Depth, the size of the decline from peak to trough, expressed as a percentage of the peak.
- Drawdown duration: the time from the peak to the trough, counted in records, that is, the trading days present in the file.
- Recovery duration: the time from the trough back to the old peak, counted in records.
- Underwater period: the total time from the peak to full recovery, that is, the sum of the previous two.
Plotting the distance below the running peak at every point produces the underwater curve. It sits at zero whenever the account is at a new high, and it dips into negative territory during every decline. The deepest dip is the maximum drawdown, but the curve as a whole carries the rest of the story: how many dips there are, how deep they run, and how long each one takes to return to the surface.

Fig. 2. The reference points and measurements of a single drawdown episode.
The Metrics That Matter
A single episode is easy to describe. The harder task is summarizing a whole equity curve, which usually contains many drawdowns of different sizes. The analyzer reports the following measurements.
Maximum and average depth. The maximum drawdown is the deepest single decline. The average drawdown is the mean depth across all episodes, which tells you what a typical decline looks like rather than the worst one.
Frequency and longest underwater period. The number of distinct episodes shows how often the strategy slips below a previous peak. The longest underwater period is the single most important duration figure: the most consecutive days the account ever spent without making a new high.
Time underwater. This is the share of all days on which the account was below a previous peak. A strategy that spends 30% of its life underwater feels very different from one that spends 70% underwater, even if their maximum drawdowns match.
Ulcer Index. Introduced by Peter Martin in 1987 and later described in the book he wrote with Byron McCann, the Ulcer Index measures the depth and the persistence of declines in one figure. It is the root mean square of the underwater depths:
Ulcer Index = sqrt((1 / n) * Sum(D_i^2)).
Here D_i is the percentage drawdown on day i, and n is the number of days. Because each depth is squared before being averaged, the Ulcer Index grows quickly when drawdowns are both deep and long-lasting, and it stays low when declines are shallow and brief. Unlike standard deviation, it ignores upside moves entirely, so it only penalizes the pain a trader actually feels.
Pain Index. The Pain Index is the mean of the daily underwater depths, taken across every record:
Pain Index = (1 / n) * Sum(D_i)
It is easier to interpret than the Ulcer Index because it is expressed directly in percentage points, and it answers a plain question: on an average day, how far below the peak does the account sit? It is sometimes loosely called the average drawdown, but it differs from the average episode depth across episodes reported earlier: the Pain Index averages the underwater value on every record, including the days at zero, while the average episode depth averages only the troughs.
Recovery Factor. The Recovery Factor relates the reward to the worst decline:
Recovery Factor = Net Profit / Maximum Drawdown (in money)
A Recovery Factor of 5 means the strategy earned five times its deepest loss over the test. It is the same figure the Strategy Tester reports, and it is a useful sanity check on whether the returns justify the risk taken to produce them. A value below 1 means the net profit is smaller than the deepest loss, and a negative value means the strategy did not recover its deepest loss over the period analyzed.
The table below summarizes what each measurement captures and what it leaves out, so they are read together rather than in isolation.
| Metric | Captures | Misses |
|---|---|---|
Maximum Drawdown: | The single worst peak-to-trough loss. | Frequency and persistence of declines. |
| Time underwater: | How often and how long the account is below a peak. | How deep those declines are. |
| Ulcer Index: | Depth and persistence together. | The structure of individual episodes. |
| Pain Index: | The average daily underwater value. | The extremes are hidden in the average. |
| Recovery Factor: | Reward relative to the worst loss. | The time the recovery took. |
An Important Limitation: Closed Daily Profit, Not Floating Equity
One limitation must be stated plainly because it shapes how every number here should be read. The analyzer works from a daily series of closed profit and loss. It reconstructs a balance-like equity path by adding each day's closed result to the starting capital. It is not the floating equity of the account.
Two consequences follow. First, the tool does not see intraday drawdowns: a position that fell deep during the day but closed near breakeven leaves no trace in a daily closed-PnL series. Second, it does not see the open-position drawdown of a trade that stays open across several days and is closed later; the loss appears on the closing day, not while it was building. Therefore, this underwater curve reflects drawdowns of a closed-equity path sampled daily. This is a useful and common view, but it differs from tick-by-tick floating-equity drawdowns.
It also means the durations are measured in records, the trading days present in the file, not calendar days. To analyze the true floating-equity drawdown instead, you would feed the tool an equity snapshot series (a date and the account equity per bar or per timer) rather than closed daily PnL; the same engine then applies unchanged.
Architecture of the Drawdown DNA Analyzer
The complete solution is a single MQL5 script organized into four logical modules, supported by one helper script:
- Data Loader: Reads the daily profit-and-loss values from a CSV file.
- Underwater Engine: Rebuilds the equity curve, the high-water mark, and the underwater curve, then splits the underwater curve into discrete episodes.
- Risk Metrics: Computes the Ulcer Index, the Pain Index, the Recovery Factor, and the time underwater.
- Resilience Score: Combines the measurements into a weighted score and a grade, then prints recommendations.
We will build each module in turn, then assemble them in the main script. Let us start with the data the analyzer expects.
A note on the accompanying files: the main script (DrawdownDNA.mq5) contains all four modules and prints the full report. Each module is also provided as a standalone script for compilation and study: DataLoader.mq5 (Module 1), UnderwaterEngine.mq5 (Module 2), and RiskMetrics.mq5 (Module 3). The helper Utility_ExportDailyEquity.mq5 exports the input CSV from the trade history. Each standalone file includes a short demo and can be compiled and run on its own.
Module 1: The Data Loader
This module is also provided on its own as the standalone script DataLoader.mq5. The analyzer works from a simple CSV file with one row per trading day and two columns: the date and the profit or loss closed on that day. A header line names the columns. This format can be produced from any backtest with very little work, and later in the article we will add a helper that writes it automatically.
We begin with the script properties, the input parameters, and the two data structures the tool uses. One structure describes a single drawdown episode; the other holds the aggregated report.
//--- Input parameters
input string InpFileName     = "EquityCurve.csv";  // CSV file: Date,DailyPnL
input double InpStartCapital = 10000.0;            // Starting capital
input double InpMinDepthPct  = 1.0;                // Ignore drawdowns shallower than this (%)
input double InpWeightDepth  = 0.40;               // Weight: depth dimension
input double InpWeightRecov  = 0.30;               // Weight: recovery dimension
input double InpWeightUlcer  = 0.30;               // Weight: stability dimension
input double InpDepthFactor  = 2.0;                // Depth score: points lost per 1% of max drawdown
input double InpUlcerFactor  = 5.0;                // Stability score: points lost per 1.0 of Ulcer Index

//--- One drawdown episode: peak -> trough -> recovery
struct SEpisode
  {
   int      peakIdx;        // record at the high-water mark the episode is measured from
   int      troughIdx;      // record of the deepest point
   int      recoveryIdx;    // record the equity reached the old peak again (-1 if never)
   datetime peakTime;       // date of the peak record
   datetime troughTime;     // date of the trough record
   datetime recoveryTime;   // date of the recovery record (0 if never recovered)
   double   depthPct;       // deepest decline of the episode, in percent
   double   depthMoney;     // deepest decline of the episode, in account currency
   int      ddDuration;     // peak -> trough, in records (trading days in the file)
   int      recDuration;    // trough -> recovery, in records (-1 if still ongoing)
   int      underwaterLen;  // peak -> recovery, or peak -> end of data if ongoing, in records
   bool     recovered;      // true if the old peak was reached again
  };

//--- Aggregated report
struct SDrawdownReport
  {
   int    nDays;              // number of records (trading days) in the file
   int    nEpisodes;          // number of drawdown episodes detected
   double maxDepthPct;        // deepest drawdown over the whole curve, in percent
   double maxDepthMoney;      // deepest drawdown over the whole curve, in account currency
   double avgDepthPct;        // average episode depth, in percent
   int    longestUnderwater;  // longest underwater stretch, in records
   int    avgRecovery;        // average trough -> recovery time of recovered episodes, in records
   double timeUnderwaterPct;  // share of records spent below a previous peak, in percent
   double ulcerIndex;         // root mean square of the daily underwater depths
   double painIndex;          // mean of the daily underwater depths
   double recoveryFactor;     // net profit divided by the deepest drawdown in money
   double netProfit;          // final equity minus the starting capital
   double depthScore;         // depth dimension of the score, 0..100
   double recovScore;         // recovery dimension of the score, 0..100
   double ulcerScore;         // stability dimension of the score, 0..100
   double resilience;         // composite resilience score, 0..100
   string grade;              // letter grade from A+ to F
   bool   hasOngoing;         // true if a drawdown was still open at the end of the data
  };

//--- Global series (one entry per record)
double   g_pnl[];      // daily profit/loss read from the file
datetime g_dates[];    // date of each record
double   g_equity[];   // running equity: starting capital plus cumulative PnL
double   g_peak[];     // running high-water mark up to each record
double   g_ddPct[];    // drawdown from the peak at each record, in percent
double   g_ddMoney[];  // drawdown from the peak at each record, in account currency
int      g_hwmIdx[];   // index of the most recent high-water mark, per record
int      g_n = 0;      // number of records loaded
The loader reads the file as text and parses each line, which is more robust against blank lines, stray spaces, and encoding quirks than reading field by field. Each row is split on the comma into a date and a value, the header line is skipped, and rows whose date does not parse are ignored. Both the value and its date are stored, so every episode can later be reported with the real calendar dates of its peak, trough, and recovery.
//+------------------------------------------------------------------+
//| Read a Date,DailyPnL file into the pnl and date arrays           |
//| Read as text and parse each line, which is more robust than      |
//| field-by-field CSV reading against blank lines and stray spaces. |
//+------------------------------------------------------------------+
bool LoadEquitySeries(string filename, double &pnl[], datetime &dates[])
  {
   int handle = FileOpen(filename, FILE_READ|FILE_TXT|FILE_ANSI);
   if(handle == INVALID_HANDLE)
     {
      PrintFormat("Could not open %s. Error: %d", filename, GetLastError());
      return false;
     }

   int  count = 0;
   bool firstLine = true;
   while(!FileIsEnding(handle))
     {
      string row = FileReadString(handle);
      StringTrimLeft(row);
      StringTrimRight(row);

      if(firstLine)  // the first line is the header
        {
         firstLine = false;
         continue;
        }
      if(row == "")  // skip blank lines
         continue;

      string parts[];
      if(StringSplit(row, ',', parts) < 2)
         continue;
      StringTrimLeft(parts[0]);
      StringTrimRight(parts[0]);

      datetime d = StringToTime(parts[0]);
      if(d <= 0)  // skip rows whose date does not parse
         continue;
      double value = StringToDouble(parts[1]);

      count++;
      ArrayResize(pnl, count, 256);
      ArrayResize(dates, count, 256);
      pnl[count - 1]   = value;
      dates[count - 1] = d;
     }

   FileClose(handle);
   return (count > 0);
  }
Reading only the daily result keeps the input small and portable. The equity curve itself is reconstructed in the next module, which means the same file can be reanalyzed with a different starting capital without editing the data.
Module 2: The Underwater Engine
Provided on its own as UnderwaterEngine.mq5, this module turns a list of daily results into the three series the analysis depends on: the running equity, the high-water mark, and the underwater curve. The high-water mark is simply the highest equity seen so far; the underwater value is the distance below it.
//+------------------------------------------------------------------+
//| Build the equity, high-water mark, underwater and HWM-index data |
//+------------------------------------------------------------------+
void BuildSeries(const double &pnl[], int n, double capital,
                 double &equity[], double &peak[], double &ddPct[],
                 double &ddMoney[], int &hwmIdx[])
  {
   ArrayResize(equity, n);
   ArrayResize(peak, n);
   ArrayResize(ddPct, n);
   ArrayResize(ddMoney, n);
   ArrayResize(hwmIdx, n);

   double run = capital;
   double hwm = capital;  // high-water mark
   int    hi  = 0;        // record of the most recent high-water mark
   for(int i = 0; i < n; i++)
     {
      run += pnl[i];
      equity[i] = run;
      if(run >= hwm)  // a new high (or a tie) moves the peak record forward
        {
         hwm = run;
         hi  = i;
        }
      peak[i]    = hwm;
      hwmIdx[i]  = hi;
      ddMoney[i] = hwm - run;
      ddPct[i]   = (hwm > 0.0) ? (ddMoney[i] / hwm * 100.0) : 0.0;
     }
  }
With the underwater curve in hand, we split it into episodes. The logic walks the curve from left to right. Whenever equity drops below the running peak, a new episode opens. The function then tracks the deepest point until equity climbs back to that peak, at which moment the episode closes and is recorded. If the data ends while the account is still below a previous peak, the last episode is marked as ongoing rather than unrecovered because pretending it has recovered would understate the real risk.
//+------------------------------------------------------------------+
//| Split the underwater curve into discrete drawdown episodes       |
//+------------------------------------------------------------------+
int DetectEpisodes(const double &equity[], const double &peak[], const double &ddPct[],
                   const double &ddMoney[], const datetime &dates[], const int &hwmIdx[],
                   int n, double minDepth, SEpisode &eps[])
  {
   int    nEp = 0;
   double tol = 1e-8;
   ArrayResize(eps, 0);

   int i = 0;
   while(i < n)
     {
      if(ddPct[i] > tol)
        {
         //--- The peak day is the record of the high-water mark this decline measures from.
         int    startPeak = hwmIdx[i];
         if(startPeak < 0)
            startPeak = 0;
         double curPeak   = peak[i];
         int    troughIdx = i;
         double maxDd     = ddPct[i];

         int j = i;
         while(j < n && equity[j] < curPeak - tol)
           {
            if(ddPct[j] > maxDd)
              {
               maxDd     = ddPct[j];
               troughIdx = j;
              }
            j++;
           }

         SEpisode e;
         e.peakIdx    = startPeak;
         e.troughIdx  = troughIdx;
         e.peakTime   = dates[startPeak];
         e.troughTime = dates[troughIdx];
         e.depthPct   = maxDd;
         e.depthMoney = ddMoney[troughIdx];
         e.ddDuration = troughIdx - startPeak;

         if(j < n)
           {
            e.recovered     = true;
            e.recoveryIdx   = j;
            e.recoveryTime  = dates[j];
            e.recDuration   = j - troughIdx;
            e.underwaterLen = j - startPeak;
           }
         else
           {
            e.recovered     = false;
            e.recoveryIdx   = -1;
            e.recoveryTime  = 0;
            e.recDuration   = -1;                   // not recovered: no recovery time exists
            e.underwaterLen = (n - 1) - startPeak;  // days elapsed since the peak, still open
           }

         if(e.depthPct >= minDepth)
           {
            nEp++;
            ArrayResize(eps, nEp);
            eps[nEp - 1] = e;
           }

         i = (j < n) ? j : n;
        }
      else
         i++;
     }
   return nEp;
  }
Two design choices are worth noting. First, episodes shallower than a configurable threshold are ignored, so a single tick of noise does not register as a drawdown. Second, an ongoing episode at the end of the series is reported honestly as unrecovered because pretending it has recovered would understate the real risk.
To make the result easy to read at a glance, the tool also prints a text version of the underwater curve in the Experts tab. Each column is a slice of time, and the rows show increasing depth, so the shape of the declines is visible without opening a chart.
//+------------------------------------------------------------------+
//| Draw an ASCII underwater chart in the Experts tab                |
//+------------------------------------------------------------------+
void PrintUnderwaterChart(const double &ddPct[], int n, double maxDepth)
  {
   int cols = 50;
   int rows = 8;

   double bucket[];
   ArrayResize(bucket, cols);
   ArrayInitialize(bucket, 0.0);

   for(int c = 0; c < cols; c++)
     {
      int a = (int)MathFloor((double)c * n / cols);
      int b = (int)MathFloor((double)(c + 1) * n / cols);
      if(b <= a)
         b = a + 1;
      double mx = 0.0;
      for(int i = a; i < b && i < n; i++)
         if(ddPct[i] > mx)
            mx = ddPct[i];
      bucket[c] = mx;
     }

   double scale = (maxDepth > 0.0) ? maxDepth : 1.0;
   Print("Underwater curve (deeper is lower, each column is a time bucket):");
   for(int rr = 1; rr <= rows; rr++)
     {
      double level = scale * rr / rows;
      string line  = StringFormat("%5.1f%%|", level);
      for(int c = 0; c < cols; c++)
         line += (bucket[c] >= level - 1e-9) ? "#" : ".";
      Print(line);
     }
  }
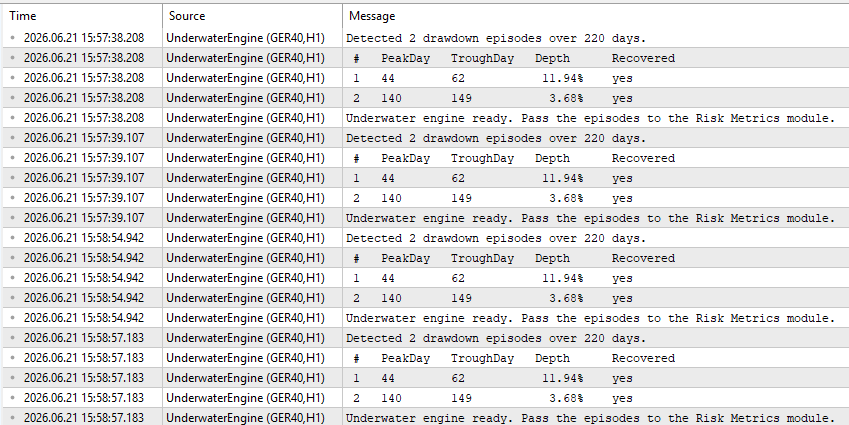
Fig. 3. ASCII underwater chart and the table of drawdown episodes in the Experts tab.
Module 3: The Risk Metrics
This module is also supplied on its own as RiskMetrics.mq5. With the underwater curve available as an array of daily depths, the summary metrics are short to compute. The Ulcer Index is the root mean square of those depths; the Pain Index is their simple average. The recovery factor and the time underwater are computed alongside the episode aggregation in the next step because they reuse values that the report already collects. Keeping each metric in a small, self-contained function makes the tool easy to test: you can feed any depth array into these routines and check the result by hand on a few values.
//+------------------------------------------------------------------+
//| Ulcer Index: root mean square of the underwater depths           |
//+------------------------------------------------------------------+
double UlcerIndex(const double &ddPct[], int n)
  {
   if(n <= 0)
      return 0.0;
   double sum = 0.0;
   for(int i = 0; i < n; i++)
      sum += ddPct[i] * ddPct[i];
   return MathSqrt(sum / n);
  }

//+------------------------------------------------------------------+
//| Pain Index: average underwater depth across every record         |
//+------------------------------------------------------------------+
double PainIndex(const double &ddPct[], int n)
  {
   if(n <= 0)
      return 0.0;
   double sum = 0.0;
   for(int i = 0; i < n; i++)
      sum += ddPct[i];
   return sum / n;
  }
Module 4: The Resilience Score
The final module condenses everything into one number. The design question is how to weight the different aspects of drawdown behavior. After testing across several equity curves, three dimensions proved to capture most of what separates a comfortable strategy from an uncomfortable one:
- Depth (40%): Driven by the maximum drawdown, shallower worst-case declines score higher.
- Recovery (30%): Driven by the time spent underwater. Curves that return to new highs quickly score higher.
- Stability (30%): Driven by the Ulcer Index, which rewards declines that are both shallow and short.
Each dimension is mapped to a 0–100 scale, combined with its weight, and translated into a letter grade. The weights are inputs, so you can tune them to match your own tolerance, for example, raising the recovery weight if long underwater periods are what you fear most.
It is important to be clear about what this score is. It is a heuristic for quick comparisons within the same strategy set, test horizon, and sampling method. Furthermore, it is not an industry-standard metric. The three weights, the per-dimension scaling factors (how many points are lost per unit of maximum drawdown and per unit of Ulcer Index, both exposed as inputs), and the A–F boundaries are configurable defaults rather than statistically derived constants. Different strategy styles have different natural underwater profiles, so a trend-following system and a mean-reversion system are best compared on their own terms rather than against a single universal scale.
//+------------------------------------------------------------------+
//| Aggregate the episodes and metrics into a single report          |
//+------------------------------------------------------------------+
void BuildReport(const SEpisode &eps[], int nEp, const double &ddPct[], int n,
                 const double &equity[], double capital, SDrawdownReport &r)
  {
   r.nDays             = n;
   r.nEpisodes         = nEp;
   r.maxDepthPct       = 0.0;
   r.maxDepthMoney     = 0.0;
   r.longestUnderwater = 0;
   r.hasOngoing        = false;

   double sumDepth = 0.0;
   int    sumRec = 0, recCount = 0;

   for(int k = 0; k < nEp; k++)
     {
      if(eps[k].depthPct > r.maxDepthPct)
         r.maxDepthPct = eps[k].depthPct;
      if(eps[k].depthMoney > r.maxDepthMoney)
         r.maxDepthMoney = eps[k].depthMoney;
      sumDepth += eps[k].depthPct;
      if(eps[k].underwaterLen > r.longestUnderwater)
         r.longestUnderwater = eps[k].underwaterLen;
      if(eps[k].recovered)
        {
         sumRec += eps[k].recDuration;
         recCount++;
        }
      else
         r.hasOngoing = true;
     }

   r.avgDepthPct = (nEp > 0)      ? sumDepth / nEp : 0.0;
   r.avgRecovery = (recCount > 0) ? (int)MathRound((double)sumRec / recCount) : 0;

   int underwaterDays = 0;
   for(int i = 0; i < n; i++)
      if(ddPct[i] > 1e-8)
         underwaterDays++;
   r.timeUnderwaterPct = (n > 0) ? 100.0 * underwaterDays / n : 0.0;

   r.ulcerIndex     = UlcerIndex(ddPct, n);
   r.painIndex      = PainIndex(ddPct, n);
   r.netProfit      = equity[n - 1] - capital;
   r.recoveryFactor = (r.maxDepthMoney > 0.0) ? r.netProfit / r.maxDepthMoney : 0.0;

   //--- Dimension scores (higher means more resilient). The factors are inputs.
   r.depthScore = MathMax(0.0, 100.0 - r.maxDepthPct * InpDepthFactor);
   r.recovScore = MathMax(0.0, 100.0 - r.timeUnderwaterPct);
   r.ulcerScore = MathMax(0.0, 100.0 - r.ulcerIndex * InpUlcerFactor);

   //--- Normalize the weights so the result does not depend on their sum
   double wd = MathMax(0.0, InpWeightDepth);
   double wr = MathMax(0.0, InpWeightRecov);
   double wu = MathMax(0.0, InpWeightUlcer);
   double wsum = wd + wr + wu;
   if(wsum <= 0.0)
     {
      wd = 0.40; wr = 0.30; wu = 0.30; wsum = 1.0;
      Print("Warning: weights were non-positive; reverting to the 0.40 / 0.30 / 0.30 default.");
     }
   wd /= wsum; wr /= wsum; wu /= wsum;

   r.resilience = r.depthScore * wd + r.recovScore * wr + r.ulcerScore * wu;

   if(r.resilience >= 90)      r.grade = "A+";
   else if(r.resilience >= 80) r.grade = "A";
   else if(r.resilience >= 70) r.grade = "B";
   else if(r.resilience >= 60) r.grade = "C";
   else if(r.resilience >= 50) r.grade = "D";
   else                        r.grade = "F";
  }
The grade is deliberately coarse. Its job is not to rank two strategies that are three points apart, but to flag at a glance whether an equity curve is comfortable to hold (A or B), workable with care (C or D), or a problem that needs attention (F).
The Main Script: Putting It All Together
The OnStart function ties the modules together. It loads the file, and if no file is found, it generates a sample curve so the script runs out of the box. It then builds the series, detects the episodes, computes the report, and prints the underwater curve, the episode table, the metrics, the score, and the recommendations.
//+------------------------------------------------------------------+
//| Script entry point                                               |
//+------------------------------------------------------------------+
void OnStart()
  {
   Print("========================================");
   Print("  DRAWDOWN DNA ANALYZER v1.1");
   Print("  Underwater, Recovery and Resilience Tool");
   Print("========================================");

   if(!LoadEquitySeries(InpFileName, g_pnl, g_dates))
     {
      Print(">> File not found or empty. Generating a sample curve...");
      if(!EnsureSampleFile(InpFileName))
        {
         Alert("Could not create the sample file.");
         return;
        }
      if(!LoadEquitySeries(InpFileName, g_pnl, g_dates))
        {
         Alert("Could not load the sample file.");
         return;
        }
     }

   g_n = ArraySize(g_pnl);
   if(g_n < 20)
     {
      Alert("At least 20 daily records are required.");
      return;
     }

   BuildSeries(g_pnl, g_n, InpStartCapital, g_equity, g_peak, g_ddPct, g_ddMoney, g_hwmIdx);

   SEpisode eps[];
   int nEp = DetectEpisodes(g_equity, g_peak, g_ddPct, g_ddMoney, g_dates, g_hwmIdx, g_n, InpMinDepthPct, eps);

   SDrawdownReport rep;
   BuildReport(eps, nEp, g_ddPct, g_n, g_equity, InpStartCapital, rep);

   Print("\nNote: this analysis is built from a daily closed-PnL path, not floating equity.");
   Print("It does not see intraday drawdowns or open-position drawdowns of trades closed later.");

   //--- Underwater curve
   Print("");
   PrintUnderwaterChart(g_ddPct, g_n, rep.maxDepthPct);

   //--- Episode table, now with real dates
   PrintFormat("\n=== DRAWDOWN EPISODES (depth >= %.1f%%) ===", InpMinDepthPct);
   Print(" #   Depth      Peak         Trough        Recovery      UWdays");
   for(int k = 0; k < nEp; k++)
     {
      string recDate = eps[k].recovered ? TimeToString(eps[k].recoveryTime, TIME_DATE) : "ongoing";
      PrintFormat(" %-3d %6.2f%%  %s  %s  %-11s  %d",
                  k + 1, eps[k].depthPct,
                  TimeToString(eps[k].peakTime, TIME_DATE),
                  TimeToString(eps[k].troughTime, TIME_DATE),
                  recDate, eps[k].underwaterLen);
     }

   //--- Risk metrics
   Print("\n=== RISK METRICS ===");
   PrintFormat(" Max drawdown:        %.2f%%  ($%.2f)", rep.maxDepthPct, rep.maxDepthMoney);
   PrintFormat(" Average drawdown:    %.2f%%   (mean depth across episodes)", rep.avgDepthPct);
   PrintFormat(" Drawdown episodes:   %d", rep.nEpisodes);
   PrintFormat(" Longest underwater:  %d records", rep.longestUnderwater);
   PrintFormat(" Avg recovery time:   %d records", rep.avgRecovery);
   if(rep.hasOngoing)
      Print("   (Average recovery excludes the ongoing, not-yet-recovered drawdown.)");
   PrintFormat(" Time underwater:     %.1f%%", rep.timeUnderwaterPct);
   PrintFormat(" Ulcer Index:         %.2f   (RMS of daily underwater values)", rep.ulcerIndex);
   PrintFormat(" Pain Index:          %.2f   (mean of daily underwater values)", rep.painIndex);
   PrintFormat(" Recovery Factor:     %.2f", rep.recoveryFactor);
   if(rep.recoveryFactor < 0.0)
      Print("   (Negative: the net result did not recover the deepest loss over this history.)");
   else if(rep.recoveryFactor < 1.0)
      Print("   (Below 1: the net profit is smaller than the deepest loss.)");

   //--- Resilience score
   Print("\n========================================");
   Print("  DRAWDOWN RESILIENCE SCORE (heuristic)");
   Print("========================================");
   PrintFormat(" Depth score:        %.1f / 100", rep.depthScore);
The recommendations are driven by thresholds rather than by the grade alone, so the advice points at the specific weakness. A deep maximum drawdown, a high share of time underwater, a high Ulcer Index, and a very long underwater period each trigger their own message.
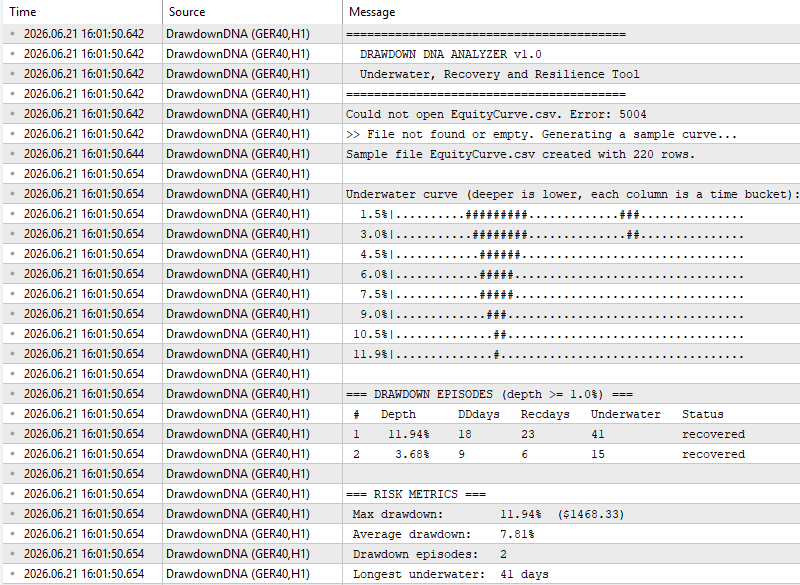
Fig. 4. Risk metrics, resilience score, grade, and recommendations in the Experts tab.
Preparing Your Data: A Practical Workflow
To analyze a real strategy, you need a CSV file with its daily results. The steps are straightforward:
- Run the backtest in the Strategy Tester with the settings you want to evaluate.
- Export the daily profit and loss to a CSV file with the columns Date and DailyPnL.
- Place the file in the terminal MQL5\Files folder and point the analyzer at it through the input parameter.
To automate the export, add the following function to your own Expert Advisor and call it from the OnTester event. The same function is attached as the standalone helper Utility_ExportDailyEquity.mq5, which you can also run directly as a script. It groups the closed buy and sell deals by day, sums the result of each day, and writes the file the analyzer expects. Only real trade deals are counted, so balance operations and other non-trade entries do not distort the curve. The function reads whatever history is available in the current context: the tester history when called from OnTester or the account history when run as a script.
//+------------------------------------------------------------------+
//| Aggregate closed-deal profit per day and write it to a CSV file  |
//+------------------------------------------------------------------+
void ExportDailyEquity(string filename)
  {
   int handle = FileOpen(filename, FILE_WRITE|FILE_CSV|FILE_ANSI, ',');
   if(handle == INVALID_HANDLE)
     {
      PrintFormat("Cannot create %s. Error: %d", filename, GetLastError());
      return;
     }

   FileWriteString(handle, "Date,DailyPnL\n");

   //--- This reads whatever history is available in the current context:
   //--- the Strategy Tester history when called from OnTester(), or the
   //--- account history when run as a script. In the tester the result
   //--- depends on the execution model and on netting/partial closes.
   if(!HistorySelect(0, TimeCurrent()))
     {
      Print("HistorySelect failed.");
      FileClose(handle);
      return;
     }

   int      total    = HistoryDealsTotal();
   datetime lastDate = 0;
   double   dayPnL   = 0.0;
   int      rows     = 0;

   for(int i = 0; i < total; i++)
     {
      ulong ticket = HistoryDealGetTicket(i);
      if(ticket == 0)
         continue;

      //--- Keep only real trade deals (buy/sell). This excludes balance,
      //--- credit, charge, correction, bonus, interest and similar entries,
      //--- which is stricter and safer than skipping DEAL_TYPE_BALANCE alone.
      ENUM_DEAL_TYPE dtype = (ENUM_DEAL_TYPE)HistoryDealGetInteger(ticket, DEAL_TYPE);
      if(dtype != DEAL_TYPE_BUY && dtype != DEAL_TYPE_SELL)
         continue;

      double profit = HistoryDealGetDouble(ticket, DEAL_PROFIT)
                    + HistoryDealGetDouble(ticket, DEAL_SWAP)
                    + HistoryDealGetDouble(ticket, DEAL_COMMISSION);

      datetime dealTime = (datetime)HistoryDealGetInteger(ticket, DEAL_TIME);
      MqlDateTime dt;
      TimeToStruct(dealTime, dt);
      datetime dateOnly = StringToTime(StringFormat("%04d.%02d.%02d", dt.year, dt.mon, dt.day));

      if(dateOnly != lastDate && lastDate != 0)
        {
         MqlDateTime ld;
         TimeToStruct(lastDate, ld);
         FileWriteString(handle, StringFormat("%04d.%02d.%02d,%.2f\n", ld.year, ld.mon, ld.day, dayPnL));
         rows++;
         dayPnL = 0.0;
        }

      lastDate = dateOnly;
      dayPnL  += profit;
     }

   //--- Write the final day
   if(lastDate != 0)
     {
      MqlDateTime ld;
      TimeToStruct(lastDate, ld);
      FileWriteString(handle, StringFormat("%04d.%02d.%02d,%.2f\n", ld.year, ld.mon, ld.day, dayPnL));
      rows++;
     }

   FileClose(handle);
   PrintFormat("Exported %d daily rows to %s", rows, filename);
  }
Call ExportDailyEquity("EquityCurve.csv") from OnTester, run the backtest once, and the file will appear in the MQL5\Files folder, ready for the analyzer. The same function is provided as a standalone script so you can also run it on an account that already has trade history.
Interpreting Results and Making Decisions
The resilience grade is a starting point. The real value is in the individual measurements, which point to a specific action.
Scenario 1: deep maximum drawdown, fast recovery. The depth score is low, but the recovery score is high. The strategy takes hard hits and bounces back. The decision is about position sizing: if the worst-case depth is more than you can fund, reduce the lot size until the depth in money terms fits your account, rather than discarding an otherwise quick-to-recover system.
Scenario 2: shallow drawdowns, long time underwater. The depth score is high, but the recovery score is low, and the ulcer index is elevated. This is the slow-bleed profile from the introduction. Investigate whether the strategy has stopped working in the current regime; a curve that is rarely deep but almost always underwater is often a sign of an edge that has decayed.
Scenario 3: high ulcer index. When the ulcer index is high while the maximum drawdown looks acceptable, the problem is persistence: the account spends long stretches well below its peak. Look at the longest underwater period and the episode table to see whether one long episode or many medium ones is responsible.
Scenario 4: strong grade across the board. Shallow declines, quick recoveries, and a low Ulcer Index produce an A or B. The action here is to protect what you have. When you add a new strategy to the account, re-run the analyzer on the combined curve and confirm the grade does not fall.
A practical implication runs through all four cases: the headline maximum drawdown is the least informative of these numbers on its own. The time underwater and the Ulcer Index usually tell you more about whether you will still be trading the strategy a year from now.
Extending the Framework
The analyzer is a foundation. A few extensions make it considerably more powerful:
- Rolling Ulcer Index: Compute the Ulcer Index over a moving window instead of the whole history so you can see whether the strategy is becoming more or less stressful over time.
- Intraday sampling: Feed the tool equity sampled several times per day rather than once, which captures intraday drawdowns that daily data hides.
- Episode order simulation: Shuffle the daily results many times and re-measure the longest underwater period, producing a confidence range for how bad the persistence could realistically get.
- Portfolio integration: Run the analyzer on the combined equity of several strategies, and use the resilience grade as one more input when deciding which strategy to add to an account.
Conclusion
Maximum drawdown is a useful number, but on its own it hides the part of risk that decides whether a trader actually stays with a strategy: how long the account stays underwater and how it gets back. In this article, we built a tool that reads a daily equity curve, reconstructs the underwater curve, splits it into episodes, and reports the depth, the duration, the recovery time, the Ulcer Index, the Pain Index, and the Recovery Factor. It then combines these into a single resilience grade with concrete recommendations.
The main points for practitioners are:
- Measure the whole decline, not just its deepest point. Two curves with the same maximum drawdown can behave very differently.
- Time underwater is often the figure that predicts whether a strategy survives contact with a real trader.
- The Ulcer Index captures depth and persistence in one number, which often makes it more informative about the lived experience of a drawdown; it complements maximum drawdown rather than replacing it.
- Use the grade to compare, but act on the individual measurements, because each one points at a different fix.
The source code is available in the MQL5 CodeBase: Drawdown DNA Analyzer in the MQL5 CodeBase. Download it, run it on your own strategies, and start measuring the part of the drawdown that the headline number leaves out.
The following table describes the source files that accompany the article.
| File Name | Description: |
|---|---|
DrawdownDNA.mq5: | The main script. It loads the data, builds the underwater curve, detects episodes, computes the metrics and the resilience score, and prints the full report in the Experts tab. |
| DataLoader.mq5: | Module 1: Reads the daily profit-and-loss CSV file and rebuilds the equity curve, with a quick summary for verification. |
| UnderwaterEngine.mq5: | Module 2: Builds the equity, high-water mark, and underwater series, and splits the underwater curve into discrete drawdown episodes. |
| RiskMetrics.mq5: | Module 3: Computes the Ulcer Index, the Pain Index, the Recovery Factor, the time underwater, and the resilience score from a sample series. |
| Utility_ExportDailyEquity.mq5: | A helper that exports a Date, DailyPnL file from the trade history. Copy its function into your Expert Advisor and call it from OnTester or run it as a script. |
| MQL5.zip: | An archive with the MQL5 folder as its root, holding every file listed above. Unpack it into the terminal installation directory, and each file is placed in its correct location: all five scripts go to MQL5\Scripts\DrawdownDNA\, so the standard terminal directories stay uncluttered. |
- MQL5 Documentation: Files;
- MQL5 Documentation: Math;
- MQL5 Documentation: Array;
- MQL5 Documentation: Deal Properties;
- Peter G. Martin and Byron B. McCann, "The Investor's Guide to Fidelity Funds," 1989 (origin of the Ulcer Index).
- Drawdown DNA Analyzer source code, MQL5 CodeBase: Drawdown DNA Analyzer in the MQL5 CodeBase
Warning: All rights to these materials are reserved by MetaQuotes Ltd. Copying or reprinting of these materials in whole or in part is prohibited.
This article was written by a user of the site and reflects their personal views. MetaQuotes Ltd is not responsible for the accuracy of the information presented, nor for any consequences resulting from the use of the solutions, strategies or recommendations described.

 Neural Networks in Trading: Time Series Forecasting Using Adaptive Modal Decomposition (ACEFormer)
- Free trading apps
- Over 8,000 signals for copying
- Economic news for exploring financial markets
You agree to website policy and terms of use