Graph Theory: Dijkstra's Algorithm Applied in Trading

Introduction
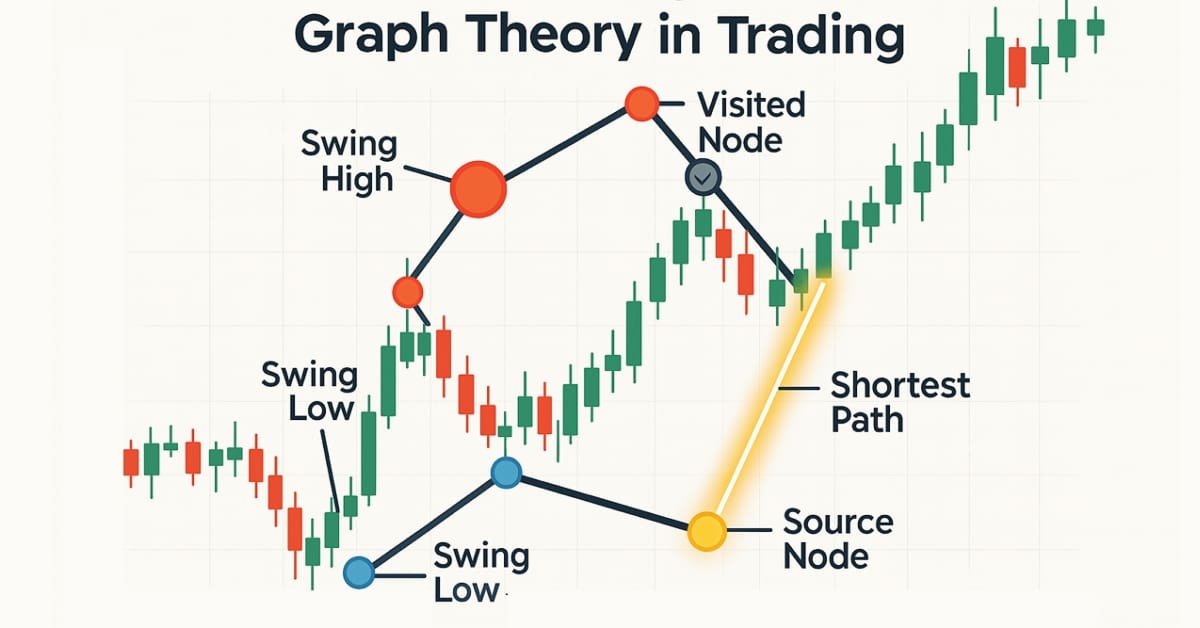
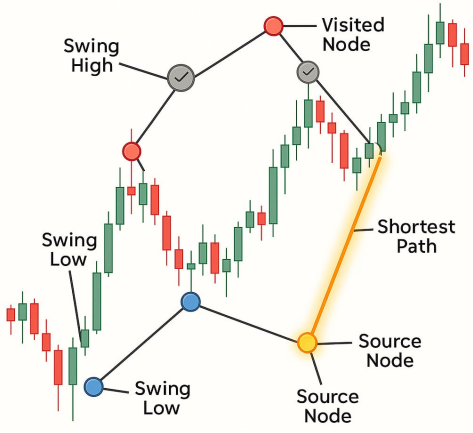
In this article, we will explore the implementation of Dijkstra's algorithm, a fundamental concept in graph theory renowned for its efficiency in solving shortest-path problems. Traditionally applied in routing and network optimization, we will repurpose this algorithm for financial markets by modeling price movements as a weighted graph. Here, nodes represent price levels or time intervals, while edges reflect the cost (or probability) of transitioning between them.
Our goal is to leverage Dijkstra's method to predict the next likely price data array, effectively determining the "shortest path" the price could take from its current position to a future value. By treating market dynamics as a graph, we aim to identify the most probable trajectory, optimizing trading decisions based on minimal resistance or cost.
Graph theory provides a powerful framework for analyzing complex market structures, and Dijkstra's algorithm offers a systematic way to navigate them. By interpreting price movements as edges with weights such as volatility, we can compute the optimal path that minimizes risk or maximizes efficiency.
The predicted price array essentially acts as the shortest distance from the current price to future levels, offering traders a data-driven method to anticipate trends. This approach bridges algorithmic trading and computational mathematics, demonstrating how classical graph algorithms can uncover hidden opportunities in financial time series data.
Dijkstra's Fundamental
| Terminology | Our Interpretation |
|---|---|
| Graph: A collection of nodes and edges. | Graph: The chart's structure formed by swing highs and swing lows, each swing point becomes a node and each price path between them becomes an edge. |
| Weight: The cost of travel from one node to another. | Weight: The cost (or effort) it takes for price to move between two swing points. This could be the absolute price distance. |
| Source Node: The starting point of the algorithm. | Source Node: The most recent valid swing point (latest high/low where price hasn’t breached back through). It’s our starting point to compute the shortest paths from. |
| Visited Set: Nodes we've finished processing. | Visited Set: All swing points that the algorithm has already evaluated and won’t revisit. In trading terms, these are swing points already breached by price or already traded toward. |
| Distance Table: Keeps track of the shortest distance to each node. | Distance Table: A mapping of each node to its shortest “cost-to-reach” value from the source node. In trading, it tells you how cheaply (or easily) price can move from the current point to any other swing point. |
Step-by-step process:
1. Initialization:
- Set the distance to the source node as 0.
- Set the distance to all other nodes as infinity.
- Create a priority queue (or min-heap) to always select the node with the smallest known distance.
2. Visit the nearest unvisited node:
- Start with the source node.
- For each neighbor, calculate:
new_distance = distance_to_current + edge_weight
If this `new_distance` is less than the previously known distance, update it.
3. Mark the current node as visited:
- Once processed, we don’t revisit it.
4. Repeat:
- Continue visiting the next closest unvisited node.
- Repeat until all nodes are visited, or the shortest path is found.
while unvisited nodes remain:
    select node with the smallest tentative distance
    for each neighbor:
        if new path to neighbor is shorter:
            update the shortest distance
    mark current node as visited
Getting started
//+------------------------------------------------------------------+
//|                                               Dijkstars Algo.mq5 |
//|                                  Copyright 2025, MetaQuotes Ltd. |
//|                                             https://www.mql5.com |
//+------------------------------------------------------------------+
#property copyright "Copyright 2025, MetaQuotes Ltd."
#property link      "https://www.mql5.com"
#property version   "1.00"
#property strict
#include <Trade/Trade.mqh>
CTrade trade;
We start by including the `trade.mqh` file, which provides us with access to the built-in MQL5 trading functionality through the `CTrade` class. This class provides methods for placing, modifying, and closing trades programmatically. After including the file, we create an instance of `CTrade` called `trade`, which we'll use throughout the Expert Advisor to send trading commands such as `Buy()`, `Sell()`, and `PositionOpen()`. This setup is essential for automating order execution in the EA.
// Input Parameters
input int    TakeProfit   = 1000;
input int   StopLoss = 385;
input double  In_Lot = 0.01;
input int    LeftBars    = 3;
input int    RightBars   = 3;
input int    MaxSwings   = 50;
input double Lots        = 0.1;
input double PointBuffer = 10;
input int    Slippage    = 5;
ENUM_TIMEFRAMES TimeFrame;
In this section, we define the input parameters for the Expert Advisor, allowing the trader to customize key settings directly from the EA's interface. `TakeProfit` and `StopLoss` set the target and risk in points, while `In_Lot` and `Lots` define the trade size. `LeftBars` and `RighBars` are used to detect swing highs and lows by comparing bars to their neighbors. `MaxSwings` limits how many swing points are tracked, and `pointBuffer` adds extra distance to SL/TP for safety. `Slippage`sets the maximum allowable price deviation during order execution, and `TimeFrame` specifies the chart period the EA will analyze.
// Node Structure
struct SwingPoint {
   int index;
   datetime time;
   double price;
   bool isHigh;
   bool visited;
   double distance;
   bool   used;
   int previous;
};
This struct defines the blueprint for a SwingPoint, which represents a node in the Dijkstra-based trading system. Each swing point holds important information:
- Index is the bar number where the swing was found.
- Time is the exact timestamp of that bar.
- Price is the high or low value at that swing.
- IsHigh indicates whether it's a swing high (true) or low (false).
- Visited helps track which nodes have been processed by the algorithm.
- Distance stores the calculated cost from the source node in Dijkstra’s path-finding.
- Used flags if this swing has already been used in trade decisions.
- Previous keeps track of the prior node in the shortest path chain.
SwingPoint swingPoints[];

//+------------------------------------------------------------------+
//| OnInit                                                           |
//+------------------------------------------------------------------+
int OnInit() {
   Print("Dijkstra Swing EA initialized");
   return INIT_SUCCEEDED;
}
Here, a dynamic array `swingPoints[]` is declared to store all detected swing highs and lows (as `SwingPoint` structures) on the chart. This array will be populated and used throughout the EA to represent nodes in the price-action graph. In the `OnInit()` function, the EA simply prints a message to the terminal confirming that the "Dijkstra Swing EA" has been initialized successfully and returns `INIT_SUCCEEDED` to signal a proper startup.
//+------------------------------------------------------------------+
//| Detect swing highs and lows                                      |
//+------------------------------------------------------------------+
void DetectSwings(int left, int right) {
   ArrayResize(swingPoints, 0);

   int totalBars = Bars(_Symbol, PERIOD_CURRENT) - right;
   for (int i = left; i < totalBars; i++) {
      bool isHigh = true, isLow = true;
      double high = High(i), low = Low(i);

      for (int j = 1; j <= left; j++) {
         if (High(i - j) >= high) isHigh = false;
         if (Low(i - j) <= low) isLow = false;
      }
      for (int j = 1; j <= right; j++) {
         if (High(i + j) >= high) isHigh = false;
         if (Low(i + j) <= low) isLow = false;
      }

      if (isHigh || isLow) {
         int idx = ArraySize(swingPoints);
         ArrayResize(swingPoints, idx + 1);
         swingPoints[idx].index = i;
         swingPoints[idx].time = Time(i);
         swingPoints[idx].price = isHigh ? high : low;
         swingPoints[idx].isHigh = isHigh;
         swingPoints[idx].visited = false;
         swingPoints[idx].distance = DBL_MAX;
         swingPoints[idx].previous = -1;

         if (idx >= MaxSwings) break;
      }
   }
}
This function, `DetectSwings()`, identifies swing highs and swing lows on the price chart by comparing each candle to its neighboring bars. It begins by clearing the existing `SwingPoints` array using `ArrayResize`, ensuring a fresh detection each time it's called. It loops through each bar on the chart, starting from th e `left` index up to `totalBars - right`, and checks if the current bar (i) qualifies as a swing high or swing low.
To determine if a bar is a swing high, it checks whether its high price is higher than the highs of the previous `left` bars and the next `right` bars. Similarly, a swing low is confirmed if its low price is lower than both the previous and next neighboring lows. If either condition is true, the bar is considered a valid swing point. This local comparison ensures only significant peaks and valleys in price are recorded as swing nodes.
When a swing is detected, it is stored in the `SwingPoints[]` array with all relevant details: its index, time, price, whether it's a high or low, and default values for path-finding (e.g., `visited`, `distance`, and `previous`). This structure supports later analysis using Dijkstra’s algorithm to evaluate path probabilities between swings. The loop terminates early if the number of detected swings reaches `MaxSwings`, preventing excessive memory use or performance issues.
//+------------------------------------------------------------------+
//| Apply Dijkstra's algorithm                                       |
//+------------------------------------------------------------------+
void ApplyDijkstra() {
   if (ArraySize(swingPoints) == 0) return;

   swingPoints[0].distance = 0;

   for (int i = 0; i < ArraySize(swingPoints); i++) {
      int u = -1;
      double minDist = DBL_MAX;

      for (int j = 0; j < ArraySize(swingPoints); j++) {
         if (!swingPoints[j].visited && swingPoints[j].distance < minDist) {
            minDist = swingPoints[j].distance;
            u = j;
         }
      }

      if (u == -1) break;

      swingPoints[u].visited = true;

      for (int v = 0; v < ArraySize(swingPoints); v++) {
         if (!swingPoints[v].visited) {
            double cost = MathAbs(swingPoints[u].price - swingPoints[v].price);
            if (swingPoints[u].distance + cost < swingPoints[v].distance) {
               swingPoints[v].distance = swingPoints[u].distance + cost;
               swingPoints[v].previous = u;
            }
         }
      }
   }
}
In this function, we implement Dijkstra's algorithm to compute the shortest path from the first swing point to all other swing points, treating price movement between swing highs and lows as a weighted graph. We first checks if any swing points exist; if the array is empty, the function exits immediately. It then sets the `distance` of the first node (the starting pivot) to `0`, signifying the source node in the path-finding process.
The algorithm enters a loop where, on each iteration, it selects the unvisited swing point with the smallest known `distance`. This node `(u)` is marked as visited, and the algorithm evaluates all its unvisited neighbors. For each of these neighbors `(v)`, it calculates the "cost" or weight to move from node `u` to `v`, based on the absolute price difference between them. If the cumulative cost to reach `v` through `u` is lower than its currently recorded distance, it updates `v's` `distance` and records `u` as its `previous` node.
This process continues until all reachable swing points have been visited or no more unvisited nodes are accessible. By the end of the function, each swing point holds the shortest cumulative cost from the source and a pointer to the previous node along that optimal path. This information allows the EA to trace the most efficient path through recent market structure and determine which swing points price is most likely to revisit next, forming the basis for smart trade signal generation.
//+------------------------------------------------------------------+
//| Visualize Swing Points and Connections                           |
//+------------------------------------------------------------------+
void VisualizeSwings() {
   for (int i = 0; i < ArraySize(swingPoints); i++) {
      string objName = "Swing_" + IntegerToString(i);
      ObjectDelete(0, objName);

      ObjectCreate(0, objName, OBJ_ARROW, 0, swingPoints[i].time, swingPoints[i].price);
      ObjectSetInteger(0, objName, OBJPROP_ARROWCODE, swingPoints[i].isHigh ? 233 : 234);
      ObjectSetInteger(0, objName, OBJPROP_COLOR, swingPoints[i].isHigh ? clrRed : clrBlue);
   }

   for (int i = 1; i < ArraySize(swingPoints); i++) {
      int prev = swingPoints[i].previous;
      if (prev != -1) {
         string lineName = "Line_" + IntegerToString(i);
         ObjectDelete(0, lineName);

         ObjectCreate(0, lineName, OBJ_TREND, 0,
                      swingPoints[prev].time, swingPoints[prev].price,
                      swingPoints[i].time, swingPoints[i].price);
         ObjectSetInteger(0, lineName, OBJPROP_COLOR, clrGray);
         ObjectSetInteger(0, lineName, OBJPROP_WIDTH, 1);
      }
   }
}
The `VisualizeSwings()` function is responsible for drawing the detected swing points and the connections between them directly on the chart, helping traders visually confirm the structure and logic used by the EA. In the first `for` loop, it iterates through the `swingPoints[]` array and creates arrow objects for each swing. Before creating a new object, it deletes any existing object with the same name to avoid clutter. Each arrow is given a specific symbol: red for swing highs `arrow code 233` and blue for swing lows `arrow code 234`, making them visually distinguishable.
In the second `for` loop, the function draws lines between each swing point and its corresponding `previous` node (as determined by Dijkstra’s algorithm). These lines represent the shortest-path connections used to evaluate potential trade paths. Again, any existing line object with the same name is deleted before drawing a new one. The lines are created using `OBJ_TREND` and drawn in gray with a standard width, maintaining a clean and clear visual structure.
This visualization helps validate the EA’s decision-making by allowing you to see which swing points were identified, how they are connected, and which path was chosen based on Dijkstra’s algorithm. It is especially useful during backtesting or live trading when verifying that the EA is analyzing market structure as intended.
double High(int index){return (iHigh(_Symbol, _Period, index));}
double Low(int index){return (iLow(_Symbol, _Period, index));}
datetime Time(int index){return (iTime(_Symbol, _Period, index));}
These three helper functions, `High()`, `Low()`, and `Time()` are simple wrappers around the built-in MQL5 functions `iHigh()`, `iLow()`, and `iTime()`. They allow easy access to the high price, low price, and opening time of a specific bar (based on the given `index`) on the current symbol and time-frame. By using these shorthand functions, the code becomes cleaner and more readable, especially when repeatedly accessing bar data during swing detection or visualization.
//+------------------------------------------------------------------+
//|                          Filter and mark                         |
//+------------------------------------------------------------------+
void FilterAndMarkValidSwings(SwingPoint &points[]) {
   int count = ArraySize(points);
   if(count < 2) return;

   for(int i = 0; i < count; i++) {
      if(points[i].used) continue;

      bool isValid = true;
      double swingPrice = points[i].price;
      int swingIndex = points[i].index;

      // Scan forward in time from the swing point
      for(int j = swingIndex - 1; j >= 0; j--) {
         double high = iHigh(_Symbol, TimeFrame, j);
         double low  = iLow(_Symbol, TimeFrame, j);

         // Invalidate swing high if price went higher later
         if(points[i].isHigh && high > swingPrice) {
            isValid = false;
            break;
         }

         // Invalidate swing low if price went lower later
         if(!points[i].isHigh && low < swingPrice) {
            isValid = false;
            break;
         }
      }

      if(isValid) {
         points[i].used = true;

         // Draw object on chart
         string objName = points[i].isHigh ?
            StringFormat("SwingHigh_%d", TimeToString(iTime(_Symbol, TimeFrame, swingIndex))) :
            StringFormat("SwingLow_%d", TimeToString(iTime(_Symbol, TimeFrame, swingIndex)));

         color swingColor = points[i].isHigh ? clrRed : clrBlue;

         ObjectCreate(0, objName, OBJ_HLINE, 0, 0, swingPrice);
         ObjectSetInteger(0, objName, OBJPROP_COLOR, swingColor);
         ObjectSetInteger(0, objName, OBJPROP_STYLE, STYLE_DASH);
         ObjectSetInteger(0, objName, OBJPROP_WIDTH, 1);
      }
   }
}
The `FilterAndMarkValidSwings()` function refines the list of swing points by identifying which ones are still valid and have not been invalidated by future price movements. It takes an array of `SwingPoints` references and iterates through them, skipping any that are already marked as `used`. For each candidate swing, it assumes the point is valid and then performs a validation check based on historical price action to confirm whether price has moved beyond that swing after it was formed.
To determine validity, the function scans backward through past bars from the swing’s index. For a swing high, it checks whether any future candle had a high that exceeded it, and for a swing low, it checks whether any candle had a lower low. If such a condition is found, the swing point is considered invalid because the price has effectively "run through" that swing, so it's not marked or used in further calculations. If no such condition is found, the swing point is valid and is flagged as `used`.
For every valid swing, the function then draws a horizontal line on the chart to visually mark it. The line is styled as dashed and colored red for swing highs or blue for swing lows. The object is named using the swing type and the time of the bar it was detected at. This visual feedback helps traders immediately identify which swing points the EA considers strong and untouched by price, making it easier to trust and debug the logic during analysis or trading.
//+------------------------------------------------------------------+
//|                        Cleaning up old swings                    |
//+------------------------------------------------------------------+
void CleanOldSwingObjects(int keepBars = 100) {
   datetime oldestDate = iTime(_Symbol, TimeFrame, keepBars);
   int total = ObjectsTotal(0);

   for(int i = total - 1; i >= 0; i--) {
      string name = ObjectName(0, i);
      if(StringFind(name, "SwingHigh_") == 0 || StringFind(name, "SwingLow_") == 0) {
         datetime swingTime = (datetime)ObjectGetInteger(0, name, OBJPROP_TIME);
         if(swingTime < oldestDate) {
            ObjectDelete(0, name);
         }
      }
   }
}
Here, the function is responsible for removing outdated swing-related visual elements from the chart to maintain clarity and performance. It determines the threshold for “old” objects using the `keepBars` parameter, which retrieves the timestamp of the bar that is `keepBars` candles ago. Any swing objects created before this timestamp are considered obsolete. The function then loops through all graphical objects on the chart in reverse order and checks if their names start with "SwingHigh_" or "SwingLow_", which identifies them as swing markers.
For each of these swing objects, it retrieves the creation time and compares it with the cutoff timestamp (oldestDate). If the object’s time is older, it deletes it from the chart using `objectDelete()`. This routine ensures that the chart remains uncluttered by only displaying recent and relevant swing points. It also helps prevent performance degradation over time, especially when running the EA on longer histories or in live markets where many swings accumulate.
//+------------------------------------------------------------------+
//| Generate Signal & Trade                                          |
//+------------------------------------------------------------------+
void GenerateSignalAndTrade() {
   if (ArraySize(swingPoints) < 2) return;

   int last = ArraySize(swingPoints) - 1;
   int prev = swingPoints[last].previous;
   if (prev == -1) return;

   double entry = swingPoints[last].price;
   double reference = swingPoints[prev].price;
   double sl, tp;
   bool isBuy = entry > reference, isSell = entry < reference;

   SetSLTP(entry, reference, isBuy, sl, tp);

   if (PositionSelect(_Symbol)) return;

   if (isBuy)
      ExecuteTrade(ORDER_TYPE_BUY);
   else if(isSell)
      ExecuteTrade(ORDER_TYPE_SELL);
}
The `GenerateSignalAndTrade()` function is responsible for producing a trade signal based on the direction of the most recent path found by Dijkstra’s algorithm through swing points. It first ensures there are at least two swing points to compare and that the latest swing point has a valid `previous` node. It then extracts the price of the latest swing and its preceding connected swing, using the price relationship between them to determine the trade direction: if the most recent price is higher than the previous one, it signals a buy; if lower, a sell.
Once the direction is determined, the function calculates the stop loss and take profit levels using the `SetSLTP()` function, which bases these on the distance between the swing points. Before opening a trade, it checks if a position is already open on the symbol to avoid duplicates. Finally, it places the trade using the `ExecuteTrade()` function, passing the appropriate order type. This logic ensures that trades are only executed when a clear, structurally supported directional path is identified between valid swing points.
//+------------------------------------------------------------------+
//| Calculate SL and TP based on distance to previous node           |
//+------------------------------------------------------------------+
void SetSLTP(double entry, double ref, bool isBuy, double &sl, double &tp) {
   double distance = MathAbs(entry - ref) + PointBuffer * _Point;
   if (isBuy) {
      sl = entry - distance;
      tp = entry + distance;
   } else {
      sl = entry + distance;
      tp = entry - distance;
   }
}
The `SetSLTP()` function calculates the stop loss (sl) and take profit (tp) levels for a trade based on the distance between the current entry price and a reference price (typically the previous swing point). It first computes the absolute price difference between these two points and adds a small buffer (in points) for safety. If the trade is a buy, the stop loss is placed below the entry and the take profit above it; for a sell, the stop loss is above the entry and the take profit below. This ensures the risk and reward are symmetrically aligned around the swing structure, helping the EA follow price action with meaningful, structure-based SL and TP levels.
//+------------------------------------------------------------------+
//| Execute trade with risk parameters                               |
//+------------------------------------------------------------------+
void ExecuteTrade(ENUM_ORDER_TYPE tradeType){

   double point = SymbolInfoDouble(_Symbol, SYMBOL_POINT);
   double price = (tradeType == ORDER_TYPE_BUY) ? SymbolInfoDouble(_Symbol, SYMBOL_ASK) :
                                                  SymbolInfoDouble(_Symbol, SYMBOL_BID);

   // Convert StopLoss and TakeProfit from pips to actual price distances
   double sl_distance = StopLoss * point;
   double tp_distance = TakeProfit * point;

   double sl = (tradeType == ORDER_TYPE_BUY) ? price - sl_distance :
                                               price + sl_distance;

   double tp = (tradeType == ORDER_TYPE_BUY) ? price + tp_distance :
                                               price - tp_distance;

   trade.PositionOpen(_Symbol, tradeType, In_Lot, price, sl, tp, NULL);
}
The `ExecuteTrade()` function is responsible for placing a trade order with predefined risk parameters. It begins by determining the current market price: it uses the ask price for a buy order and the bid price for a sell. It then calculates the stop loss and take profit levels by converting the input values (stopLoss and TakeProfit)from points to actual price distances using the symbol's point size. Depending on whether the trade is a buy or sell, it positions the stop loss and take profit appropriately above or below the entry price.
Finally, it uses the `CTrade` class's `PositionOpen()` method to execute the trade with the calculated parameters, including lot size, direction, entry price, SL, TP, and no custom comment. This ensures trades follow a consistent risk framework regardless of market direction.
//+------------------------------------------------------------------+
//| OnTick                                                           |
//+------------------------------------------------------------------+
void OnTick() {
   static datetime lastBarTime = 0;
   datetime currentBarTime = iTime(_Symbol, _Period, 0);

   if (currentBarTime != lastBarTime) {
      lastBarTime = currentBarTime;

      DetectSwings(LeftBars, RightBars);
      ApplyDijkstra();
      VisualizeSwings();
      GenerateSignalAndTrade();
      FilterAndMarkValidSwings(swingPoints);
      CleanOldSwingObjects();

   }
}
Finally, the `OnTick()` function is the main execution loop of the EA, triggered on every new tick. To avoid redundant processing, it uses a static variable `lastBarTime` to detect if a new bar has formed by comparing it with the current bar's opening time. If a new bar is detected, it updates `lastBarTime` and runs the core logic: detecting new swing highs and lows (DetectSwings), applying Dijkstra's algorithm to find the most efficient path between swings (ApplyDijkstra), visually displaying the swings and their connections on the chart (VisualiseSwings), generating and executing trading signals based on path direction (GenerateSignalAndTrade), filtering out invalidated swing points (FilterAndMarkValidSwings), and finally cleaning up old swing objects to keep the chart uncluttered (CleanOldSwingObjects).
This structure ensures the EA processes market structure intelligently.
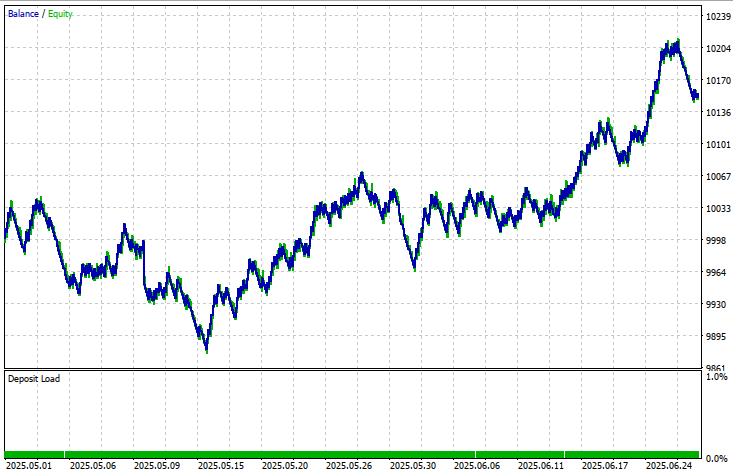
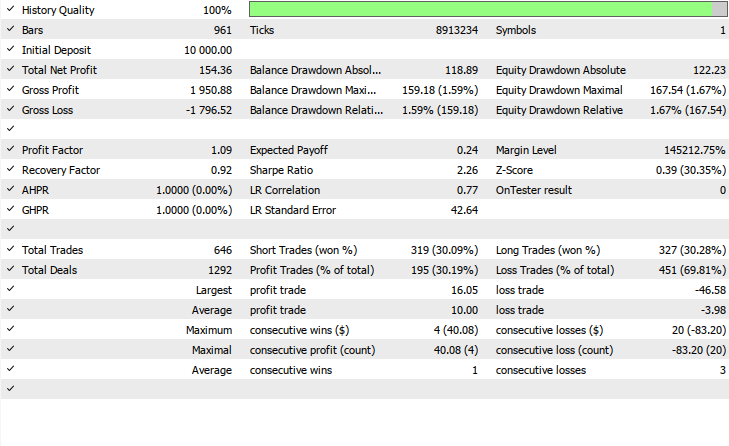
Back Test Results
The back-testing was evaluated on the 1H time-frame across a 2-months testing window (01 May 2025 to 20 June 2025), with the following input settings:
- TP in points = 1000
- Stop loss = 385
- Input lots = 0.01
- Left bars = 3
- Right bars = 3
- Max swing = 50
- Point buffer = 10.0
- Slippage = 5
Conclusion
In summary, we have built a fully functional MQL5 Expert Advisor that interprets financial market structure using Dijkstra’s algorithm applied to swing highs and swing lows as graph nodes. The system detects significant swing points on each new bar, filters out invalid ones that the price has already breached, and treats valid swings as vertices in a path-finding algorithm. It then uses price distance as edge weights to compute the most efficient path through the market structure, determining the most likely direction of price movement.
Based on this analysis, the EA generates directional trade signals and executes trades with properly calculated stop loss and take profit levels based on the distance between swing points. Visual tools like arrows and trend lines are drawn to reflect both the detected swing points and the computed paths, while cleanup routines ensure the chart remains clear and updated.
In conclusion, this EA goes beyond traditional indicator-based trading by integrating a graph-based algorithm into price action analysis, allowing for more structured and logical trade decisions. By aligning trade entries with market swing geometry and ensuring each node is only used once unless valid, the system mimics how price naturally flows through support and resistance. The modular design with functions for detection, validation, path-finding, execution, and visualization also makes it easy to improve, extend, or back-test the strategy further. This project lays the foundation for a smart, adaptive trading system that treats price action as a navigable network, combining data structure theory with market behavior.
Warning: All rights to these materials are reserved by MetaQuotes Ltd. Copying or reprinting of these materials in whole or in part is prohibited.
This article was written by a user of the site and reflects their personal views. MetaQuotes Ltd is not responsible for the accuracy of the information presented, nor for any consequences resulting from the use of the solutions, strategies or recommendations described.

- Free trading apps
- Over 8,000 signals for copying
- Economic news for exploring financial markets
You agree to website policy and terms of use