
Formulating Dynamic Multi-Pair EA (Part 3): Mean Reversion and Momentum Strategies

Introduction
In this article, we will demonstrate how to structure logic that adapts to market dynamics, avoids repeated signals during extended moves, and ensures trade entries are made with precision using statistical thresholds while scaling across multiple symbols in real time. One of the most common challenges traders face is signal fatigue, where systems continue to generate trade entries in the same direction during strong trends or chop, leading to over-trading and unnecessary losses. In fast or indecisive markets, strategies that lack context or momentum-awareness can fall victim to false signals, late entries, and poor risk allocation across correlated currency pairs.
To address this, we introduce a dynamic, multi-pair trading framework that combines mean reversion and momentum strategies in a single intelligent engine. Rather than relying on traditional indicators alone, the system utilizes Z-score calculations to detect statistically significant price deviations and momentum range thresholds to decide when to enter, hold off, or re-enter trades. By tracking trade direction, entry progress, and symbol-specific conditions in real time, the EA can effectively pause or continue entries based on how much of the current price movement has played out.
This article walks through the technical implementation of these ideas, focusing on how to manage logic across multiple pairs efficiently, ensure trades are placed only when conditions are optimal, and reduce noise-driven decisions. Whether you're building a robust EA or refining a discretionary system, this approach promotes smarter trade selection, better timing, and a more adaptive risk profile for modern market environments.
Expert Logic
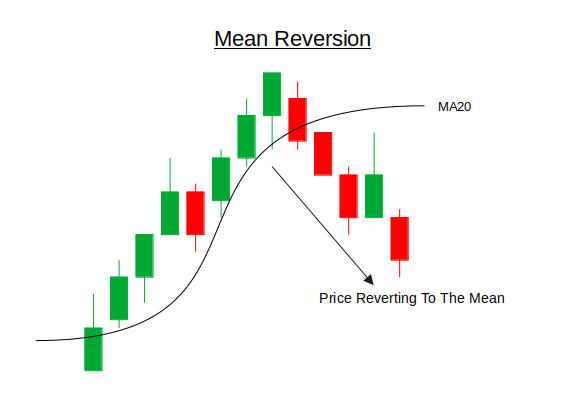
Mean reversion is a trading concept based on the idea that prices, over time, tend to return to their average or "mean" value. This theory assumes that extreme movements in price, whether upward or downward, are temporary and will eventually correct toward a historical norm. In financial markets, these extremes are often caused by short-term imbalances in supply and demand, overreactions to news, or liquidity shocks. Mean reversion strategies aim to capitalize on these temporary price dislocations by identifying when an asset is statistically overbought or oversold, and then entering trades in the opposite direction with the expectation that price will revert to its mean.
Under the hood, mean reversion is typically implemented using statistical tools such as the Z-score, which measures how far the current price deviates from a moving average in terms of standard deviations. A high positive Z-score suggests the price is far above its average (potentially overbought), while a low negative Z-score suggests it is far below (potentially oversold). Traders set thresholds (e.g., +-2.0) to determine when a deviation is significant enough to warrant a trade. Once the threshold is breached and additional conditions (like weakening momentum or a reversal signal) are met, a trade is opened anticipating price reverting to the mean. This strategy is most effective in ranging or mean-reverting markets and requires careful risk management, as persistent trends can invalidate reversion signals if not accounted for.
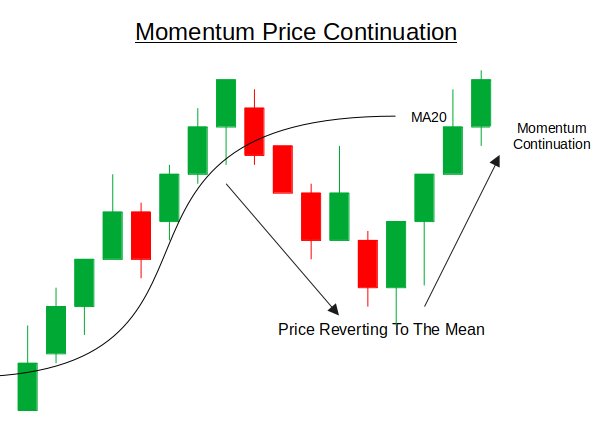
Momentum trading is a strategy that seeks to profit from the continuation of existing market trends. The core idea is that assets which have shown strong price movement in one direction are more likely to continue moving in that direction, rather than or after reversing (reversion). This behavior is often driven by herd psychology, institutional flow, news-driven sentiment, or technical breakouts. Traders using momentum strategies aim to enter trades during the early or middle phase of a strong directional move, riding the trend until signs of exhaustion or reversal emerge.
Under the hood, momentum strategies typically rely on the rate of change in price over a defined period. This can be measured using simple price differentials (e.g., current price minus price from N bars ago), momentum oscillators, or even custom indicators that capture speed and acceleration of price. In a multi-pair trading system, momentum can be calculated individually for each symbol and then evaluated against a threshold to determine if the move is strong enough to justify an entry. Once momentum is confirmed, trades are taken in the direction of the trend, and the strategy may continue to scale into positions as long as momentum remains strong and unexhausted.
Getting started
//+------------------------------------------------------------------+
//|                                                Dyna Mean&Mom.mq5 |
//|                                  Copyright 2024, MetaQuotes Ltd. |
//|                                             https://www.mql5.com |
//+------------------------------------------------------------------+
#property copyright "Copyright 2024, MetaQuotes Ltd."
#property link      "https://www.mql5.com"
#property version   "1.00"
#include <Trade/Trade.mqh>
#include <Math/Stat/Math.mqh>
CTrade trade;
As always, we begin by including the necessary classes for our Expert Advisor to function properly. What may seem different this time is that we also include the `<Math/Stat/Math.mqh>` library. This provides us access to powerful statistical tools such as mean, standard deviation, and Z-score calculations, which are essential for implementing both the mean reversion and momentum strategies.
//+------------------------------------------------------------------+
//|  Enhanced Mean-Reversion + Momentum EA                           |
//+------------------------------------------------------------------+

//--- Input settings
input string Symbols = "XAUUSD,GBPUSD,USDCAD,USDJPY";
input int    TakeProfit = 150;        // TP in points
input int    StopLoss = 100;           // SL in points
input int    MAPeriod = 20;
input int    MomentumPeriod = 5;
input double Z_Threshold = 2.0;
input double Mom_Threshold = 1.5;     // Price change in standard deviations
input double RiskPercent_High = 1.5, RiskPercent_Mod = 1.0, RiskPercent_Low = 0.5;
In this section of the code, we define the input settings for the expert advisor. This allows the user to specify a list of trading symbols (e.g., XAUUSD, GBPUSD), set key risk management parameters such as take profit, stop loss, and risk percentages, and fine-tune the behavior of the strategy using statistical inputs. These include the period for the moving average, the period used to measure momentum, and thresholds for both Z-score and momentum strength. Together, these inputs help the EA adapt to different market conditions while managing risk across multiple currency pairs.
//--- Global parameters
string symb_List[];
int Num_symbs = 0;

// Indicator handles arrays
int MA_hndl[];
int STDev_hndl[];
int ATR_hndl[];
Here we declare global variables used throughout the EA. It includes `symb_List[]`, an array to hold the list of trading symbols, and `Num_symbs`, which stores the total number of symbols to be processed. Additionally, we define arrays for indicator handles: `MA_hndl[]` for moving average, `STDev_hndl[]` for standard deviation, and `ATR_hndl[]` for the average true range. These handles are used to manage and access indicator data efficiently for each symbol during execution.
//+------------------------------------------------------------------+
//| Expert initialization                                            |
//+------------------------------------------------------------------+
int OnInit() {
    //--- Split symbol list
    ushort separator = StringGetCharacter(",", 0);
    StringSplit(Symbols, separator, symb_List);
    Num_symbs = ArraySize(symb_List);

    //--- Resize arrays
    ArrayResize(MA_hndl, Num_symbs);
    ArrayResize(STDev_hndl, Num_symbs);
    ArrayResize(ATR_hndl, Num_symbs);

    //--- Prepare each symbol
    for (int i = 0; i < Num_symbs; i++) {
        string symbol = symb_List[i];
        StringTrimLeft(symbol);
        StringTrimRight(symbol);

        //--- Create indicator handles
        MA_hndl[i] = iMA(symbol, PERIOD_H1, MAPeriod, 0, MODE_SMA, PRICE_CLOSE);
        STDev_hndl[i] = iStdDev(symbol, PERIOD_H1, MAPeriod, 0, MODE_SMA, PRICE_CLOSE);
        ATR_hndl[i] = iATR(symbol, PERIOD_H1, 14);

        if (MA_hndl[i] == INVALID_HANDLE || STDev_hndl[i] == INVALID_HANDLE || ATR_hndl[i] == INVALID_HANDLE) {
            Print("Failed to create indicator handles for ", symbol);
            return INIT_FAILED;
        }
    }

    //--- Set magic number for trade identification
    trade.SetExpertMagicNumber(54321);

    return INIT_SUCCEEDED;
}
In this section, we initialize the Expert Advisor for when it is loaded onto the chart. We begin by splitting the user-defined Symbols string into an array and counting how many symbols will be processed. We then resize the indicator handle arrays to match the number of symbols. For each symbol, we trim any extra spaces and create indicator handles for the moving average (MA), standard deviation (STDev), and average true range (ATR), all calculated on the H1 timeframe. If any of the handles fail to initialize, the EA prints an error message and stops. Finally, we set a unique magic number using `trade.SetExpertMagicNumber(54321)` to help identify trades placed by this EA.
//+------------------------------------------------------------------+
//|          Mean and Momentum Signal Generator                      |
//+------------------------------------------------------------------+
void MeanAndMomentum(string symbol, int idx) {
    //--- Get current price data
    MqlRates current[];
    if(CopyRates(symbol, PERIOD_H1, 0, 1, current) < 1) return;
    double close = current[0].close;

    //--- Get historical price for momentum calculation
    MqlRates historical[];
    if(CopyRates(symbol, PERIOD_H1, MomentumPeriod, 1, historical) < 1) return;
    double histClose = historical[0].close;

    //--- Get indicator values
    double ma[1], stddev[1], atr[1];
    if(CopyBuffer(MA_hndl[idx], 0, 0, 1, ma) < 1) return;
    if(CopyBuffer(STDev_hndl[idx], 0, 0, 1, stddev) < 1) return;
    if(CopyBuffer(ATR_hndl[idx], 0, 0, 1, atr) < 1) return;

    //--- Calculate metrics
    double momentum = close - histClose;
    double zscore = (stddev[0] > 0) ? (close - ma[0]) / stddev[0] : 0;
    double momThreshold = Mom_Threshold * stddev[0]; // Dynamic momentum threshold

    //--- Determine signal type
    int signal = 0;
    double riskPercent = 0;

    bool meanReversionLong = (zscore < -Z_Threshold);
    bool meanReversionShort = (zscore > Z_Threshold);
    bool momentumLong = (momentum > momThreshold);
    bool momentumShort = (momentum < -momThreshold);

    //--- Signal priority: Momentum > Mean Reversion
    if(momentumLong && meanReversionLong) {
        signal = 1;
        riskPercent = RiskPercent_High; // Strong signal
    }
    else if(momentumShort && meanReversionShort) {
        signal = -1;
        riskPercent = RiskPercent_High;
    }
    else if(momentumLong) {
        signal = 1;
        riskPercent = RiskPercent_Mod;
    }
    else if(momentumShort) {
        signal = -1;
        riskPercent = RiskPercent_Mod;
    }
    else if(meanReversionLong) {
        signal = 1;
        riskPercent = RiskPercent_Low;
    }
    else if(meanReversionShort) {
        signal = -1;
        riskPercent = RiskPercent_Low;
    }

    //--- Exit if no signal
    if(signal == 0) return;

    //--- Check existing positions
    if(PositionSelect(symbol)) {
        long positionType = PositionGetInteger(POSITION_TYPE);
        if((positionType == POSITION_TYPE_BUY && signal == 1) ||
           (positionType == POSITION_TYPE_SELL && signal == -1)) {
            return; // Already in position in same direction
        }
        else {
            // Close opposite position before opening new one
            trade.PositionClose(symbol);
            Sleep(100); // Allow time for order execution
        }
    }

    //--- Calculate position size
    double lotSize = CalculatePositionSize(symbol, riskPercent, atr[0]);
    if(lotSize <= 0) return;

    //--- Execute trade
    ExecuteTrade(signal == 1 ? ORDER_TYPE_BUY : ORDER_TYPE_SELL, symbol, lotSize);
}
The `MeanAndMomentum()` function generates trading signals by combining both mean reversion and momentum for a given symbol. It starts by retrieving the most recent price (Close) and a historical price from `MomentumPeriod` bars ago, which is used to calculate momentum. It also fetches values for the moving average, standard deviation, and average true range (ATR) using previously initialized indicator handles. With this data, the function calculates the Z-score which reflects how far the current price is from the mean in standard deviations and momentum, which is simply the price change over time. A dynamic momentum threshold is also computed by scaling the standard deviation, making the system responsive to changing volatility conditions.
Once these metrics are calculated, the function evaluates whether any trading signal conditions are met. It checks if the Z-score indicates a mean-reversion opportunity (price far from the average) or if momentum is strong enough to suggest a trending move. The signal logic is tiered, giving priority to cases where both mean reversion and momentum align in the same direction, assigning them the highest risk allocation (RiskPercentage_High). If only one condition is met, the system assigns a lower risk percentage. This layered approach helps the EA filter for higher-quality setups and adapt its exposure based on the signal.
Finally, the function checks for existing positions in the same symbol. If a position in the same direction already exists, it avoids duplication. If there's an opposite position, it closes it before opening the new one. The function then calculates the appropriate lot size using the ATR-based risk model and proceeds to execute the trade using the determined signal direction. This structure ensures that trades are aligned with statistical edge, properly sized based on volatility, and do not conflict with existing market exposure.
//+------------------------------------------------------------------+
//| Calculate position size based on risk and volatility             |
//+------------------------------------------------------------------+
double CalculatePositionSize(string symbol, double riskPercent, double atrValue) {
    double balance = AccountInfoDouble(ACCOUNT_BALANCE);
    double riskAmount = balance * (riskPercent / 100.0);

    double point = SymbolInfoDouble(symbol, SYMBOL_POINT);
    double tickValue = SymbolInfoDouble(symbol, SYMBOL_TRADE_TICK_VALUE_LOSS);
    double tickSize = SymbolInfoDouble(symbol, SYMBOL_TRADE_TICK_SIZE);

    if(point <= 0 || tickValue <= 0 || tickSize <= 0) {
        Print("Invalid symbol parameters for ", symbol);
        return 0;
    }

    // Use ATR-based stop loss
    double slDistance = atrValue * 1.5;
    double lossPerLot = slDistance * (tickValue / tickSize);

    if(lossPerLot <= 0) {
        Print("Invalid loss calculation for ", symbol);
        return 0;
    }

    double lots = riskAmount / lossPerLot;
    lots = NormalizeLots(symbol, lots);

    return lots;
}
The `CalculatePositionSize()` function, determines the optimal lot size for a trade based on the trader’s account balance, chosen risk percentage, and current market volatility measured by the Average True Range (ATR). It starts by calculating how much capital the trader is willing to risk (riskAmount) as a percentage of the total account balance. It then retrieves key trading parameters for the specified symbol, including point size, tick value, and tick size, which are necessary to convert price movement into monetary risk.
Using these parameters, the function estimates the stop-loss distance by multiplying the ATR value by 1.5—allowing for a volatility-adjusted buffer. It calculates the potential loss per standard lot based on this stop distance and symbol-specific tick value. The desired lot size is then computed by dividing the risk amount by the estimated loss per lot, ensuring the trade fits within the specified risk tolerance. Finally, it calls `NormalizeLots()` to round the lot size according to the symbol’s trading constraints and returns the result. This method ensures each trade is properly sized to both the account and market conditions.
//+------------------------------------------------------------------+
//| Normalize lot size to broker requirements                        |
//+------------------------------------------------------------------+
double NormalizeLots(string symbol, double lots) {
    double minLot = SymbolInfoDouble(symbol, SYMBOL_VOLUME_MIN);
    double maxLot = SymbolInfoDouble(symbol, SYMBOL_VOLUME_MAX);
    double lotStep = SymbolInfoDouble(symbol, SYMBOL_VOLUME_STEP);

    if(lotStep > 0) {
        lots = MathRound(lots / lotStep) * lotStep;
    }

    lots = MathMax(minLot, MathMin(maxLot, lots));
    return lots;
}
Here, the function simply normalizes the lot size according to the broker requirements.
//+------------------------------------------------------------------+
//| Execute trade with proper risk management                        |
//+------------------------------------------------------------------+
void ExecuteTrade(ENUM_ORDER_TYPE tradeType, string symbol, double lotSize) {
    double point = SymbolInfoDouble(symbol, SYMBOL_POINT);
    double price = (tradeType == ORDER_TYPE_BUY) ?
                   SymbolInfoDouble(symbol, SYMBOL_ASK) :
                   SymbolInfoDouble(symbol, SYMBOL_BID);

    // Get current ATR for dynamic stop levels
    double atr[1];
    int idx = ArrayPosition(symbol);
    if(idx >= 0 && CopyBuffer(ATR_hndl[idx], 0, 0, 1, atr) > 0) {
        double slDistance = atr[0] * 1.5;
        double tpDistance = atr[0] * 2.5;

        double sl = (tradeType == ORDER_TYPE_BUY) ?
                    price - slDistance :
                    price + slDistance;

        double tp = (tradeType == ORDER_TYPE_BUY) ?
                    price + tpDistance :
                    price - tpDistance;

        trade.PositionOpen(symbol, tradeType, lotSize, price, sl, tp, "MR-Mom System");
    }
    else {
        // Fallback to fixed stops if ATR fails
        double sl = (tradeType == ORDER_TYPE_BUY) ?
                    price - (StopLoss * point) :
                    price + (StopLoss * point);

        double tp = (tradeType == ORDER_TYPE_BUY) ?
                    price + (TakeProfit * point) :
                    price - (TakeProfit * point);

        trade.PositionOpen(symbol, tradeType, lotSize, price, sl, tp, "MR-Mom System");
    }
}
The `ExecuteTrade()` function is responsible for placing a trade with appropriate risk controls based on the trade direction, symbol, and calculated lot size. It starts by determining the current market price using the ask price for buy trades and the bid price for sell trades, and then attempts to retrieve the most recent ATR value for that symbol. If the ATR data is available, it uses it to dynamically calculate stop-loss and take-profit levels: 1.5×ATR for stop-loss and 2.5×ATR for take-profit, ensuring that risk and reward are adjusted to current market volatility. The trade is then placed using the `trade.PositionOpen()` method, with those calculated levels and a label for identification.
//+------------------------------------------------------------------+
//| Find symbol position in array                                    |
//+------------------------------------------------------------------+
int ArrayPosition(string symbol) {
    for(int i = 0; i < Num_symbs; i++) {
        if(symb_List[i] == symbol) return i;
    }
    return -1;
}
The function searches for a given symbol in the `symb_List` array and returns its index, if the symbols are not found it returns -1. It helps identify the correct position of the symbol for accessing related indicator handles.
//+------------------------------------------------------------------+
//| Expert tick function                                             |
//+------------------------------------------------------------------+
void OnTick(){
   if(isNewBar()){
      for(int i = 0; i < Num_symbs; i++) {
         MeanAndMomentum(symb_List[i], i);
      }
   }
}
Finally, the `OnTick()`function is the heartbeat of the Expert Advisor, responsible for executing logic every time a new tick is received. To avoid processing on every tick, it first checks if a new bar has formed using `isNewBar()`, ensuring signals are only evaluated once per candle. When a new bar is confirmed, the function loops through all specified symbols and calls `MeanAndMomentum()` for each one, allowing the EA to assess trade opportunities across multiple pairs in sync with the market's latest data.
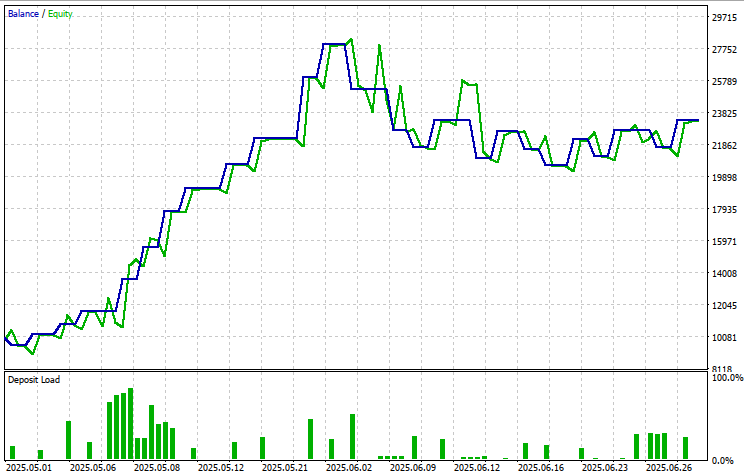
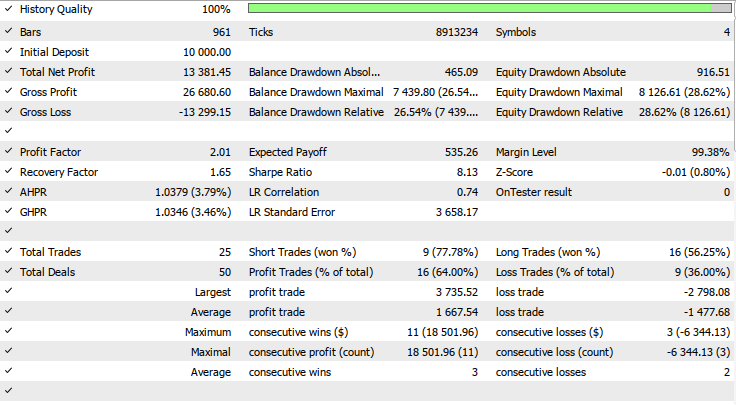
Back Test Results
The back-testing was evaluated on the 1H time-frame across a 2-months testing window (01 May 2025 to 20 June 2025), with the following input settings:
- TP in points = 972
- SL in points = 846
- MA period = 80
- Momentum period = 43
- Z_Threshold = 3.0
- Price change in standard deviations = 4.05
- Risk percent high = 9.75
- Risk percent mod = 10.0
- Risk percent low = 4.65
Conclusion
In summary, we designed and implemented a dynamic multi-symbol Expert Advisor that combines both mean reversion and momentum trading strategies to adapt intelligently to evolving market conditions. By leveraging statistical tools such as moving averages, standard deviation (Z-score), and ATR-based volatility, we structured a system capable of analyzing multiple pairs simultaneously and making calculated trade decisions. Each symbol is monitored independently, allowing for custom signal generation based on price behavior, volatility, and trend strength. The strategy prioritizes entries where momentum and mean reversion signals align and uses risk-adjusted position sizing to manage exposure effectively.
In conclusion, this Expert Advisor provides a solid foundation for building statistically driven, adaptive trading systems across multiple currency pairs. Its modular design and layered decision-making framework make it both scalable and customizable, suitable for strategies ranging from scalping to swing trading. The use of real-time volatility and momentum tracking ensures entries are not only statistically grounded but also market-sensitive. With proper optimization and monitoring, this system has the potential to deliver consistent, risk-managed performance across a variety of market environments.
Warning: All rights to these materials are reserved by MetaQuotes Ltd. Copying or reprinting of these materials in whole or in part is prohibited.
This article was written by a user of the site and reflects their personal views. MetaQuotes Ltd is not responsible for the accuracy of the information presented, nor for any consequences resulting from the use of the solutions, strategies or recommendations described.

 From Basic to Intermediate: Union (I)
- Free trading apps
- Over 8,000 signals for copying
- Economic news for exploring financial markets
You agree to website policy and terms of use