
Price Action Analysis Toolkit Development (Part 46): Designing an Interactive Fibonacci Retracement EA with Smart Visualization in MQL5

Introduction
In our previous article in this series, Price Action Analysis Toolkit Development, we focused on testing price levels to review how the market had reacted to them in the past—identifying breakouts, touches, and empirical breakout probabilities. A key feature behind that tool’s functionality was the on‑screen input panel, which allowed users to type a price level and trigger analysis with a single Analyze button.
In this installment, we build on that same idea of typing values directly on the chart, this time improving the experience for Fibonacci Retracement analysis in MQL5. Instead of applying the standard Fibonacci tool manually, a process that can be confusing for new users, this EA offers a simpler, interactive alternative. You simply identify the swing high and low, type those values into the panel, and press Draw Fib. The EA automatically plots all relevant retracement and extension levels, then continuously monitors the chart, issuing alerts as price interacts with those levels. This automation is valuable because manual drawing alone cannot provide ongoing analysis or real‑time feedback.
I will guide you step by step through the process of designing the tool and implementing it in MQL5. Please refer to the table of contents below; afterward, we will explain each section in detail:
- Designing the Tool
- Building the Interface
- Drawing Fibonacci Levels
- Making It Interactive
- Visualization
- Testing and Outcomes
- Conclusion
Designing the Tool
Before we begin designing the EA, it is important to understand what the Fibonacci Retracement tool is and how traders use it. The concept is derived from the mathematical sequence introduced by the Italian scholar Leonardo Fibonacci in the 13th century. Ratios taken from this sequence , such as 0.382 and 0.618, often appear in nature and are widely applied in market analysis to describe the proportional behavior of price movement. In MetaTrader 5, the Fibonacci Retracement tool can be found under Insert → Objects → Fibonacci → Retracement. Traders use it to identify potential support and resistance zones within a trend. However, once you draw the lines manually, they remain fixed and provide no automatic feedback as the market continues to move. Our goal is to improve this process through automation.
Before writing any code, we must design how the Interactive Fibonacci EA will behave and how traders will interact with it. Careful planning ensures that each feature has a defined purpose and that the tool behaves logically when running on a live chart.
The purpose of this EA is to make Fibonacci retracement analysis simpler, faster, and more adaptive. Instead of working as a static drawing tool, it functions as an active analysis assistant that visualizes retracement and extension levels while the market evolves.
Key design objectives:
- Simplify interaction: Allow users to type or adjust the swing high and swing low values (A and B) directly on the chart instead of dragging indicator handles.
- Automate analysis: Instantly draw retracement and extension levels, then monitor them in real time as the market moves.
- Enhance visualization: Present levels in a clear, stylish way using colors, line styles, and on‑chart labels for quick recognition.
- Provide feedback: Notify the trader whenever price touches a Fibonacci level through alerts, markers, or ticker updates.
- Improve usability: Replace multiple tool settings with a single, intuitive on‑screen panel for streamlined control.
In short, this design turns the standard static Fibonacci tool into a living, responsive assistant that combines analysis, automation, and presentation in one user‑friendly package.
Interface and Functional Design
Now that the purpose of the tool is clear, the next step is to design how traders will interact with it. The EA will feature an on‑chart control panel that allows users to set swing values, execute functions, and visualize feedback without opening the settings window. Keeping all controls on the chart creates a sense of immediacy and makes the tool far more convenient during active market analysis.
User Interface Layout
| Element | Type | Purpose |
|---|---|---|
| Label A | OBJ_LABEL | Static text “A:” written before the first input box |
| Edit Box A | OBJ_EDIT | Field where the user enters the swing‑low value (start of the move) |
| Label B | OBJ_LABEL | Static text “B:” written before the second input box |
| Edit Box B | OBJ_EDIT | Field for the swing‑high value (end of the move) |
| Draw Fib Button | OBJ_BUTTON | Executes calculation and plots all Fibonacci levels |
| Clear Button | OBJ_BUTTON | Removes previously drawn objects from the chart |
| Ticker Headline | OBJ_LABEL | Small scrolling bar used to display updates and alerts |
These objects form a compact interface that stays visible in the top‑left corner of the chart. They are created programmatically with ObjectCreate() and adjusted with ObjectSetInteger() and ObjectSetString() so that they maintain clear visibility even when the chart is zoomed or resized. The goal is to ensure that the panel is lightweight, intuitive, and always accessible without cluttering the trading area.
Functional Requirements
Each element in the interface performs a defined purpose within the EA. The A and B input boxes accept user‑defined swing values that represent the range to analyze. If these fields are left empty, the EA can estimate the most recent high and low levels from chart data. Pressing the Draw Fib button removes any previously drawn lines, calculates the standard Fibonacci retracement and extension ratios, and plots them as horizontal lines on the chart, complete with color‑coded markers and labels. The Clear button simply deletes all objects associated with the EA, providing a quick way to reset the chart. All user interactions are processed via the OnChartEvent() function, which responds immediately to input edits and button clicks. This design makes the tool responsive and easy to operate even when the market is moving fast. Traders can change the swing range or refresh the levels instantly without restarting the EA.
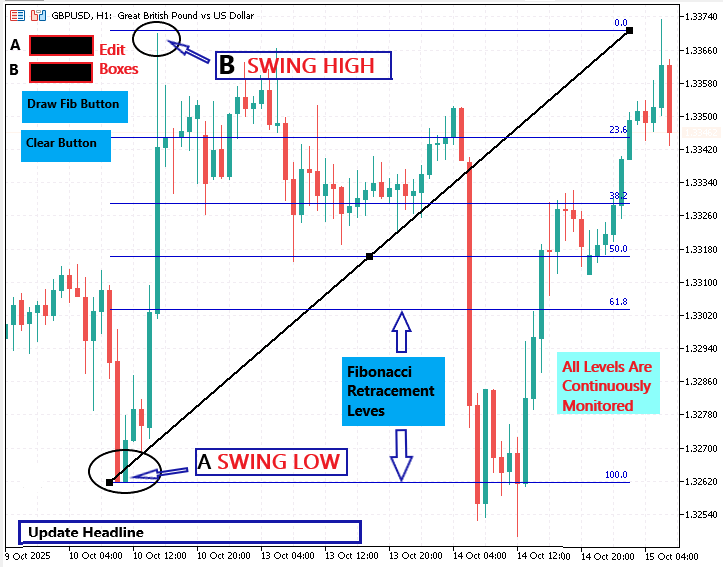
Visual Design
A consistent and readable visual style is vital when multiple lines appear on the chart. The EA uses a clear color scheme where bullish retracements are drawn in light green and bearish ones in tomato red. The most important levels—0%, 50%, and 100%—are emphasized in gold with thicker line widths. Labels use the Arial Black font at size 10 to ensure that text stays sharp against any chart theme. Each label includes both the percentage ratio and the exact price value, allowing traders to identify levels at a glance. At the bottom of the chart, a scrolling ticker headline displays alerts and updates such as “Monitoring Fibonacci levels 1.2000 → 1.2500” or “Price touched 61.8% level.” The colour of this ticker is controlled by the TickerColor input setting, letting users match it to their preferred chart palette. Together, these design choices create a neat, modern visual presentation that adds clarity without distraction.
Core Logic Concept
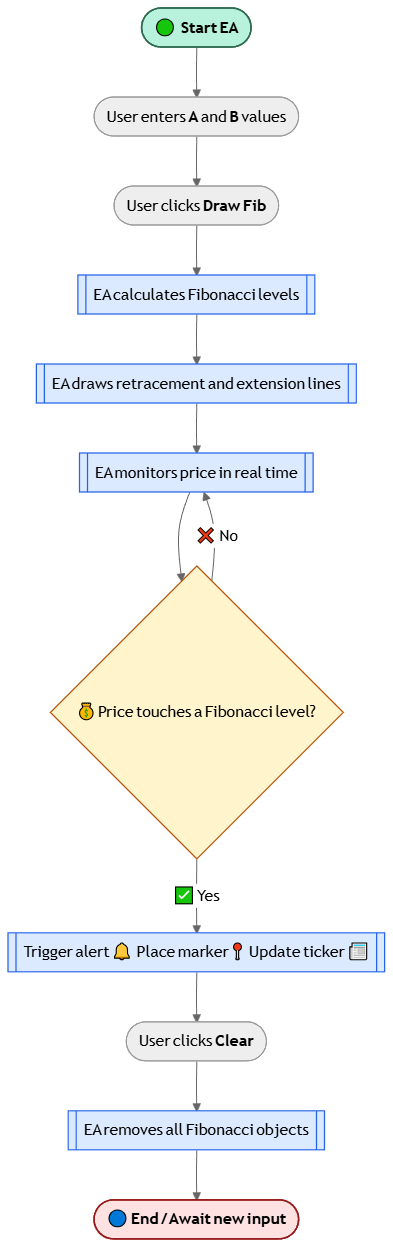
Behind the scenes, the system follows a straightforward logic. When the trader enters swing values and presses Draw Fib, the EA calculates each ratio and draws corresponding lines and labels. With every new price tick, it checks whether the current Bid or Ask is within a small range of any Fibonacci level. When a match occurs, the EA triggers an alert, marks the event on the chart, and posts an update in the headline. This process continues autonomously, transforming the static Fibonacci tool into a responsive analytical assistant that operates while the trader focuses on decision‑making.
Below is a flowchart of the Interactive Fibonacci Tool showing the sequence of user input, EA processing, and real-time feedback.
Building the Interface
Once the design phase is complete, the next step is to convert the concept into working objects on the chart. MetaTrader 5 provides a graphical object system that makes this possible. Each object—whether a button, label, or input box—is created using the ObjectCreate() function and then customized through property‑setting functions such as ObjectSetInteger() and ObjectSetString(). By combining these graphical elements, we can design an on‑screen panel that serves as the main control center for the Fibonacci tool.
Creating the Panel Elements
The following example shows how the fundamental elements of the panel are created. It includes two labeled input boxes where the user can type the swing‑low and swing‑high values, plus two command buttons for drawing and clearing Fibonacci levels.
void CreateInterface()
{
   long chartID = ChartID();

   // --- Label A
   ObjectCreate(chartID, "lbl_A", OBJ_LABEL, 0, 0, 0);
   ObjectSetInteger(chartID, "lbl_A", OBJPROP_XDISTANCE, 10);
   ObjectSetInteger(chartID, "lbl_A", OBJPROP_YDISTANCE, 20);
   ObjectSetString(chartID,  "lbl_A", OBJPROP_TEXT, "A:");
   ObjectSetInteger(chartID, "lbl_A", OBJPROP_COLOR, clrWhite);
   ObjectSetInteger(chartID, "lbl_A", OBJPROP_FONTSIZE, 10);

   // --- Edit box for A value
   ObjectCreate(chartID, "edit_A", OBJ_EDIT, 0, 0, 0);
   ObjectSetInteger(chartID, "edit_A", OBJPROP_XDISTANCE, 25);
   ObjectSetInteger(chartID, "edit_A", OBJPROP_YDISTANCE, 15);
   ObjectSetInteger(chartID, "edit_A", OBJPROP_BGCOLOR, clrBlack);
   ObjectSetInteger(chartID, "edit_A", OBJPROP_COLOR, clrLime);
   ObjectSetString(chartID,  "edit_A", OBJPROP_TEXT, "");

   // --- Label B
   ObjectCreate(chartID, "lbl_B", OBJ_LABEL, 0, 0, 0);
   ObjectSetInteger(chartID, "lbl_B", OBJPROP_XDISTANCE, 10);
   ObjectSetInteger(chartID, "lbl_B", OBJPROP_YDISTANCE, 45);
   ObjectSetString(chartID,  "lbl_B", OBJPROP_TEXT, "B:");
   ObjectSetInteger(chartID, "lbl_B", OBJPROP_COLOR, clrWhite);
   ObjectSetInteger(chartID, "lbl_B", OBJPROP_FONTSIZE, 10);

   // --- Edit box for B value
   ObjectCreate(chartID, "edit_B", OBJ_EDIT, 0, 0, 0);
   ObjectSetInteger(chartID, "edit_B", OBJPROP_XDISTANCE, 25);
   ObjectSetInteger(chartID, "edit_B", OBJPROP_YDISTANCE, 40);
   ObjectSetInteger(chartID, "edit_B", OBJPROP_BGCOLOR, clrBlack);
   ObjectSetInteger(chartID, "edit_B", OBJPROP_COLOR, clrLime);
   ObjectSetString(chartID,  "edit_B", OBJPROP_TEXT, "");

   // --- Draw Fib button
   ObjectCreate(chartID, "btn_Draw", OBJ_BUTTON, 0, 0, 0);
   ObjectSetInteger(chartID, "btn_Draw", OBJPROP_XDISTANCE, 10);
   ObjectSetInteger(chartID, "btn_Draw", OBJPROP_YDISTANCE, 70);
   ObjectSetInteger(chartID, "btn_Draw", OBJPROP_BGCOLOR, clrDarkGreen);
   ObjectSetInteger(chartID, "btn_Draw", OBJPROP_COLOR, clrWhite);
   ObjectSetString(chartID,  "btn_Draw", OBJPROP_TEXT, "Draw Fib");

   // --- Clear button
   ObjectCreate(chartID, "btn_Clear", OBJ_BUTTON, 0, 0, 0);
   ObjectSetInteger(chartID, "btn_Clear", OBJPROP_XDISTANCE, 100);
   ObjectSetInteger(chartID, "btn_Clear", OBJPROP_YDISTANCE, 70);
   ObjectSetInteger(chartID, "btn_Clear", OBJPROP_BGCOLOR, clrMaroon);
   ObjectSetInteger(chartID, "btn_Clear", OBJPROP_COLOR, clrWhite);
   ObjectSetString(chartID,  "btn_Clear", OBJPROP_TEXT, "Clear");
}
This CreateInterface() function builds the visual layout you designed earlier. ObjectCreate() defines each graphical element and assigns it a unique name that can later be referenced for updates or deletion. The positioning of objects is managed through distance properties (OBJPROP_XDISTANCE and OBJPROP_YDISTANCE), which ensure that every element is drawn relative to the chart’s top‑left corner. Colors, text content, and fonts are then assigned with additional ObjectSetInteger() and ObjectSetString() calls. By doing so, each item of the interface—labels, input boxes, and buttons—appears in a consistent, easy‑to‑read style directly on the chart.
Initializing the Panel Automatically
To ensure this interface appears instantly when the EA is attached to a chart, the creation function is called from within the OnInit() event. This event runs only once when the Expert Advisor is loaded, so it is the perfect place to perform setup tasks.
int OnInit()
{
   CreateInterface();
   Print("Fibonacci Interface Initialized");
   return(INIT_SUCCEEDED);
}
By embedding the panel initialization inside OnInit(), you guarantee that every time the EA starts, the interface is drawn automatically without user intervention. The Print() statement is optional but useful for confirming in the terminal log that your interface loaded correctly.
Handling User Interaction
The next part of the interface logic involves responding to trader actions. MetaTrader 5 uses the OnChartEvent() function to notify the EA about any activity on the chart—for example, pressing a button or editing text in an input box. The following code shows how to capture those interactions:
void OnChartEvent(const int id,
                  const long &lparam,
                  const double &dparam,
                  const string &sparam)
{
   if(id == CHARTEVENT_OBJECT_CLICK)
   {
      if(sparam == "btn_Draw")    HandleDraw();   // Draw Fibonacci levels
      if(sparam == "btn_Clear")   HandleClear();  // Clear all objects
   }
}
Whenever an event occurs, the platform sends the object’s name through sparam. By checking this parameter, you can identify which button was clicked and call the corresponding function. In this example, when “Draw Fib” is pressed, the placeholder function HandleDraw() will later be used to collect the user’s A and B values, compute the retracement ratios, and plot the Fibonacci levels. Similarly, the “Clear” button triggers HandleClear(), which will remove all Fibonacci‑related objects from the chart. This structure makes the EA event‑driven, meaning it reacts instantly to inputs just like a GUI program rather than performing everything in a continuous loop.
After implementing the CreateInterface() and OnChartEvent() logic, your EA now includes a fully functional on‑screen control panel that accepts typed values and responds to button clicks. It represents the backbone of the tool’s user experience—a bridge between trader actions and algorithmic responses. Because each object is independent and named explicitly, you can later modify colors, text, and positions without affecting the structure. This flexibility is valuable when scaling up the tool or adding features such as auto‑detection, level labels, or style customization through inputs.
At this stage, the graphical panel is ready; it can collect swing high and low levels from the user and respond to basic interaction events. The next step, described in the section that follows, Drawing Fibonacci Levels, will show how to transform those user inputs into dynamic retracement and extension lines that automatically adapt to market behavior.

The panel provides input fields A and B for swing points, action buttons Draw Fib and Clear, and a ticker message area that reports the tool’s status in real time.
Drawing Fibonacci Levels
With the interface in place and user input enabled, the core of our tool is the ability to dynamically draw Fibonacci retracement and extension levels on the chart. This feature transforms the tool from a simple input panel into an active analytical assistant. Let’s explore how to turn user-supplied swing points into visual objects that are both informative and easy to interpret during real-time trading.
Understanding Fibonacci Ratios and Their Importance
Fibonacci ratios underpin many technical analysis strategies, as traders believe that price often reacts at levels related to these ratios. The most widely used retracement levels are 23.6%, 38.2%, 50%, 61.8%, and 78.6%, with the 50% level being a psychological midpoint even though it’s not a true Fibonacci ratio. Extension levels such as 127.2%, 161.8%, and 261.8% are used to project possible targets beyond the original price move. By plotting these levels, traders may anticipate areas of support, resistance, or potential price reversal.
Translating User Input into Level Prices
After the user inputs the swing high (B) and swing low (A), the EA must calculate the corresponding price for each Fibonacci ratio. The direction of the calculation depends on the trend—if A is less than B, the move is upward, and the retracement levels are measured downward; if A is greater than B, the move is downward, and levels are measured upward. Extension levels project beyond the swing endpoint in the direction of the trend.
For example, to calculate a 61.8% retracement in an uptrend, use the formula:
- Level_Price = B - (B - A) * 0.618
This means you’re measuring 61.8% of the move from B back towards A. For a 161.8% extension, the formula is:
- Level_Price = B + (B - A) * 0.618
This projects 61.8% of the original swing beyond point B.
Implementing the Drawing Logic in MQL5
To translate these ratios into chart lines and labels, use MQL5’s graphic object functions. Below is a function that draws each retracement and extension level as a horizontal line, with a label beside it showing the ratio and the exact price.
void DrawFibonacciLevels(double A, double B)
{
   long chartID = ChartID();
   double ratios[]     = {0.0, 0.236, 0.382, 0.5, 0.618, 0.786, 1.0};
   double extensions[] = {1.272, 1.618, 2.618};
   color keyLevelColor = clrGold;

   // Draw retracement levels
   for(int i=0; i<ArraySize(ratios); i++)
   {
      double price = B - (B - A) * ratios[i];
      string levelName = StringFormat("FIB_RET_%d", int(ratios[i]*1000));
      ObjectCreate(chartID, levelName, OBJ_HLINE, 0, 0, price);
      ObjectSetInteger(chartID, levelName, OBJPROP_COLOR, (ratios[i]==0.5 || ratios[i]==0 || ratios[i]==1.0) ? keyLevelColor : clrLime);
      ObjectSetInteger(chartID, levelName, OBJPROP_WIDTH, (ratios[i]==0.5 || ratios[i]==0 || ratios[i]==1.0) ? 2 : 1);

      // Draw label for each level
      string labelName = StringFormat("FIB_LABEL_%d", int(ratios[i]*1000));
      ObjectCreate(chartID, labelName, OBJ_TEXT, 0, TimeCurrent(), price);
      ObjectSetString(chartID, labelName, OBJPROP_TEXT, StringFormat("%.1f%% (%.5f)", ratios[i]*100, price));
      ObjectSetInteger(chartID, labelName, OBJPROP_COLOR, (ratios[i]==0.5 || ratios[i]==0 || ratios[i]==1.0) ? keyLevelColor : clrWhite);
      ObjectSetInteger(chartID, labelName, OBJPROP_FONTSIZE, 10);
   }

   // Draw extension levels
   for(int i=0; i<ArraySize(extensions); i++)
   {
      double price = B + (B - A) * (extensions[i] - 1);
      string levelName = StringFormat("FIB_EXT_%d", int(extensions[i]*1000));
      ObjectCreate(chartID, levelName, OBJ_HLINE, 0, 0, price);
      ObjectSetInteger(chartID, levelName, OBJPROP_COLOR, clrTomato);
      ObjectSetInteger(chartID, levelName, OBJPROP_WIDTH, 1);

      // Draw label for each extension
      string labelName = StringFormat("FIB_EXT_LABEL_%d", int(extensions[i]*1000));
      ObjectCreate(chartID, labelName, OBJ_TEXT, 0, TimeCurrent(), price);
      ObjectSetString(chartID, labelName, OBJPROP_TEXT, StringFormat("%.1f%% (%.5f)", extensions[i]*100, price));
      ObjectSetInteger(chartID, labelName, OBJPROP_COLOR, clrTomato);
      ObjectSetInteger(chartID, labelName, OBJPROP_FONTSIZE, 10);
   }
}
This function draws the levels and ensures that key retracement lines (0%, 50%, 100%) are visually distinct, using a gold color and thicker lines. All other retracement levels use a lime color, while extension levels are styled in tomato red. Each line is labelled with its ratio and price, so traders can immediately see the significance of every level.
Integrating Drawing with User Actions
To make this function responsive to user input, it should be called whenever the Draw Fib button is pressed. This is typically handled in your HandleDraw() function. The EA reads the text from the input boxes, converts them to numbers, and then calls DrawFibonacciLevels().
void HandleDraw()
{
   string strA = ObjectGetString(ChartID(), "edit_A", OBJPROP_TEXT);
   string strB = ObjectGetString(ChartID(), "edit_B", OBJPROP_TEXT);
   double A = StringToDouble(strA);
   double B = StringToDouble(strB);
   DrawFibonacciLevels(A, B);
}
This integration ensures that the drawing logic is only triggered when valid inputs are provided, and it keeps the interface responsive and user-driven.
Why Visual Styling Matters
The choice of color, label font, and line width is not just aesthetic—clear styling helps traders quickly distinguish the most critical levels from minor ones. This is particularly important in fast-moving markets, where clarity can make the difference between a well-timed trade and a missed opportunity. Using gold for the key levels draws the trader’s eye to the most statistically significant retracements and extensions.
Preparing for Interactivity
With Fibonacci levels now drawn programmatically, your EA is ready for the next evolution: interactivity. The next section will extend this foundation by letting the EA monitor real-time price movements. You’ll enable alerts and visual cues whenever the price touches a Fibonacci level, making your tool much more powerful than a static drawing utility.
Making it Interactive
Drawing Fibonacci levels is a powerful first step, but the true advantage of automation comes from making those levels responsive to market action. In this section, we will enhance the EA so it actively monitors price movements and provides real-time feedback when the price approaches or touches any Fibonacci retracement or extension level. This transforms the tool from a passive visual aid into an active market assistant.
Monitoring Price in Real Time
To detect when price interacts with a Fibonacci level, the EA must continuously observe the market’s Bid (or Ask) price. This is done in the OnTick() function, which is triggered every time a new tick arrives. By comparing the current price to the values of all drawn levels, the EA can determine if a significant event has occurred.
Detecting Touches and Issuing Alerts
A practical approach is to define a small tolerance, or “touch zone,” around each Fibonacci line. If the Bid price falls within this margin, the EA considers the level “touched.” Whenever a touch is detected, the EA should provide immediate feedback. This can include an on-screen marker, an audio alert, and an update in the headline ticker.
Here’s an example of how this can be implemented:
double TouchZone = 0.00015; // Sensitivity for level touch (adjust for instrument)

void OnTick()
{
   double price = SymbolInfoDouble(_Symbol, SYMBOL_BID);
   long chartID = ChartID();

   // Check retracement levels
   double ratios[] = {0.0, 0.236, 0.382, 0.5, 0.618, 0.786, 1.0};
   for(int i=0; i<ArraySize(ratios); i++)
   {
      string levelName = StringFormat("FIB_RET_%d", int(ratios[i]*1000));
      double levelPrice = ObjectGetDouble(chartID, levelName, OBJPROP_PRICE);

      if(MathAbs(price - levelPrice) <= TouchZone)
      {
         MarkFibonacciTouch(levelName, levelPrice);
         PlaySound("alert.wav"); // Optional: play audio alert
         UpdateTicker(StringFormat("Price touched %s (%.1f%%)", levelName, ratios[i]*100));
      }
   }

   // Check extension levels
   double extensions[] = {1.272, 1.618, 2.618};
   for(int i=0; i<ArraySize(extensions); i++)
   {
      string levelName = StringFormat("FIB_EXT_%d", int(extensions[i]*1000));
      double levelPrice = ObjectGetDouble(chartID, levelName, OBJPROP_PRICE);

      if(MathAbs(price - levelPrice) <= TouchZone)
      {
         MarkFibonacciTouch(levelName, levelPrice);
         PlaySound("alert.wav");
         UpdateTicker(StringFormat("Price touched %s (%.1f%%)", levelName, extensions[i]*100));
      }
   }
}
Visual and Audible Feedback
The MarkFibonacciTouch() function can be used to place an arrow or other marker on the chart at the point of contact. This gives traders an immediate visual indication of the event, even if they missed the audio alert. The UpdateTicker() function updates the on-chart headline, providing a running record of significant market events.
void MarkFibonacciTouch(string baseName, double price)
{
   long chartID = ChartID();
   string markerName = baseName + "_TOUCH";
   ObjectCreate(chartID, markerName, OBJ_ARROW, 0, TimeCurrent(), price);
   ObjectSetInteger(chartID, markerName, OBJPROP_COLOR, clrYellow);
   ObjectSetInteger(chartID, markerName, OBJPROP_WIDTH, 2);
}
Updating the Ticker Headline
The ticker headline acts as the EA’s real-time status feed. Every time a Fibonacci level is touched, the ticker is updated to notify the user. This approach ensures traders are always aware of important price interactions without needing to scan the entire chart constantly.
void UpdateTicker(string text)
{
   long chartID = ChartID();
   ObjectSetString(chartID, "Ticker_Headline", OBJPROP_TEXT, text);
}
By actively tracking price and responding to key Fibonacci levels with alerts and markers, the EA provides several distinct advantages:
- Reduced missed opportunities: Traders receive immediate feedback on important market events, even when monitoring multiple charts.
- Increased confidence: Visual and audible cues confirm that price is responding to known technical levels.
- Efficient workflow: Automated alerts and updates reduce the need for constant manual chart-watching.
Visualization
A powerful trading tool provides more than just automation or alerts. It must also deliver information clearly and intuitively. Visual clarity helps traders make faster, more confident decisions, especially when multiple lines and labels appear on the chart. In this section, we will refine the appearance of our Fibonacci tool, focusing on the readability and usability of every on-screen element.
When displaying multiple Fibonacci levels, it’s easy for a chart to become cluttered. To combat this, we use a consistent color scheme to distinguish key levels, such as 0%, 50%, and 100%, from less significant ones. For example, using gold for major retracement lines and a lighter green or red for minor levels allows traders to focus on the most statistically significant areas at a glance. Extension levels are styled in a contrasting color, such as tomato red, to prevent confusion with retracements.
Font style and size are equally important. Using a bold, legible font like Arial Black at a reasonable size (e.g., 10pt) ensures that labels remain readable against any background color or chart zoom level. Avoiding excessive text or decorations helps maintain a professional, uncluttered look.
Ticker and Label Presentation
The ticker headline is a central feature for real-time updates. To maximize its effectiveness, position it at the bottom left or right of the chart, where it is less likely to overlap with price action or key technical areas. Choose a font color and background that contrast well with the chart’s theme, and consider allowing users to customize the ticker’s appearance via an EA input variable (e.g., input color TickerColor = clrLime;).
For labels, ensure they do not overlap significantly with price bars or each other. You can increment the vertical offset for each new label or use the OBJPROP_YDISTANCE property to space them evenly. If your tool draws both Fibonacci retracements and extensions, group the labels accordingly—perhaps using a slightly different color or prefix for extension levels.
Below is an example of the ticker and label drawing logic:
// Drawing the ticker with configurable color and position
void DrawTicker(string text, color textColor = clrLime, int x = 10, int y = 400)
{
   long chartID = ChartID();
   string tickerName = "Ticker_Headline";
   ObjectCreate(chartID, tickerName, OBJ_LABEL, 0, 0, 0);
   ObjectSetInteger(chartID, tickerName, OBJPROP_XDISTANCE, x);
   ObjectSetInteger(chartID, tickerName, OBJPROP_YDISTANCE, y);
   ObjectSetString(chartID, tickerName, OBJPROP_TEXT, text);
   ObjectSetInteger(chartID, tickerName, OBJPROP_COLOR, textColor);
   ObjectSetInteger(chartID, tickerName, OBJPROP_FONTSIZE, 10);
   ObjectSetInteger(chartID, tickerName, OBJPROP_CORNER, CORNER_LEFT_LOWER);
}

// Enhanced label drawing with dynamic spacing and color
void DrawLevelLabel(string name, double price, string label, color c, int y_offset)
{
   long chartID = ChartID();
   ObjectCreate(chartID, name, OBJ_TEXT, 0, TimeCurrent(), price);
   ObjectSetString(chartID, name, OBJPROP_TEXT, label);
   ObjectSetInteger(chartID, name, OBJPROP_COLOR, c);
   ObjectSetInteger(chartID, name, OBJPROP_FONTSIZE, 10);
   ObjectSetInteger(chartID, name, OBJPROP_YDISTANCE, y_offset);
}
With these refinements, both the ticker and the level labels become easy to read and visually harmonious with the rest of the chart. Traders can immediately identify which levels are most important and track live updates without confusion.
Testing and Outcomes
Testing is a critical phase that ensures the Fibonacci tool performs as expected under real market conditions. It helps identify bugs, usability issues, or inaccuracies that might not be apparent during development. Proper testing increases trader confidence and supports continuous improvement of the tool. The diagram below illustrates the process of attaching the Expert Advisor (EA) to a chart and displays how the interface appears before any operations are performed.
To evaluate the Fibonacci tool’s performance under real trading conditions, the EA was attached to both live and demo charts within MetaTrader 5. Various pairs and timeframes were selected to verify the tool’s robustness across different market environments. After loading the EA, diverse swing‑low (A) and swing‑high (B) values were manually entered into the on‑chart input fields, representing both upward and downward trends. For each scenario, observations focused on whether the EA plotted Fibonacci retracement and extension lines at the correct price levels. Label readability and styling consistency were carefully reviewed to ensure compliance with the intended design. As price action evolved, the drawn levels were monitored to confirm proper alignment with actual market swings and visual stability at various zoom levels and symbols. Another testing example is shown below.
Beyond simply plotting Fibonacci levels, the tool’s usability relies on seamless interaction with its on‑chart controls. Each interface element was systematically tested, including the input fields for points A and B, the Draw Fib and Clear buttons, and the ticker headline. Entering or adjusting values in the input fields immediately triggered updates in the drawn Fibonacci levels when Draw Fib was pressed. The Clear function was verified to ensure that it reliably removed all previously drawn objects, restoring a clean chart state. To assess error handling, intentionally invalid or blank inputs were provided; in every case, the EA responded gracefully by displaying an error message or preventing further actions until valid data was entered. Finally, the responsiveness of the ticker was evaluated by observing how quickly it updated status messages following each user interaction.
2025.10.15 12:43:12.132 Interactive Fibonacci EA (Volatility 75 (1s) Index,M15) Alert: Touch: FIB_0.000 @ 4148.78000
2025.10.15 12:43:12.132 Interactive Fibonacci EA (Volatility 75 (1s) Index,M15) Touch: FIB_0.000 @ 4148.78000
To validate the tool’s interactivity, testing focused on how it responded when price action approached or touched any of the drawn Fibonacci levels. During live market movements, the EA’s capability to detect when the Bid price entered the defined touch zone of a retracement or extension line was closely monitored. Whenever such an event occurred, the tool delivered immediate feedback: an on‑chart marker was displayed at the touched level, an audio alert was activated, and the ticker headline instantly updated with a concise event message.

This confirmed that the alert and event system functioned as intended, ensuring that traders receive timely notifications of significant technical interactions without needing to constantly watch the chart.
Conclusion
The Interactive Fibonacci Tool combines automated analysis, real-time alerts, and a user-friendly interface to streamline Fibonacci-based trading in MetaTrader 5. Through careful design, thorough testing, and clear visual feedback, the tool empowers traders to identify key market levels efficiently and respond quickly to price action. With its adaptive and intuitive features, this EA is a valuable addition to any trader’s toolkit.
Please note that this tool does not execute or open trades. It functions as an automated assistant for price action analysis in MetaTrader 5, serving educational purposes. Traders can use it alongside their own strategies and other forms of market confirmation.
Warning: All rights to these materials are reserved by MetaQuotes Ltd. Copying or reprinting of these materials in whole or in part is prohibited.
This article was written by a user of the site and reflects their personal views. MetaQuotes Ltd is not responsible for the accuracy of the information presented, nor for any consequences resulting from the use of the solutions, strategies or recommendations described.

- Free trading apps
- Over 8,000 signals for copying
- Economic news for exploring financial markets
You agree to website policy and terms of use