MQL5 Programming Articles

Study the MQL5 language for programming trading strategies in numerous published articles mostly written by you - the community members. The articles are grouped into categories to help you quicker find answers to any questions related to programming: Integration, Tester, Trading Strategies, etc.
Follow our new publications and discuss them on the Forum!
Add a new article

You are missing trading opportunities:
- Free trading apps
- Over 8,000 signals for copying
- Economic news for exploring financial markets
Registration
Log in
You agree to website policy and terms of use
If you do not have an account, please register


Multibot in MetaTrader: Launching multiple robots from a single chart
In this article, I will consider a simple template for creating a universal MetaTrader robot that can be used on multiple charts while being attached to only one chart, without the need to configure each instance of the robot on each individual chart.


Library for easy and quick development of MetaTrader programs (part XXVII): Working with trading requests - placing pending orders
In this article, we will continue the development of trading requests, implement placing pending orders and eliminate detected shortcomings of the trading class operation.

Data Science and Machine Learning (Part 01): Linear Regression
It's time for us as traders to train our systems and ourselves to make decisions based on what number says. Not on our eyes, and what our guts make us believe, this is where the world is heading so, let us move perpendicular to the direction of the wave.


Automating Trading Strategies in MQL5 (Part 7): Building a Grid Trading EA with Dynamic Lot Scaling
In this article, we build a grid trading expert advisor in MQL5 that uses dynamic lot scaling. We cover the strategy design, code implementation, and backtesting process. Finally, we share key insights and best practices for optimizing the automated trading system.


How to develop any type of Trailing Stop and connect it to an EA
In this article, we will look at classes for convenient creation of various trailings, as well as learn how to connect a trailing stop to any EA.

What you can do with Moving Averages
The article considers several methods of applying the Moving Average indicator. Each method involving a curve analysis is accompanied by indicators visualizing the idea. In most cases, the ideas shown here belong to their respected authors. My sole task was to bring them together to let you see the main approaches and, hopefully, make more reasonable trading decisions. MQL5 proficiency level — basic.

Building interactive semi-automatic drag-and-drop Expert Advisor based on predefined risk and R/R ratio
Some traders execute all their trades automatically, and some mix automatic and manual trades based on the output of several indicators. Being a member of the latter group I needed an interactive tool to asses dynamically risk and reward price levels directly from the chart. This article will present a way to implement an interactive semi-automatic Expert Advisor with predefined equity risk and R/R ratio. The Expert Advisor risk, R/R and lot size parameters can be changed during runtime on the EA panel.


Price Action Analysis Toolkit Development (Part 63): Automating Rising and Falling Wedge Detection in MQL5
In this part of the Price Action Analysis Toolkit Development series, we develop an MQL5 indicator that automatically detects rising and falling wedge patterns in real time. The system confirms pivot structures, validates boundary convergence mathematically, prevents overlapping formations, and monitors breakout and failure conditions with precise visual feedback. Built using a clean object-oriented architecture, this implementation converts subjective wedge recognition into a structured, state-aware analytical component designed to strengthen disciplined price action analysis.


Exploring options for creating multicolored candlesticks
In this article I will address the possibilities of creating customized indicators with candlesticks, pointing out their advantages and disadvantages.

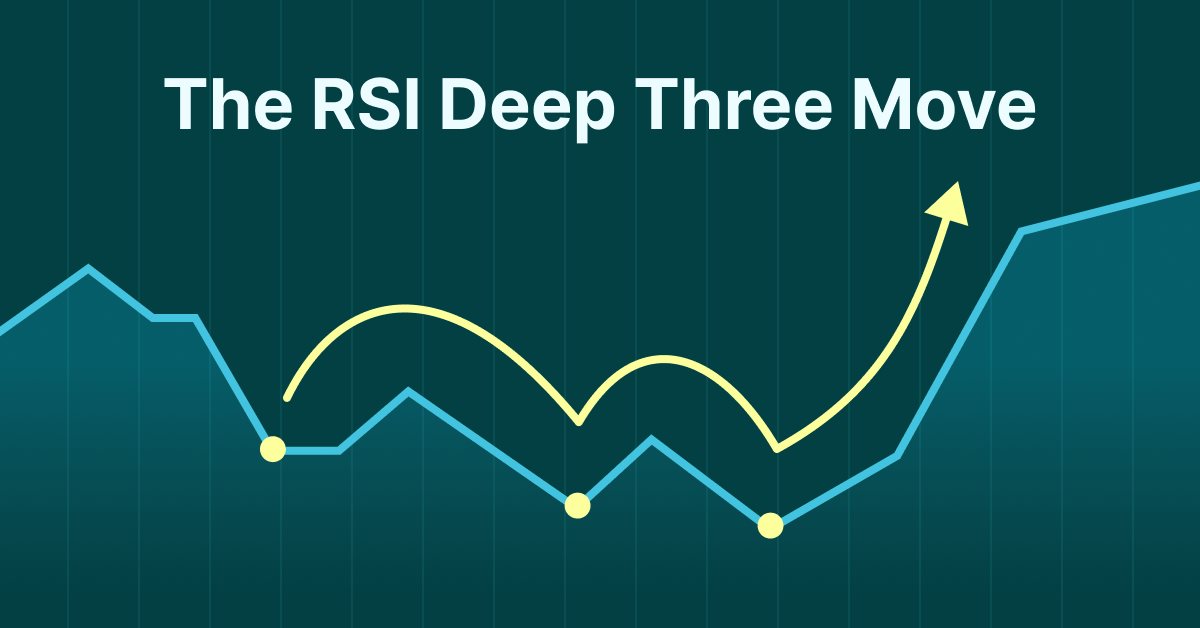
The RSI Deep Three Move Trading Technique
Presenting the RSI Deep Three Move Trading Technique in MetaTrader 5. This article is based on a new series of studies that showcase a few trading techniques based on the RSI, a technical analysis indicator used to measure the strength and momentum of a security, such as a stock, currency, or commodity.


Practical application of neural networks in trading (Part 2). Computer vision
The use of computer vision allows training neural networks on the visual representation of the price chart and indicators. This method enables wider operations with the whole complex of technical indicators, since there is no need to feed them digitally into the neural network.

Timeseries in DoEasy library (part 37): Timeseries collection - database of timeseries by symbols and periods
The article deals with the development of the timeseries collection of specified timeframes for all symbols used in the program. We are going to develop the timeseries collection, the methods of setting collection's timeseries parameters and the initial filling of developed timeseries with historical data.


The Inverse Fair Value Gap Trading Strategy
An inverse fair value gap(IFVG) occurs when price returns to a previously identified fair value gap and, instead of showing the expected supportive or resistive reaction, fails to respect it. This failure can signal a potential shift in market direction and offer a contrarian trading edge. In this article, I'm going to introduce my self-developed approach to quantifying and utilizing inverse fair value gap as a strategy for MetaTrader 5 expert advisors.


Creating an Interactive Graphical User Interface in MQL5 (Part 1): Making the Panel
This article explores the fundamental steps in crafting and implementing a Graphical User Interface (GUI) panel using MetaQuotes Language 5 (MQL5). Custom utility panels enhance user interaction in trading by simplifying common tasks and visualizing essential trading information. By creating custom panels, traders can streamline their workflow and save time during trading operations.

Modeling time series using custom symbols according to specified distribution laws
The article provides an overview of the terminal's capabilities for creating and working with custom symbols, offers options for simulating a trading history using custom symbols, trend and various chart patterns.


Building a Custom Market Regime Detection System in MQL5 (Part 1): Indicator
This article details creating an MQL5 Market Regime Detection System using statistical methods like autocorrelation and volatility. It provides code for classes to classify trending, ranging, and volatile conditions and a custom indicator.


Matrices and vectors in MQL5
By using special data types 'matrix' and 'vector', it is possible to create code which is very close to mathematical notation. With these methods, you can avoid the need to create nested loops or to mind correct indexing of arrays in calculations. Therefore, the use of matrix and vector methods increases the reliability and speed in developing complex programs.

Graphical Interfaces VII: the Tables Controls (Chapter 1)
The seventh part of the series on MetaTrader graphical interfaces deals with three table types: text label, edit box and rendered one. Another important and frequently used controls are tabs allowing you to show/hide groups of other controls and develop space effective interfaces in your MQL applications.


Using the CCanvas class in MQL applications
The article considers the use of the CCanvas class in MQL applications. The theory is accompanied by detailed explanations and examples for thorough understanding of CCanvas basics.


Manual charting and trading toolkit (Part III). Optimization and new tools
In this article, we will further develop the idea of drawing graphical objects on charts using keyboard shortcuts. New tools have been added to the library, including a straight line plotted through arbitrary vertices, and a set of rectangles that enable the evaluation of the reversal time and level. Also, the article shows the possibility to optimize code for improved performance. The implementation example has been rewritten, allowing the use of Shortcuts alongside other trading programs. Required code knowledge level: slightly higher than a beginner.


Modified Grid-Hedge EA in MQL5 (Part II): Making a Simple Grid EA
In this article, we explored the classic grid strategy, detailing its automation using an Expert Advisor in MQL5 and analyzing initial backtest results. We highlighted the strategy's need for high holding capacity and outlined plans for optimizing key parameters like distance, takeProfit, and lot sizes in future installments. The series aims to enhance trading strategy efficiency and adaptability to different market conditions.

Fast Testing of Trading Ideas on the Chart
The article describes the method of fast visual testing of trading ideas. The method is based on the combination of a price chart, a signal indicator and a balance calculation indicator. I would like to share my method of searching for trading ideas, as well as the method I use for fast testing of these ideas.


Learn how to design a trading system by Alligator
In this article, we'll complete our series about how to design a trading system based on the most popular technical indicator. We'll learn how to create a trading system based on the Alligator indicator.


Money management in trading
We will look at several new ways of building money management systems and define their main features. Today, there are quite a few money management strategies to fit every taste. We will try to consider several ways to manage money based on different mathematical growth models.

Self-adapting algorithm (Part IV): Additional functionality and tests
I continue filling the algorithm with the minimum necessary functionality and testing the results. The profitability is quite low but the articles demonstrate the model of the fully automated profitable trading on completely different instruments traded on fundamentally different markets.

Library for easy and quick development of MetaTrader programs (part XVII): Interactivity of library objects
In this article, we are going to finish the development of the base object of all library objects, so that any library object based on it is able to interact with a user. For example, users will be able to set the maximum acceptable size of a spread for opening a position and a price level, upon reaching which an event from a symbol object is sent to the program with the spread or price level-based signal.


Implementing a Bollinger Bands Trading Strategy with MQL5: A Step-by-Step Guide
A step-by-step guide to implementing an automated trading algorithm in MQL5 based on the Bollinger Bands trading strategy. A detailed tutorial based on creating an Expert Advisor that can be useful for traders.


Automating Trading Strategies in MQL5 (Part 24): London Session Breakout System with Risk Management and Trailing Stops
In this article, we develop a London Session Breakout System that identifies pre-London range breakouts and places pending orders with customizable trade types and risk settings. We incorporate features like trailing stops, risk-to-reward ratios, maximum drawdown limits, and a control panel for real-time monitoring and management.

Analyzing charts using DeMark Sequential and Murray-Gann levels
Thomas DeMark Sequential is good at showing balance changes in the price movement. This is especially evident if we combine its signals with a level indicator, for example, Murray levels. The article is intended mostly for beginners and those who still cannot find their "Grail". I will also display some features of building levels that I have not seen on other forums. So, the article will probably be useful for advanced traders as well... Suggestions and reasonable criticism are welcome...


Creating a comprehensive Owl trading strategy
My strategy is based on the classic trading fundamentals and the refinement of indicators that are widely used in all types of markets. This is a ready-made tool allowing you to follow the proposed new profitable trading strategy.

Combination scalping: analyzing trades from the past to increase the performance of future trades
The article provides the description of the technology aimed at increasing the effectiveness of any automated trading system. It provides a brief explanation of the idea, as well as its underlying basics, possibilities and disadvantages.


How We Built the Most Powerful Machine Learning-Powered Trading Platform: The Evolution of MQL and MetaTrader Through Archives, Forums, and Releases
A technical history of MQL evolution: from the limited MQL and MQL II languages, through procedural MQL4, to object-oriented MQL5 with native compilation, rich APIs, and a full-fledged engineering environment. We show here the key capabilities of the language and its integrations with Python, OpenCL, ONNX, OpenBLAS, databases, DirectX, the agentic AI Assistant, and the Model Context Protocol (MCP), which connects AI systems with the terminal, MetaEditor, market data, trading operations, and development tools. This article examines archival materials on the origins of MetaQuotes and MetaTrader, the launch of MQL4.COM and MQL5.COM, the championships, Algo Forge, and their impact on the ecosystem.

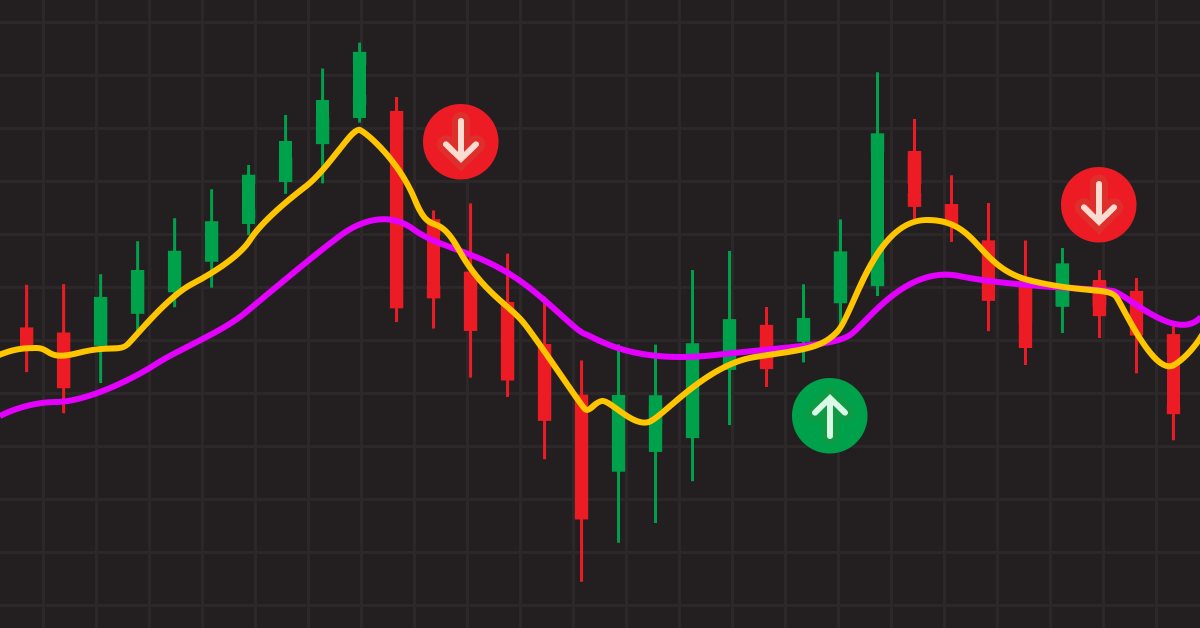
Can Heiken-Ashi Combined With Moving Averages Provide Good Signals Together?
Combinations of strategies may offer better opportunities. We can combine indicators or patterns together, or even better, indicators with patterns, so that we get an extra confirmation factor. Moving averages help us confirm and ride the trend. They are the most known technical indicators and this is because of their simplicity and their proven track record of adding value to analyses.

Better Programmer (Part 06): 9 habits that lead to effective coding
It's not always all about writing the code that leads to effective coding. There are certain habits that I have found in my experience that lead to effective coding. We are going to discuss some of them in detail in this article. This is a must-read article for every programmer who wants to improve their ability to write complex algorithms with less hassle.

A Few Tips for First-Time Customers
A proverbial wisdom often attributed to various famous people says: "He who makes no mistakes never makes anything." Unless you consider idleness itself a mistake, this statement is hard to argue with. But you can always analyze the past mistakes (your own and of others) to minimize the number of your future mistakes. We are going to attempt to review possible situations arising when executing jobs in the same-name service.

Patterns available when trading currency baskets. Part III
This is the final article devoted to the patterns that occur when trading currency pair baskets. It considers combined trend-following indicators and application of standard graphical constructions.

Graphical Interfaces V: The Combobox Control (Chapter 3)
In the first two chapters of the fifth part of the series, we developed classes for creating a scrollbar and a view list. In this chapter, we will speak about creating a class for the combobox control. This is also a compound control containing, among others, elements considered in the previous chapters of the fifth part.


Market Profile indicator
In this article, we will consider Market Profile indicator. We will find out what lies behind this name, try to understand its operation principles and have a look at its terminal version (MarketProfile).

Fundamentals of Statistics
Every trader works using certain statistical calculations, even if being a supporter of fundamental analysis. This article walks you through the fundamentals of statistics, its basic elements and shows the importance of statistics in decision making.


Risk and capital management using Expert Advisors
This article is about what you can not see in a backtest report, what you should expect using automated trading software, how to manage your money if you are using expert advisors, and how to cover a significant loss to remain in the trading activity when you are using automated procedures.