Multiple indicators on one chart (Part 01): Understanding the concepts

Introduction
Many traders feel more confident if they monitor multiple indicators at a time (for example, RSI, STOCASTIC, MACD, ADX and some others), or in some cases even at different assets which an index is made of. In the latter case, I refer to mini-indexes WIN and full indexes IND, but these may also include other index types. So, when trading WIN or IND, it may be interesting to observe some of the assets, such as VALE, PETROBRAS, ITAU, BRADESCO and others, which have greater weights in the index.
Doing this on one screen can be tricky: if you want to monitor assets, you can open multiple windows and place those assets accordingly, but if you want to change the timeframe, you have to do it in each window. With so many manual operations, there is a risk of making a mistake or forgetting something.
If you add multiple indicators displayed in indicator subwindows, things get completely messy. It will be hard to read the chart if you add three or more indicators, even on high-resolution screens. The entire information display will be totally messy on your screen.
But there is a solution (though not quite simple) that can be applied in the long term.
Concepts
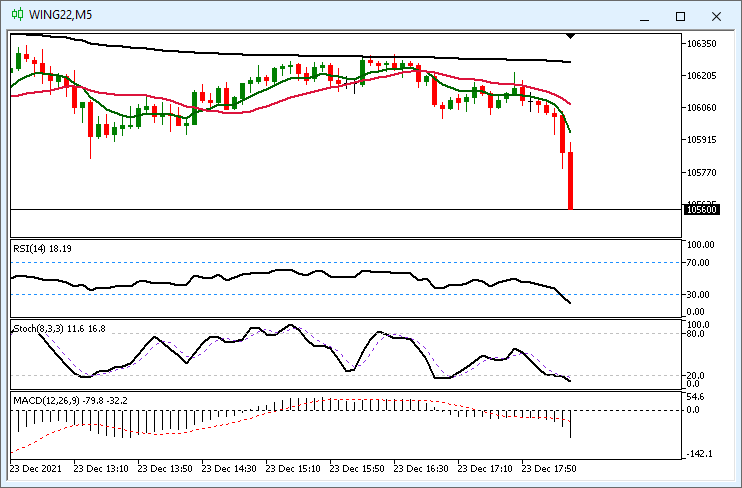
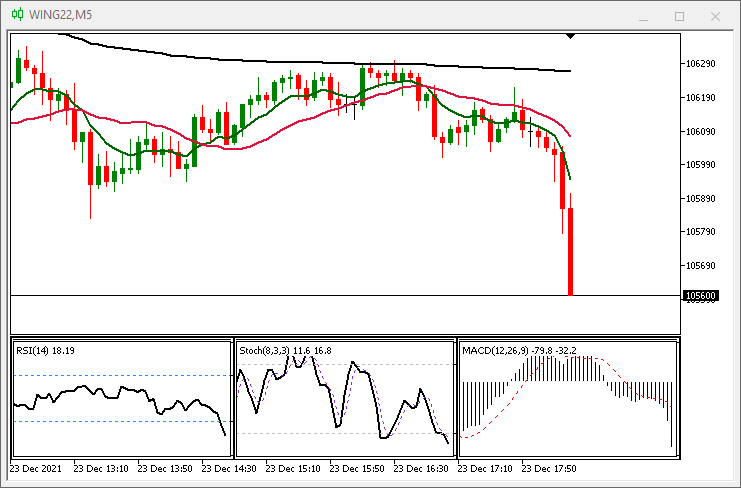
Let's say you like to trade a mini-index future with some RSI, STOCASTIC and MACD information on the screen. Something like this:
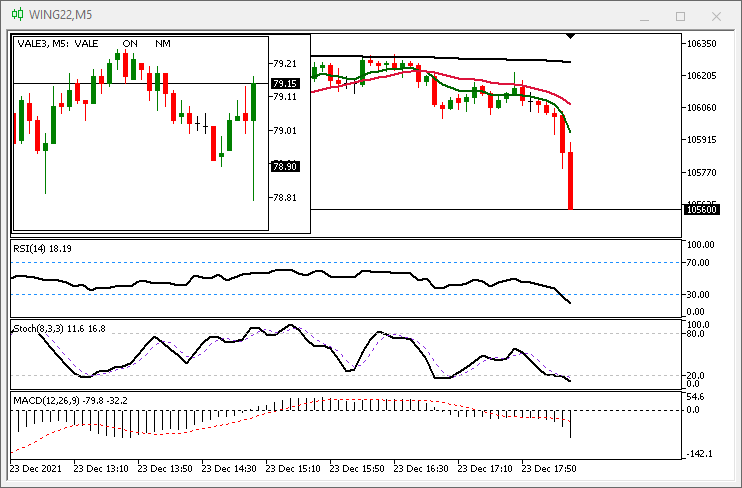
Please note that the chart area where you can place and manage orders has been greatly reduced. Let's now assume that in addition to this, you decide to also have the VALE3 chart nearby, but you don't want to open another window. A possible solution would be to put a chart object on the screen. But chart objects do not allow indicators to be placed inside them by default, nor are they linked to the timeframe of any asset they are part of. You anyway decide to open the VALE3 chart, and your screen now looks like the one shown in the figure below:
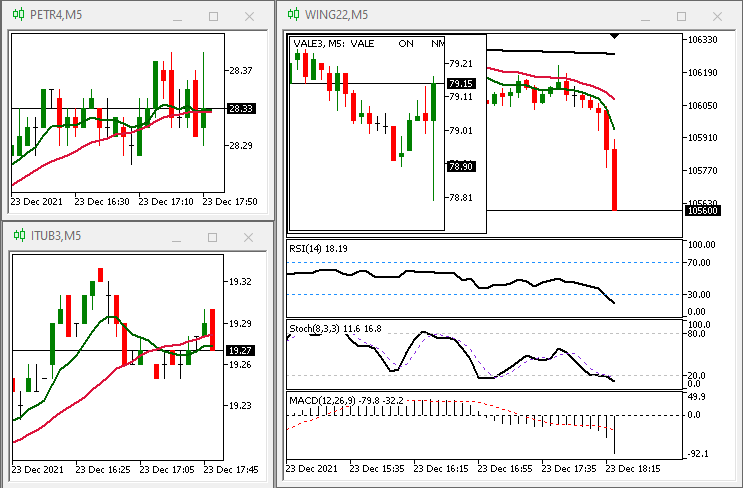
Now, imagine you want more information, for example charts PETROBRAS and ITAU, and additionally you need to launch some moving averages, at least the most common ones. But the screen is becoming overfilled with information. It becomes hard to read, especially if you are using one monitor. Using multiple monitors makes it a bit easier to see, but still there can be too much information. Furthermore, things are not interconnected in this case, and this makes working with this data very difficult. Pay attention that we do not even run indicators such as RSI or STOCASTIC on PETROBRAS and ITAU charts, as this would add up even more information, making it all even harder to read. A real nightmare on the screen.
There is a more elegant solution to avoid this clutter. In practice, when we are going to trade we do not look back. Normally, we only check a few previous values, so it is not so necessary to display very old values. What's really important is to ensure that the information we look at (including charts and values) is somehow interconnected. What about the variant shown below?
This still may look confusing at first, but all information is now linked to one chart. So, if you change the period you want to analyze, MetaTrader 5 will change all related data automatically, unless you instruct it that you want to keep certain data in a fixed period, in which case MetaTrader 5 will keep it as is. Since all data is interconnected, you can move this window, and the information will be moved with this window. The concept is quite simple: you instruct MetaTrader 5 what you want and how you want it and it will do the rest. Even on a FULL HD (1920 x 1080) monitor, which is considered small by today's standards, the window will not look cluttered at all, as each element will be about 300 pixels wide, that's for a case with 6 elements, as is shown above. But if the number of elements is less, for example when using only MACD, STOCASTIC and RSI, the result will be as is shown in the figure below:
Looks good, doesn't it? Now it is much more convenient to view and analyze as the information display is no longer chaotic. This data arrangement provides a good graphical space to place orders and manage them. Even those who work from a laptop will have readable and well organized data.
Planning
You're probably wondering how I did it and you're probably thinking that it's very difficult. Although it seems something incredible, everything is very simple and easily reproducible. Of course, there is much more that can be done. But for now I will focus on the basics, so that everyone can utilize this presentation form in MetaTrader 5. First, you need to understand how MetaTrader 5 TEMPLATES work. If you don't know, how to create and use them, you can follow the instructions below. Here is an example of what the system that I suggest to you can do:
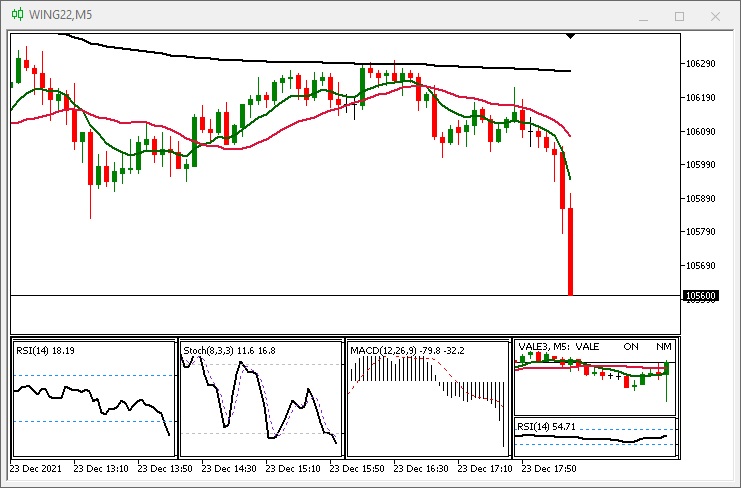
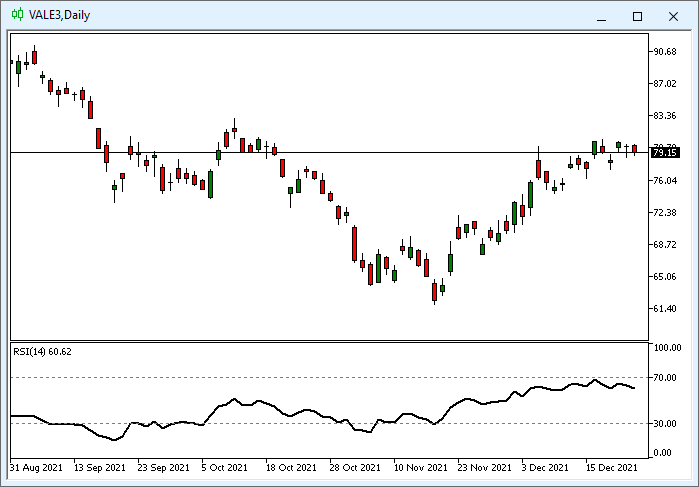
It is the chart of VALE3. There is an indicator inside the VALE3 subwindow, which would not be possible without knowing the basics of how it all works. TEMPLATES are configuration files, which allow implementing various things. But only when we come to really understanding them, brilliant ideas can appear. When we set up the chart launching indicators, applying color models, technical analysis lines etc., we can save all these settings to then "move" to another asset or to be able to use the same configuration later without having to set it all up anew.
Many users create several files of this type, with several indicators, to be able to perform quick analysis by simply changing the configuration, or rather by applying a ready template. This is very practical because it works like this: let's say we have a template that uses RSI and another one that uses Stochastic for the same asset. However, for practical reasons, due to MA settings, the RSI template can be very different from the Stochastic, and thus either its display does not allow the use of both indicators at the same time, or the amount of information makes it difficult to read. The best solution is to create two separate configuration files, one for RSI and one for Stochastic. Whenever necessary, simply load the desired file and MetaTrader 5 will apply all the necessary settings. That is the purpose of using these files: to make lives easier and more convenient. But now we will move to the next level. We've been using the files as explained above. Now we will move on further. If you are not familiar with the templates yet, I will explain how to create these files. This is basic but absolutely required information.
Planning 1.1 (Active Mode)
For beginners, here is information on how to create one of such configuration files. First of all, we open the desired symbol chart and run all required indicators on it. For the purposes of this article, we will not use indicators running in a separate subwindow, to keep the chart more or less similar to the one shown below:
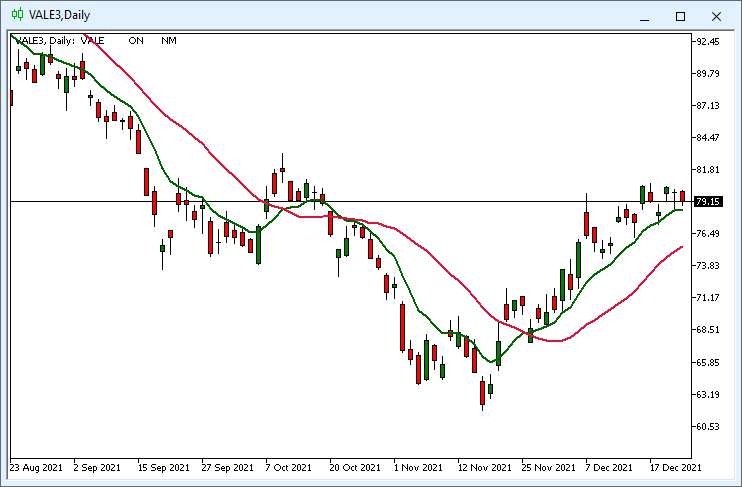
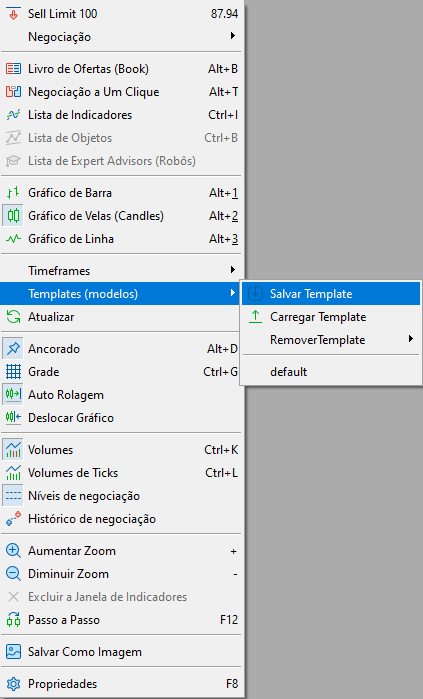
This should be clear. Then it is necessary to save the configuration in a file, as it is shown in the figures below. The configurations should be properly named — we will need this later. Now the question arises of how to name the file. I recommend using the same name as the symbol for which you are configuring it.

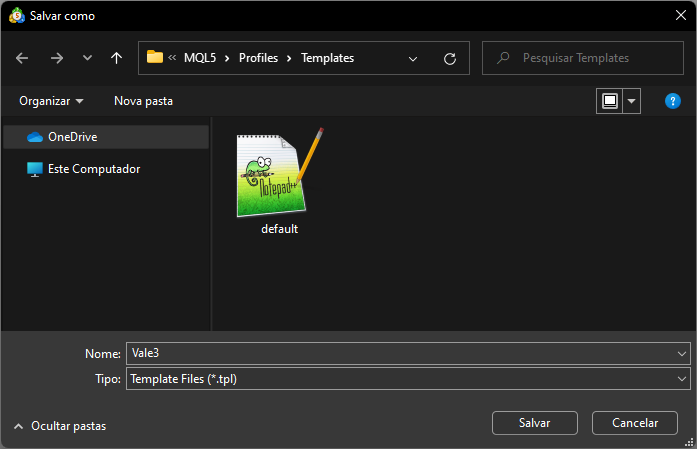
But what if I want to use another name, can I do it? Yes, and that's the trick: if all the symbols to be used within this system will utilize the same graphics configuration, you can simply duplicate the previously saved file and save it under a name corresponding to the relevant symbol. For example: you create Vale3.tpl, and if there are other symbols to use the same configuration, create a copy of Vale3.tpl and rename it, let's say save as Petr3.tpl, Itub3.tpl, Bbdc4.tpl etc. The templates will use the same settings. If you need to change anything, simply load the template, change the required settings and save the file. It's as simple as that. Another question arises: if all configuration files are the same, why can't I use the same template for all symbols without specifying the exact asset? It is also possible, but you should understand some of the template specifics to use the template in this way and to maintain it in the future. Anyway, it's easier to create different settings files even if the configurations are identical. I show this variant here because it is important to understand how to duplicate and change the default settings.
If everything is clear with this part, let's move on to the next one - the indicator mode. This part will require a little more work.
Planning 1.2 (Indicator Mode)
Now that we are familiar with the active mode, let's move on to the indicator mode. It differs from the one described above and it must be performed step by step and with the exact settings that will be used later. Let's take our time because the quality of the final result will depend on this work.
Suppose we want to use the RSI indicator in the system. So, simply add the RSI indicator and configure it exactly the way we want to use it in the future. This is very important, and unlike the active mode, here we will need to create each of the configuration files to achieve the exact desired result:

Having configured the indicator, save the file the same way we deed it in the active mode, but this time, instead of the asset name specify the indicator which was used. Do it for all indicators you want to use. If you want to add something extra to the indicator, such as for example with the traded volumes indicator, to which many users like to add a moving average, this should be done at this step, before saving the configuration file. If you try to do it later, it will not be possible. You will have to configure all the settings anew that's why I said 'take your time' before. The below figure shows this process:

Pay attention to the fact, that you don't need to worry about which symbol is receiving the indicator, as long as you do exactly as shown above. This may sound strange to beginners, but for MetaTrader 5, if the indicator is saved without showing the symbol, it is understood that the indicator set file must be used on the current symbol on the chart. This is shown in the figure above, where we applied VOLUME indicator on ITUB3, and then applied it on WING22 and obtained values corresponding to WING22.
ATTENTION:
If there is some part of the asset visible while saving the indicator template, the indicator settings will NOT be applied to the current symbol; instead, they will be applied to the symbol on which it was configured (as is shown in the figure below). That's why you should be very careful when saving the indicator settings.
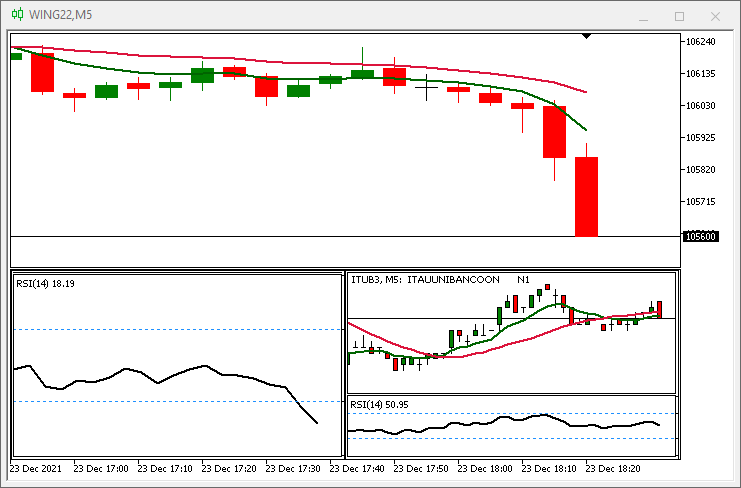
Pay attention to the RSI values in the figure above: the chart on the left shows the values of the main chart, which is WING22, while the values in the bottom right part show the values of ITUB3. I draw your attention to this because despite being extremely useful in several situations, this specific thing can harm those who are beginning to use the system. However, if properly used, it will provide you a great advantage in reading and analyzing various assets.
Planning 1.3 (User Interface)
After installing and saving all the files which we want to use, let's look at how to select and configure on-chart elements. Each indicator visualization method is indicated by the user through two commands shown in the screenshot below:
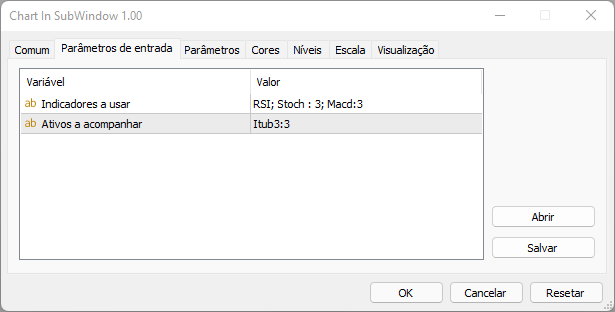
For practical reasons, I have separated indicators and assets. It is possible to put all of them in one line but I decided to separate them to make it easier to add things to the system. In other words, now it is clearer if we are adding an indicator or an asset, as we may have very similar names in some cases. However, the command syntax will not change: in both cases, the settings file will be separated by a semicolon ";". Command examples are shown in the following tables:
| Command | Result |
|---|---|
| RSI | Adds a configuration file named RSI |
| RSI;MACD | First, we add a settings file with the RSI name and then a file named MACD |
| RSI ; MACD | The same effect as in the previous (you can use spaces to make it easier to read) |
| MACD 3; IFR14 | First, we add a settings file named MACD 3 and then a file named IFR14 |
The above table shows how to use commands for indicators. The next table shows the same for assets. Adding assets to the indicator area or vice versa is considered a syntax error and will result in incorrect data representation, so be careful when adding and editing the commands.
| Command | Result |
|---|---|
| VALE3 | Adding a settings file named VALE3, the VALE3 assets will be opened and displayed in a chart subwindow. |
| VALE3 ; ITUB3 | Adding a file named VALE3, and then a file named ITUB3; both assets - VALE3 and ITUB3 - will be opened and displayed in their respective subwindows |
| VALE4 ; ITUB5 | This will note work as these two assets do not exist. Even if file exists, the asset data will be invalid as using the current asset's data is a logical error. |
Basically, that's all. The commands should be separated by a semicolon ";". Any name can be used for indicators, but for assets the file name must correspond to the asset name, and the asset itself must exist because if it does not exist or it is expired, invalid data will be generated. There is one more option allowing to configure the scale in the chart subwindow. It can be very useful when you want to analyze certain things in more detail. The default scale is set to 4, but it is possible to use values from 0 to 5, where 0 is the maximum data presentation density and 5 is the minimum density. These commands with data density settings will look as follows:
| Command | Result |
|---|---|
| RSI:2 | Adding a configuration file named RSI, data will be presented with a scale of 2 |
| RSI; MACD:1 | Adding RSI config file with a scale of 4 and a file with MACD settings with a scale of 1. |
| RSI : 2; MACD : 5 | Adding RSI config file with a scale of 2 and a file with MACD settings with a scale of 5. |
| VALE3:2 | Adds VALE3 settings file with a scale of 2 and displays the asset data in the relevant chart subwindow |
| VALE3:3; ITUB3:0 | Adds VALE3 settings with a scale of 3 and ITUB3 with a scale of 0; presets each asset data in the respective chart subwindows. |
So, you specify the name of the settings file used, followed by a colon ":" and a numeric value that indicates the scale. Using a value out of 0 to 5 range is considered a syntax error and the data may not be as expected.
Conclusion:
In this part, I introduced the idea (although I didn't go into details) of the internal code. Since the idea can be quite unexpected for many, I devoted a separate article to the system introduction. In the next article we will proceed to the code. For now, to pique your curiosity, here is the question: How is the system actually implemented?
Translated from Portuguese by MetaQuotes Ltd.
Original article: https://www.mql5.com/pt/articles/10229
Warning: All rights to these materials are reserved by MetaQuotes Ltd. Copying or reprinting of these materials in whole or in part is prohibited.
This article was written by a user of the site and reflects their personal views. MetaQuotes Ltd is not responsible for the accuracy of the information presented, nor for any consequences resulting from the use of the solutions, strategies or recommendations described.

 Learn how to design a trading system by MACD
 Data Science and Machine Learning (Part 02): Logistic Regression
 Learn how to design a trading system by CCI
- Free trading apps
- Over 8,000 signals for copying
- Economic news for exploring financial markets
You agree to website policy and terms of use
Eu não cheguei a conhecer o MT4, para dizer a verdade nem sei se ainda é possível utilizá-lo já que o MT5 domina pelo menos no que diz respeito a Bolsa Brasileira ( B3 ), então não sei como lhe responder de forma adequada ...
Planning 1.2 (Indicator Mode)
where indicators are horizontally arranged. Which window is called for settings further.
Which window is used to type commands?
Check it out here
https://www.mql5.com/en/articles/10230