Can Heiken-Ashi Combined With Moving Averages Provide Good Signals Together?

Introduction
Combinations of strategies may offer better opportunities. We can combine indicators together or patterns, or even better, indicators with patterns, so that we get an extra confirmation factor. In this article, we will see how to use Heiken-Ashi charting alongside moving averages as a trend confirmation technique. And then, at the end, we can look at optimization options.

The Heiken-Ashi Candlestick Method
Candlesticks are a quick way to understand OHLC data and detect patterns. It is very straightforward and easy to interpret. A bullish (typically green) candle occurs when the market closes above its opening price. A bearish (typically red) candle occurs when the market closes below its opening price. 

Let us see a full chart of candlesticks to better understand how it is shown. The trend is clearly bullish, with some corrections seen around the red candles. Notice the small candles where the opening price is almost the same as the closing price. This is called a Doji and signifies indecision and a possible reversal or consolidation.

The Heiken-Ashi (Also called Heikin-Ashi) candlesticks seek to clean out the picture and show a clearer trend by smoothing out the OHLC data. Here is how to calculate the Heiken-Ashi candlesticks:
(open + high + low + close) ÷ 4
Heikin-Ashi High=Max value of (High-0, Open-0, and Close-0)
Heikin-Ashi Low=Min value (Low-0, Open-0, and Close-0)
Heikin-Ashi is a Japanese trading indicator and financial chart that means "average pace". Heikin-Ashi charts resemble candlestick charts but have a smoother appearance as they track a range of price movements, rather than tracking every price movement as with candlesticks. Heikin-Ashi was created in the 1700s by Munehisa Homma, who also created the candlestick chart. These charts are used by traders and investors to help determine and predict price movements.
Like standard candlesticks, a Heikin-Ashi candle has a body and a wick, however, they do not have the same purpose as on a candlestick chart. The last price of a Heikin-Ashi candle is calculated by the average price of the current bar or timeframe (e.g., a daily timeframe would have each bar represent the price movements of that specific day). The formula for the last price of the Heikin-Ashi bar or candle is calculated by: (open + high + low + close) ÷ 4. The open of a Heikin-Ashi starts at the midpoint of the previous candle; it is calculated by: (the open of previous bar + the close of the previous bar) ÷ 2. The highest and lowest price points are represented by wicks similarly to candlesticks.
The above formulas will smooth out the candles to give us a more defined and clear trend. ")
")
The two charts are a comparison between a regular candlestick chart and a Heiken-Ashi chart. We can see the resemblance, but we can also see that the first one is smoother. We should note, however, that since the Heiken-Ashi method is simply an average, the price shown may not be the true market price.
The Concept of Moving Averages
Moving averages help us confirm and ride the trend. They are the most known technical indicators and this is because of their simplicity and their proven track record of adding value to analyses. We can use them to find support and resistance levels, stops and targets, and the underlying trend. This versatility makes them an indispensable tool in our trading arsenal.
In statistics, a moving average (rolling average or running average) is a calculation to analyze data points by creating a series of averages of different selections of the full data set. It is also called a moving mean (MM) or rolling mean and is a type of finite impulse response filter. Variations include: simple, cumulative, or weighted forms (described below).
A moving average filter is sometimes called a boxcar filter, especially when followed by decimation.
Given a series of numbers and a fixed subset size, the first element of the moving average is obtained by taking the average of the initial fixed subset of the number series. Then the subset is modified by "shifting forward"; that is, excluding the first number of the series and including the next value in the subset.
A moving average is commonly used with time series data to smooth out short-term fluctuations and highlight longer-term trends or cycles. The threshold between short-term and long-term depends on the application, and the parameters of the moving average will be set accordingly. It is also used in economics to examine gross domestic product, employment, or other macroeconomic time series. Mathematically, a moving average is a type of convolution, so it can be viewed as an example of a low-pass filter used in signal processing. When used with non-time series data, a moving average filters higher frequency components without any specific connection to time, although typically some kind of ordering is implied. Viewed simplistically, it can be regarded as smoothing the data.

As the name suggests, this is your plain, simple mean that is used everywhere in statistics and basically any other part of our lives. It is simply the total values of the observations divided by the number of observations. Mathematically speaking, it can be written down as:

We can see that the moving average is providing decent dynamic support and resistance levels from which we can place our orders in case the market goes down.
Plan

As with any proper research method, the aim is to test the strategy and be able to see for ourselves whether it is worth having as an add-on to our pre-existing trading framework or not.
The first step is creating the trading rules. When will the system buy, and when will it go short? In other words, when is the signal given that tells the system that the current market will go up or down?
The trading conditions we can choose from are:
- Go long (Buy) whenever the Heikin-Ashi chart is bullish while the market crosses above its 100-period moving average.
- Go short (Sell) whenever the Heikin-Ashi chart is bearish while the market crosses below its 100-period moving average.
We have to keep in mind the frequency of the signals when we are developing a trading algorithm. The signal function used to generate the triggers based on the conditions mentioned.
Results
These are results for the EURUSD symbol from January 1st 2022 to 5 of July 2023 for a 30 minutes time period. Better results should arrive with optimization and other time periods. To use it with all symbols, optimization and testing should be done.


Code
int OnInit()
  {
//---
   handle_iCustomMA=iCustom(_Symbol,my_timeframe,"\\folder/s where you have the indicator\\sma",MAPeriod,MAShift);
   handle_iCustomHeiken=iCustom(_Symbol,my_timeframe_Heiken,"\\folder/s where you have the indicator\\Heiken_Ashi_copy");
//---
   if(handle_iCustomMA==INVALID_HANDLE)
     {
      //--- tell about the failure and output the error code
      PrintFormat("Failed to create handle of the iCustom indicator for the symbol %s/%s, error code %d",
                  _Symbol,
                  EnumToString(my_timeframe),
                  GetLastError());
      //--- the indicator is stopped early
      return(INIT_FAILED);
     }
   if(handle_iCustomHeiken==INVALID_HANDLE)
     {
      //--- tell about the failure and output the error code
      PrintFormat("Failed to create handle of the iCustom indicator for the symbol %s/%s, error code %d",
                  _Symbol,
                  EnumToString(my_timeframe_Heiken),
                  GetLastError());
      //--- the indicator is stopped early
      return(INIT_FAILED);
     }
   return(INIT_SUCCEEDED);
  }
This code is used to initialize two custom indicators in the MQL5 language. The first indicator is a Simple Moving Average (SMA) with the parameters MAPeriod and MAShift. The second indicator is a Heiken Ashi copy. The code creates handles for each indicator and checks for errors. If an error is found, the code prints the error code and returns an INIT_FAILED value. If no errors are found, the code returns an INIT_SUCCEEDED value.
void OnTick()
  {
   double heikenAshiOpen[], heikenAshiHigh[], heikenAshiLow[], heikenAshiClose[];
   CopyBuffer(handle_iCustomHeiken,0,0,2,heikenAshiOpen);
   CopyBuffer(handle_iCustomHeiken,1,0,2,heikenAshiHigh);
   CopyBuffer(handle_iCustomHeiken,2,0,2,heikenAshiLow);
   CopyBuffer(handle_iCustomHeiken,3,0,2,heikenAshiClose);
   Comment("heikenAshiOpen ",DoubleToString(heikenAshiOpen[0],_Digits),
           "\n heikenAshiHigh ",DoubleToString(heikenAshiHigh[0],_Digits),
           "\n heikenAshiLow ",DoubleToString(heikenAshiLow[0],_Digits),
           "\n heikenAshiClose ",DoubleToString(heikenAshiClose[0],_Digits));
//---
   MqlTick tick;
   double last_price = tick.ask;
   SymbolInfoTick(_Symbol,tick);
   int total = PositionsTotal();
//---
// Retrieve the current value
   MqlTradeResult  result;
   MqlRates rates[];
//---
   double array_ma[];
   ArraySetAsSeries(array_ma,true);
   int start_pos2=0,count2=5;
   if(!iGetArray2(handle_iCustomMA,0,start_pos2,count2,array_ma))
      return;
//------------------------------------------------------------------------------
     {
      if(DoubleToString(heikenAshiClose[0],_Digits) < DoubleToString(heikenAshiOpen[0],_Digits) && (DoubleToString(heikenAshiClose[1],_Digits) > DoubleToString(heikenAshiOpen[1],_Digits)))
        {
         Print("Open Order Buy");
         Alert(" Buying");
         Orden="Buy";
         sl=NormalizeDouble(tick.ask - ptsl*_Point,_Digits);
         tp=NormalizeDouble(tick.bid + pttp*_Point,_Digits);
         trade.PositionOpen(_Symbol,ORDER_TYPE_BUY,get_lot(tick.bid),tick.bid,sl,tp,"Buy");
         return;
        }
     }
     {
      if(DoubleToString(heikenAshiClose[0],_Digits) > DoubleToString(heikenAshiOpen[0],_Digits) && (DoubleToString(heikenAshiClose[1],_Digits) < DoubleToString(heikenAshiOpen[1],_Digits)))
        {
         Print("Open Order Sell");
         Alert(" Selling");
         Orden="Sell";
         sl=NormalizeDouble(tick.bid + ptsl*_Point,_Digits);
         tp=NormalizeDouble(tick.ask - pttp*_Point,_Digits);
         trade.PositionOpen(_Symbol,ORDER_TYPE_SELL,get_lot(tick.ask),tick.ask,sl,tp,"Sell");
         return;
        }
     }
   if(total>0)
     {
      if(Orden=="Sell" &&(DoubleToString(heikenAshiClose[0],_Digits) < DoubleToString(heikenAshiOpen[0],_Digits) ))
        {
         trade.PositionClose(_Symbol,5);
         Print("cerró sell");
         return;
        }
      if(Orden=="Buy" &&(DoubleToString(heikenAshiClose[0],_Digits) > DoubleToString(heikenAshiOpen[0],_Digits) ))
        {
         trade.PositionClose(_Symbol,5);
         Print("cerró buy");
         return;
        }
     }
  }
This piece of code is an MQL5 script that is used to open and close positions in the forex market. It starts by declaring four double arrays (heikenAshiOpen, heikenAshiHigh, heikenAshiLow, and heikenAshiClose) and copying the values from the custom indicator "iCustomHeiken". It then retrieves the current tick data from the symbol and declares the MqlTradeResult and MqlRates arrays. It then declares an array for the moving average (array_ma) and sets the array as a series. It then retrieves the values from the custom indicator "iCustomMA" and stores them in the array_ma array. Finally, it checks if the current Heiken-Ashi close is lower than the open and the previous Heiken-Ashi close is higher than the open, and if so, it opens a buy order with the specified stop loss and take profit. It also checks if the current Heiken-Ashi close is higher than the open and the previous Heiken-Ashi close is lower than the open, and if so, it opens a sell order with the specified stop loss and take profit. If there are any open positions, it checks if the Heiken-Ashi close is lower than the open for a sell order and higher than the open for a buy order, and if so, it closes the position.
Just to clarify, the second int of the CopyBuffer are the value from where to start counting, and the second is the value of the number of counts. I have used two, instead of one, to take into account the 1-n (in this case, the immediately preceding Heiken Ashi candlestick). This has been used in the strat to see the color change in an if condition, to open or not open the order.
The two if conditions to open or close orders is what you should look to modify in the code, you could, for example, use more candles with the same color before opening the order, or skip to the second candle of a different color to close the orders.
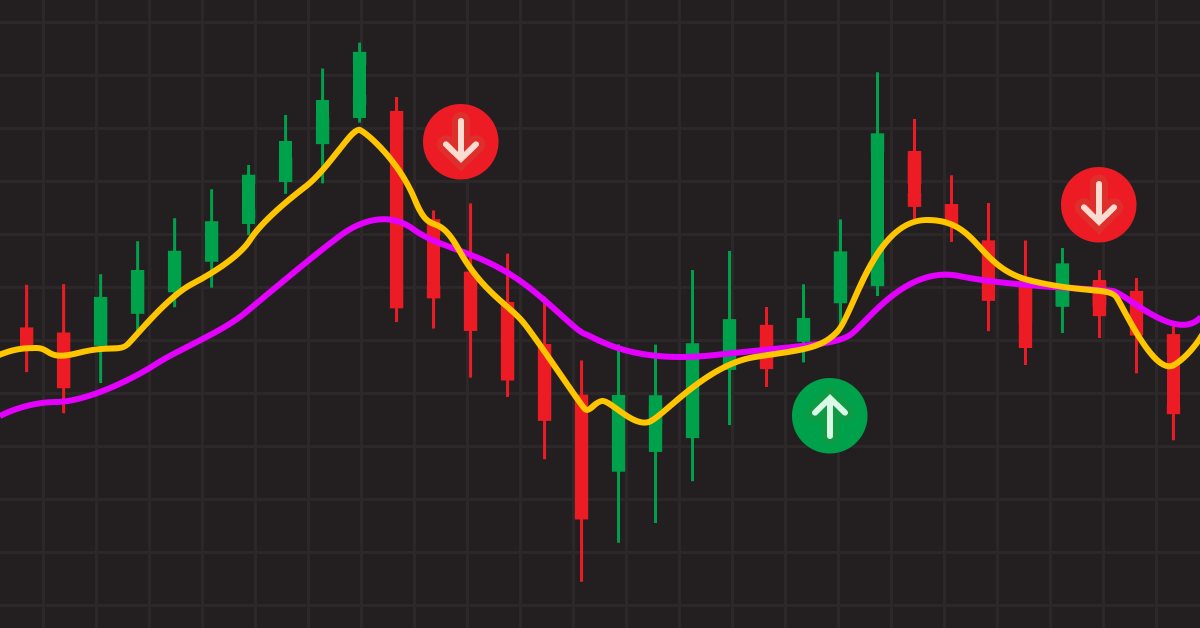
To close orders, another good solution, would be another SMA with a different period, and use the cross signals to close orders. Like in the example of the image:

//+------------------------------------------------------------------+
double get_lot(double price)
  {
   if(inp_lot_type==LOT_TYPE_FIX)
      return(normalize_lot(inp_lot_fix));
   double one_lot_margin;
   if(!OrderCalcMargin(ORDER_TYPE_BUY,_Symbol,1.0,price,one_lot_margin))
      return(inp_lot_fix);
   return(normalize_lot((AccountInfoDouble(ACCOUNT_BALANCE)*(inp_lot_risk/100))/ one_lot_margin));
  }
double normalize_lot(double lt)
  {
   double lot_step = SymbolInfoDouble(_Symbol,SYMBOL_VOLUME_STEP);
   lt = MathFloor(lt / lot_step) * lot_step;
   double lot_minimum = SymbolInfoDouble(_Symbol,SYMBOL_VOLUME_MIN);
   lt = MathMax(lt, lot_minimum);
   return(lt);
  }
bool iGetArray2(const int handle2,const int buffer2,const int start_pos2,
                const int count2,double &arr_buffer2[])
  {
   bool result2=true;
   if(!ArrayIsDynamic(arr_buffer2))
     {
      //if(InpPrintLog)
      PrintFormat("ERROR! EA: %s, FUNCTION: %s, this a no dynamic array!",__FILE__,__FUNCTION__);
      return(false);
     }
   ArrayFree(arr_buffer2);
//--- reset error code
   ResetLastError();
//--- fill a part of the iBands array with values from the indicator buffer
   int copied2=CopyBuffer(handle2,buffer2,start_pos2,count2,arr_buffer2);
   if(copied2!=count2)
     {
      //--- if the copying fails, tell the error code
      //if(InpPrintLog)
      PrintFormat("ERROR! EA: %s, FUNCTION: %s, amount to copy: %d, copied: %d, error code %d",
                  __FILE__,__FUNCTION__,count2,copied2,GetLastError());
      //--- quit with zero result - it means that the indicator is considered as not calculated
      return(false);
     }
   return(result2);
  }
This code is a function in MQL5 that calculates the lot size for a trade. The function takes in a double variable called price and uses it to calculate the lot size.
The function first checks if the lot type is fixed, and if so, returns the normalized lot size. If not, it calculates the margin for one lot and then calculates the lot size based on the account balance and the risk percentage. It then returns the normalized lot size.
The normalize_lot function is then used to round the lot size to the nearest step size and to ensure that the lot size is not less than the minimum lot size.
The iGetArray2 function is then used to copy values from the indicator buffer and check for any errors. If an error is found, the function returns false.
Conclusion
We've seen how you can use the Heiken Ashi with another indicator.
Obviously, a lot of optimization can be done here to regulate the frequency of signals and improve their quality:
- We can choose a condition relating to the Heikin-Ashi chart where we trigger the signal after consecutive candles.
- We can tweak the moving average lookback period. We can also add other moving averages and switch the strategy to a moving average cross rather than a simple cross between the market price and a single moving average.
- We can include candlestick charts in the Heikin-Ashi and combine with moving averages.
- We can also include the distance of the Heikin-Ashi close to the moving average as a measure of risk or even as a contrarian trigger.
- We can use the candle’s body width as a measure of the trend’s strength. We can also include the moving average’s steepness into the formula.
We have learned how to implement this strategy, and we also learned how to implement custom indicators. We have learned now to use fixed lot or a lot with a percentage of risk. We have learned how to open and close orders, and how to use conditions for the orders. We've used copybuffer for the Heiken Ashi indicator and the MA indicator. We have run a profitable test and shown results. We have learned how to add points for StopLoss and TakeProfit and normalize with the number of digits of the symbol. We have used the symbol volume step and symbol volume min to normalize lots.
I hope you liked this article.
Warning: All rights to these materials are reserved by MetaQuotes Ltd. Copying or reprinting of these materials in whole or in part is prohibited.
This article was written by a user of the site and reflects their personal views. MetaQuotes Ltd is not responsible for the accuracy of the information presented, nor for any consequences resulting from the use of the solutions, strategies or recommendations described.

- Free trading apps
- Over 8,000 signals for copying
- Economic news for exploring financial markets
You agree to website policy and terms of use
Sorry...
How can I attach to xauusd chart
Help
eurusd 15 min