
Using the CCanvas class in MQL applications
The article delves into the CCanvas class and its use in MQL applications. The theory is accompanied by examples.
Graphics in applications
Handling graphics in applications requires access to pixel data on a screen. If you have such an access, you are able to change pixel colors, create various UI elements, input fields, buttons, panels, windows and other elements or display images from files, as well as get and handle pixel data. Generally, this mechanism is arranged in the class having the word 'Canvas' in its name. In C-based programming languages, this is usually CCanvas or Canvas, depending on the code-writing style. Thus, every app needs a canvas in order to get access to graphics.
Canvas in MQL applications
In MQL, the tool is provided in the form of the CCanvas class containing the array of pixels, the methods for modifying the pixel array and the mechanism of sending the array to a terminal chart. OBJ_BITMAP or OBJ_BITMAP_LABEL graphical object is used as a means of display. The applied graphical object takes data from the graphical resource, which, in turn, receives data from the pixel array.
The CCanvas class allows the implementation of all desktop UI features. In addition to user interfaces, CCanvas enables drawing indicator buffers, OHLC bars and much more. The possibilities are endless... I will consider this topic in my other articles. Now it is time to get back to the CCanvas class.
Delving into CCanvas
Now it is time for the most interesting part - delving into the CCanvas class. Understanding its structure will allow you to master this tool. The structure of CCanvas is provided below.

As we can see, the class is divided into two large sections - data and methods.
Let's consider the data:
- Pixel data. The m_pixels pixel array storing pixels, handled by drawing methods, as well as m_width and m_height data – image width and height respectively. The m_width and m_height parameters are very important for handling the m_pixels array by the drawing methods, as well as for passing the m_pixels array to the graphical resource in the Update method.
- Font data for displaying the text. Consists of m_fontname, m_fontsize, m_fontflags and m_fontangle fields – font name, size, attributes and text slope angle respectively. The data is necessary for setting and receiving the font properties (using the methods for reading/writing the font properties) before calling the TextOut method.
- Line drawing data. Consists of two fields: m_style - line style and m_style_idx - the current bit index in the line style template. They are necessary for the drawing methods.
- Default data. Here we have a single field m_default_colors - default color array. It is not used in the CCanvas class methods themselves, but it may be useful for other functions or methods of CCanvas descendant classes as a color palette.
- Chart interaction data. Contains the following: m_chart_id, m_objname, m_objtype, m_rcname and m_format - chart object ID, chart object name, chart object type, graphical resource name and pixel format respectively. The data is meant for the following methods: Destroy, Update, Resize. In particular, the m_format field is needed for the TextOut method operation.
Let's consider the methods:
- Creation/attachment/removal methods. The category features different methods working with a chart object. These are the methods of creating a graphical object: CreateBitmap and CreateBitmapLabel. They are meant for creating a chart object and a graphical resource related to it, which, in turn, displays an image on the chart. Attachment methods: Attach. If the chart features the OBJ_BITMAP_LABEL graphical object with an attached graphical resource or without it, CCanvas handles it the same way as it handles a newly created graphical object. Simply attach it using the appropriate Attach method. Removal method is called Destroy. It removes a graphical object, releases the m_pixels pixel array buffer and removes the graphical resource related to the chart object. Therefore, we should always call the Destroy method upon CCanvas completion because the class does not remove its chart object and the graphical resource automatically.
- Methods of uploading images from a file. The LoadBitmap static method capable of uploading an image from the *.bmp file to any uint array passed to it at an address as a parameter, while saving the size of the obtained image to the 'width' and 'height' variables that are also passed to the method at appropriate addresses as its parameters. The LoadFromFile method uploads an image from the *.bmp file to the m_pixels array setting the m_width and m_height image parameters. The m_format pixel format should be equal to COLOR_FORMAT_ARGB_RAW.
- Methods of reading chart object properties consist of ChartObjectName, ResourceName, Width and Height, and return the chart object name, the graphical resource name, the image width and height accordingly. These methods allow users to read only some data for interacting with the chart, including m_objname, m_rcname, as well as m_width and m_height image data.
- Methods of reading/writing font properties of a displayed text. First, let's consider the FontNameSet, FontSizeSet, FontFlagsSet and FontAngleSet writing methods. These methods set the font name, size, attributes and the slope angle of the displayed text respectively. Now let's consider the reading methods: FontSizeGet, FontFlagsGet and FontAngleGet. The methods return the font size and attributes, as well as the displayed text slope angle respectively. There are also the methods for receiving/setting the font properties, which return/set all font properties at once. The method for setting the properties FontSet sets the font name, size, attributes and the slope angle of the displayed text respectively. The method for receiving the properties FontGet returns the font name, size, attributes and the slope angle of the displayed text respectively.
- Methods for reading/writing the line drawing style. The LineStyleGet method is used for reading, while LineStyleSet is applied for writing. The line style is necessary for handling the drawing methods of LineAA, PolylineAA, PolygonAA, TriangleAA, CircleAA, EllipseAA, LineWu, PolylineWu, PolygonWu, TriangleWu, CircleWu, EllipseWu, LineThickVertical, LineThickHorizontal, LineThick, PolylineThick and PolygonThick graphical primitives.
- Methods of drawing in the pixel array. The CCanvas class has numerous methods of drawing graphical primitives using various algorithms enabling users to create complex graphics applying progressive smoothing methods, including antialiasing, Wu’s algorithm and Bézier curves. Let's consider these methods. Simple primitives without smoothing: LineVertical, LineHorizontal, Line, Polyline, Polygon, Rectangle, Triangle, Circle, Ellipse, Arc and Pie. The methods draw the following primitives: vertical line, horizontal line, freehand line, polyline, polygon, rectangle, triangle, circle, ellipse, arc and filled ellipse sector respectively. Filled primitives: FillRectangle, FillTriangle, FillPolygon, FillCircle, FillEllipse and Fill. These methods draw rectangle, triangle, polygon, circle, ellipse and filling in the area respectively. The methods of drawing primitives with smoothing via antialiasing (AA): PixelSetAA, LineAA, PolylineAA, PolygonAA, TriangleAA, CircleAA and EllipseAA. The methods fill in pixels and display such primitives as a freehand line, polyline, polygon, triangle, circle and ellipse respectively. Methods of drawing primitives using Wu's algorithm: LineWu, PolylineWu, PolygonWu, TriangleWu, CircleWu and EllipseWu. The methods draw a freehand line, polyline, polygon, triangle, circle and ellipse respectively. The methods of drawing primitives with preliminarily sorted antialiasing and adjustable line width: LineThickVertical, LineThickHorizontal, LineThick, PolylineThick and PolygonThick. They are meant for drawing the following primitives: vertical line, horizontal line, freehand line, polyline and polygon respectively. The methods of drawing smoothed primitives using Bézier methods: PolylineSmooth and PolygonSmooth. The methods draw such primitives as smoothed line and smoothed polygon respectively. Apart from the methods described above, the category also includes the method for displaying a text TextOut since it also changes the color values in the pixel array, although it falls into the group of text handling methods in the initial CCanvas class code.
- Methods of passing the image for displaying on the chart. The category includes two methods. The Update method passes the m_pixels pixel array to the graphical resource related to a chart object displaying an image. As I have already mentioned, the m_pixels pixel array changes with the help of the above mentioned drawing methods in the pixel array. The Resize method changes the m_pixels array size (image size) and passes it to the graphical resource as well.
- Services. CCanvas features two service methods: GetDefaultColor returns redefined colors, while TransparentLevelSet changes the image transparency by changing the alpha channel values in the m_pixels array.
- Other settings. Here we have a single FilterFunction method for setting the antialiasing filter, which sets the filter for all drawing methods having AA symbols in their names.
The CCanvas class has fields and methods in the 'private' visibility area. I am not going to consider them in the article since they are internal ones and cannot be used in redefined methods of CCanvas descendant classes. You can find them in Canvas.mqh module source code in MetaEditor.
Sequence of actions applied when using CCanvas in MQL applications
Considering all mentioned above, it is now possible to highlight a common sequence of actions for handling the CCanvas class when using it in any MQL applications. Let's consider the actions to be performed to let an image appear on a chart.
- Create or attach a chart object (OBJ_BITMAP or OBJ_BITMAP_LABEL) or attach to the already existing OBJ_BITMAP_LABEL
- Set font parameters and primitive drawing styles
- Perform drawing in the m_pixels array using the appropriate methods
- Update the graphical object resource (OBJ_BITMAP or OBJ_BITMAP_LABEL)
As a result, the chart will have an object with graphical constructions or a text. Let's consider the actions in detail.
Creating a chart object and attaching to an already existing chart object
To let an MQL application display graphics on a chart, we need to create an object based on CCanvas class or its descendant. After creating a CCanvas object, we can start the development of the OBJ_BITMAP or OBJ_BITMAP_LABEL chart object. Alternatively, we can attach the already existing OBJ_BITMAP_LABEL to the created CCanvas object.
In order to create a graphical object, CCanvas has CreateBitmap and CreateBitmapLabel methods. Each of them applies its own overload option for more convenient use.
bool  CreateBitmap(const long chart_id, const int subwin, const string name, const datetime time, const double price, const int width, const int height, ENUM_COLOR_FORMAT clrfmt=COLOR_FORMAT_XRGB_NOALPHA);

bool  CreateBitmap(const string name, const datetime time, const double price, const int width, const int height,ENUM_COLOR_FORMAT clrfmt=COLOR_FORMAT_XRGB_NOALPHA);

bool  CreateBitmapLabel(const long chart_id, const int subwin, const string name, const int x, const int y, const int width, const int height, ENUM_COLOR_FORMAT clrfmt=COLOR_FORMAT_XRGB_NOALPHA);

bool  CreateBitmapLabel(const string name,const int x,const int y, const int width,const int height,ENUM_COLOR_FORMAT clrfmt=COLOR_FORMAT_XRGB_NOALPHA);
The CreateBitmap method creates a bitmap (OBJ_BITMAP object type), whose coordinates are set as a time and price on a trading symbol chart, and contains the following parameters:
- chart_id – chart ID (0 – current)
- window – chart subwindow index (0 – main window)
- name – name of a created graphical object on a chart
- time – time coordinate of a graphical object on a chart
- price – price coordinate of a graphical object on a chart
- width – graphical object width on a chart
- height – graphical object height on a chart
Another CreateBitmap method option is an overloaded method, which calls CreateBitmap with chart_id and window equal to 0 (which corresponds to the current chart and main window).
//+------------------------------------------------------------------+
//| Create object on chart with attached dynamic resource            |
//+------------------------------------------------------------------+
bool CCanvas::CreateBitmap(const string name,const datetime time,const double price,
                           const int width,const int height,ENUM_COLOR_FORMAT clrfmt)
  {
   return(CreateBitmap(0,0,name,time,price,width,height,clrfmt));
  }
The CreateBitmapLabel method has the same parameters as CreateBitmap excluding 'time' and 'price'. We can see x and y instead of them.
Inputs:
- chart_id – chart ID (0 – current)
- window – chart subwindow index (0 – main window)
- name – name of a created graphical object on a chart
- x – X coordinate of a graphical object on a chart
- y – Y coordinate of a graphical object on a chart
- width – width of a created graphical object image
- height – height of a created graphical object image
- clrfmt – pixel color format of a created graphical object image
Another CreateBitmapLabel method option is an overloaded method, which calls CreateBitmapLabel with chart_id and window equal to 0 (same as CreateBitmap).
//+------------------------------------------------------------------+
//| Create object on chart with attached dynamic resource            |
//+------------------------------------------------------------------+
bool CCanvas::CreateBitmapLabel(const string name,const int x,const int y,
                                const int width,const int height,ENUM_COLOR_FORMAT clrfmt)
  {
   return(CreateBitmapLabel(0,0,name,x,y,width,height,clrfmt));
  }
If the chart has the OBJ_BITMAP_LABEL object, it can be attached to CCanvas using the Attach method. As a result, the chart object will interact with the CCanvas object the same way as with the chart object created using the CreateBitmap or CreateBitmapLabel method.
virtual bool  Attach(const long chart_id,const string objname,const int width,const int height,ENUM_COLOR_FORMAT clrfmt=COLOR_FORMAT_XRGB_NOALPHA);

virtual bool  Attach(const long chart_id,const string objname,ENUM_COLOR_FORMAT clrfmt=COLOR_FORMAT_XRGB_NOALPHA);
The method attaches CCanvas to the already existing OBJ_BITMAP_LABEL chart object.
Inputs:
- chart_id – chart ID (0 – current)
- objname – name of an attached graphical object
- width – width of an attached graphical object image
- height – height of an attached graphical object image
- clrfmt – pixel color format of an attached graphical object image
The first option of the Attach method implies that a chart object has no graphical resource and creates it on its own using the objname, width, height and clrfmt parameters, as well as filling in all data necessary for further handling of the attached graphical object.
The second option implies the existence of a graphical resource and simply reads image pixel data to the m_pixels array also filling all the data necessary for further handling of the attached graphical object.
Methods for setting and receiving font parameters, as well as methods for setting and receiving a line drawing style
After the graphical object has been created using the CreateBitmap or CreateBitmapLabel method, or attached using the Attach method, we should set the font parameters and primitive drawing style to get the necessary image. The font parameters are set using the following methods.
Simple methods for setting the font properties:
bool FontNameSet(string name);  // Set the font name

bool FontSizeSet(int size);     // Set the font size

bool FontFlagsSet(uint flags);  // Set the font attributes

bool FontAngleSet(uint angle);  // Set the font slope angle
Simple methods for reading the font properties:
string FontNameGet(void) const;   // Return the font name

int    FontSizeGet(void) const;   // Return the font size

uint   FontFlagsGet(void) const;  // Return the font attributes

uint   FontAngleGet(void) const;  // Return the font slope angle
Method for setting all font properties
bool FontSet(const string name,const int size,const uint flags=0,const uint angle=0); // Set the font properties
Inputs:
- name - font name
- size - font size
- flags - font attributes
- angle - font slope angle
As we can see in the listing, the method sets the font name, size, attributes and text slope angle according to name, size, flags and angle variable values passed as parameters.
Method of receiving all font properties
void FontGet(string &name,int &size,uint &flags,uint &angle); // Get font properties
Inputs:
- name - font name
- size - font size
- flags - font attributes
- angle - font slope angle
As we can see in the listing, the method writes the font name, size, attributes and text slope angle to the appropriate name, size, flags and angle variables passed to it as parameters at certain addresses.
Methods of reading and writing a graphical construction line style:
uint LineStyleGet(void) const;       // Return the specified line drawing style

void LineStyleSet(const uint style); // Set the line drawing style
Inputs:
- style - line drawing style
Methods of drawing and displaying a text
Let's start from the text display method since it is only one of its kind, while the graphical primitive drawing methods are numerous in CCanvas.
Text display
void TextOut(int x,int y,string text,const uint clr,uint alignment=0); // Display text to the m_pixels array
Inputs:
- x - X coordinate of a displayed text
- y - Y coordinate of a displayed text
- text - displayed text
- clr - displayed text color
- alignment - anchoring method of a displayed text
According to the listing, the method displays text at x and y coordinates with the specified clr color and alignment text anchoring method.
Changing pixels
In CCanvas, pixels located in the m_pixels array can be changed or their values can be received according to the specified coordinates.
uint PixelGet(const int x,const int y) const;          // Return the pixel color value according to x and y coordinates

void PixelSet(const int x,const int y,const uint clr); // Change the pixel color value according to x and y coordinates
Inputs:
- x - pixel X coordinate
- y - pixel Y coordinate
- clr - pixel color
Drawing graphical primitives
Since CCanvas features numerous methods for drawing primitives, I will consider only the most important ones in this article. You can find all other methods in the documentation.
Vertical line
void LineVertical(int x,int y1,int y2,const uint clr); // Draw a vertical line according to specified coordinates and color
Inputs:
- x - line X coordinate
- y1 - first point Y coordinate
- y2 - second point Y coordinate
- clr - line color
Horizontal line
void LineHorizontal(int x1,int x2,int y,const uint clr); // Draw a horizontal line according to specified coordinates and color
Inputs:
- x1 - first point X coordinate
- x2 - second point X coordinate
- y - line Y coordinate
- clr - line color
Freehand line
void Line(int x1,int y1,int x2,int y2,const uint clr); // Draw a freehand line according to specified coordinates and color
Inputs:
- x1 - first point X coordinate
- y1 - first point Y coordinate
- x2 - second point X coordinate
- y2 - second point Y coordinate
- clr - line color
Polyline
void Polyline(int &x[],int &y[],const uint clr); // Draw a polyline according to specified coordinates and color
Inputs:
- x - point X coordinate array
- y - point Y coordinate array
- clr - polyline color
Polygon
void Polygon(int &x[],int &y[],const uint clr); // Draw a polygon according to specified coordinates and color
Inputs:
- x - point X coordinate array
- y - point Y coordinate array
- clr - polygon color
Rectangle
void Rectangle(int x1,int y1,int x2,int y2,const uint clr); // Draw a rectangle according to specified coordinates and color
Inputs:
- x1 - first point X coordinate
- y1 - first point Y coordinate
- x2 - second point X coordinate
- y2 - second point Y coordinate
- clr - rectangle color
Triangle
void Triangle(int x1,int y1,int x2,int y2,int x3,int y3,const uint clr); // Draw a triangle according to specified coordinates and color
Inputs:
- x1 - first point X coordinate
- y1 - first point Y coordinate
- x2 - second point X coordinate
- y2 - second point Y coordinate
- x3 - third point X coordinate
- y3 - third point Y coordinate
- clr - triangle color
Circle
void Circle(int x,int y,int r,const uint clr); // Draw a circle according to specified coordinates, radius and color
Inputs:
- x - X coordinate
- y - Y coordinate
- r - circle radius
- clr - circle color
Ellipse
void Ellipse(int x1,int y1,int x2,int y2,const uint clr); // Draw an ellipse according to specified coordinates and color
Inputs:
- x1 - first point X coordinate
- y1 - first point Y coordinate
- x2 - second point X coordinate
- y2 - second point Y coordinate
- clr - ellipse color
Descriptions of other methods, including Arc and Pie, are too large to show them here. You can find their descriptions in the documentation by following the links above.
The considered methods display simple primitives with the line width of 1 pixel and the ordinary STYLE_SOLID line style. You can use them if you are fine with simple graphics.
But if you need something different than STYLE_SOLID, select one of the methods described below.
//--- Methods for drawing primitives with smoothing using antialiasing

void PixelSetAA(const double x,const double y,const uint clr);

void LineAA(const int x1,const int y1,const int x2,const int y2,const uint clr,const uint style=UINT_MAX);

void PolylineAA(int &x[],int &y[],const uint clr,const uint style=UINT_MAX);

void PolygonAA(int &x[],int &y[],const uint clr,const uint style=UINT_MAX);

void TriangleAA(const int x1,const int y1,const int x2,const int y2,const int x3,const int y3,const uint clr,const uint style=UINT_MAX);

void CircleAA(const int x,const int y,const double r,const uint clr,const uint style=UINT_MAX);

void EllipseAA(const double x1,const double y1,const double x2,const double y2,const uint clr,const uint style=UINT_MAX);

//--- Methods for drawing primitives with smoothing using Wu's algorithm

void LineWu(int x1,int y1,int x2,int y2,const uint clr,const uint style=UINT_MAX);

void PolylineWu(const int &x[],const int &y[],const uint clr,const uint style=UINT_MAX);

void PolygonWu(const int &x[],const int &y[],const uint clr,const uint style=UINT_MAX);

void TriangleWu(const int x1,const int y1,const int x2,const int y2,const int x3,const int y3,const uint clr,const uint style=UINT_MAX);

void CircleWu(const int x,const int y,const double r,const uint clr,const uint style=UINT_MAX);

void EllipseWu(const int x1,const int y1,const int x2,const int y2,const uint clr,const uint style=UINT_MAX);
All these methods are similar to the ones considered above but they have an additional style parameter that can be selected from the ENUM_LINE_STYLE enumeration. It is highlighted in yellow in the listing. If the style parameter is not set (equal to UINT_MAX), the called method uses the m_style value set by means of the LineStyleSet method. The value can be obtained using the LineStyleGet method.
You might have noticed that the methods have the ability to set a line style but they are unable to change a line width. The following methods allow drawing primitives with the ability to set the line width.
//--- Methods for drawing primitives with preliminarily set antialiasing filter

void LineThickVertical(const int x,const int y1,const int y2,const uint clr,const int size,const uint style,ENUM_LINE_END end_style);

void LineThickHorizontal(const int x1,const int x2,const int y,const uint clr,const int size,const uint style,ENUM_LINE_END end_style);

void LineThick(const int x1,const int y1,const int x2,const int y2,const uint clr,const int size,const uint style,ENUM_LINE_END end_style);

void PolylineThick(const int &x[],const int &y[],const uint clr,const int size,const uint style,ENUM_LINE_END end_style);

void PolygonThick(const int &x[],const int &y[],const uint clr,const int size,const uint style,ENUM_LINE_END end_style);
Similar to the methods described above, the current methods provide the ability to set the style line style. They also feature the new parameters, such as size - setting the line width, as well as end_style - line completion style that can be selected from the ENUM_LINE_END enumeration.
Besides, CCanvas has the methods for drawing smoothed primitives using the Bézier method. In order to improve the final image quality, the resulting primitives are handled using the bitmap smoothing algorithm. Unlike the previous methods, the primitives here consist of Bézier curves rather than of straight lines. Let's consider these methods.
//--- Methods for drawing a smoothed polyline and smoothed polygon

void PolylineSmooth(const int &x[],const int &y[],const uint clr,const int size,
                    ENUM_LINE_STYLE style=STYLE_SOLID,ENUM_LINE_END end_style=LINE_END_ROUND,
                    double tension=0.5,double step=10);

void PolygonSmooth(int &x[],int &y[],const uint clr,const int size,
                   ENUM_LINE_STYLE style=STYLE_SOLID,ENUM_LINE_END end_style=LINE_END_ROUND,
                   double tension=0.5,double step=10);
In addition to the already familiar arrays of x and y primitive coordinate points, clr color, size line width, style line style and end_style line completion style, here we have two additional tension parameters - smoothing parameter value and step - approximation step.
Apart from the primitive drawing methods considered above, CCanvas features the methods of drawing filled primitives.
//--- Methods of drawing filled primitives

void FillRectangle(int x1,int y1,int x2,int y2,const uint clr);

void FillTriangle(int x1,int y1,int x2,int y2,int x3,int y3,const uint clr);

void FillPolygon(int &x[],int &y[],const uint clr);

void FillCircle(int x,int y,int r,const uint clr);

void FillEllipse(int x1,int y1,int x2,int y2,const uint clr);

void Fill(int x,int y,const uint clr);

void Fill(int x,int y,const uint clr,const uint threshould);
These are simple methods having no smoothing algorithms. Assigning parameters is performed similar to the parameters of the methods we have already considered and involves creation of similar primitives consisting of lines.
Pixel format and color components
Let's get back to the methods considered above and focus our attention on the pixel format in the CreateBitmap and CreateBitmapLabel methods. The clrfmt parameter is responsible for the format. The parameter sets the pixel format created for the graphical resource, which later connects to the appropriate chart object. The pixel format set for the graphical resource during Canvas creation by means of the CreateBitmap or CreateBitmapLabel methods affects the method of handling an image by the terminal when displaying it on the chart. In order to define the image handling methods, let's refer to ENUM_COLOR_FORMAT. Here we can select one of three possible constant values.
ENUM_COLOR_FORMAT
- COLOR_FORMAT_XRGB_NOALPHA - XRGB format (alpha channel is ignored)
- COLOR_FORMAT_ARGB_RAW - "raw" ARGB format (color components are not handled by the terminal)
- COLOR_FORMAT_ARGB_NORMALIZE - ARGB format (color components are handled by the terminal)
Now let's consider the order of providing color components in these formats.
![]()
Here we can see the location of color components in m_pixels pixel array cell bytes, where R is a red channel, G - green channel, B - blue channel, A - alpha channel and X - unused byte. uint pixel data type, 4 bytes. One byte per channel. One byte can store numbers from 0 to 255. We are able to set the pixel color by changing the byte values. For example, when setting 255 to the R channel and 0 to the G and B channels, we get the red color. When setting 255 to the G channel, while the remaining values are set to 0, we get the green color. If the B channel is set to 255, while the remaining ones are set to 0, we get the blue color. Thus, we can get different colors by setting the various combinations of RGB channel values. By setting the alpha channel value from 0 (completely invisible, transparent) to 255 (completely visible, non-transparent), we are able to manage the pixel non-transparency by creating the effect of chart image pixels overlapping. This can be correctly done in COLOR_FORMAT_ARGB_NORMALIZE format. Now let's move on to colors and consider the color palette.
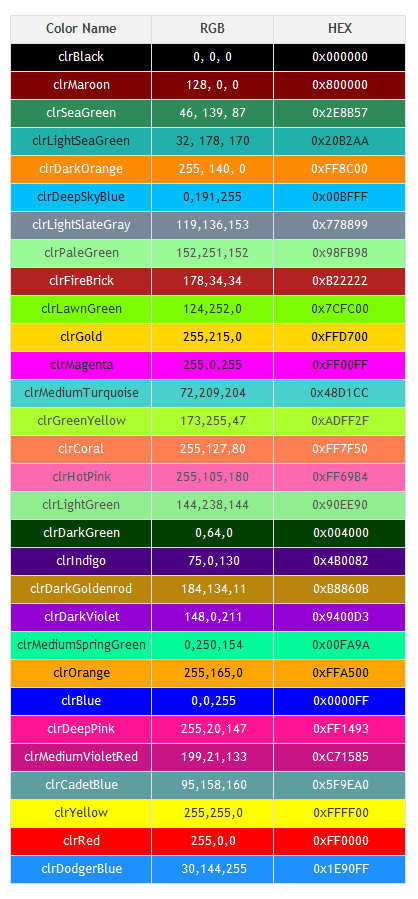
Here we can clearly see how changing the combination of levels of each channel affects the resulting color. The colors are provided in RGB and HEX formats. While I have already considered RGB, HEX needs some clarifications, especially for novice programmers willing to master CCanvas. Let's consider the hexadecimal number system containing numbers from 0 to 15 and compare it with the decimal system (0-9). The decimal system has the following symbols: 0, 1, 2, 3, 4, 5, 6, 7, 8 and 9. So how should we denote numbers exceeding 9 in the hexadecimal system? For that case, the system uses Latin characters from A to F. Thus, the hexadecimal number system has the following set of symbols: 0, 1, 2, 3, 4, 5, 6, 7, 8, 9, A, B, C, D, E and F. Now we can easily understand how the byte containing the channel value looks in HEX format. In C-based programming languages, HEX is denoted as 0x[value]. Thus, a range of a single byte looks like values from 0x00 to 0xFF.
Examples of creating graphics using CCanvas
Let's get back to the pixel format and consider a simple example of an application applying CCanvas. Besides, we will play around with various pixel format values by attempting to set image color and alpha channel values in different pixel formats. Let's start from the most universal format COLOR_FORMAT_ARGB_NORMALIZE. We will use it to develop our first application.
A simple application using CCanvas
Create a script and name it Erase.mq5.
#include <Canvas\Canvas.mqh>

//+------------------------------------------------------------------+
//| Script program start function                                    |
//+------------------------------------------------------------------+
void OnStart()
 {
    CCanvas canvas;
    canvas.CreateBitmapLabel("canvas", 15, 30, 300, 250, COLOR_FORMAT_ARGB_NORMALIZE);
    canvas.Erase(ColorToARGB(clrWhite, 255));
    canvas.Update(true);
    Sleep(6000);
    canvas.Destroy();
 }
In the first string, we can see the inclusion of the Canvas.mqh module. Now it is possible to create an object, an instance of the CCanvas class, for further work as shown in the example.
CCanvas canvas;
Next, create the Canvas itself with the clrfmt parameter: COLOR_FORMAT_ARGB_NORMALIZE.
canvas.CreateBitmapLabel("canvas", 15, 30, 300, 250, COLOR_FORMAT_ARGB_NORMALIZE);
And fill it using the Erase method.
canvas.Erase(ColorToARGB(clrWhite, 255));
After creating Canvas, call the Update method.
canvas.Update(true); With redraw: true. This is an optional parameter since it is set by default anyway but I suggest setting it for more clarity. Next, wait for 6 seconds to see the result of handling the application on the chart.
Sleep(6000);
Next, call the Destroy method for releasing memory occupied by the graphical resource and chart object.
canvas.Destroy();
Next, the script completes its work. The result can be seen in the image below.
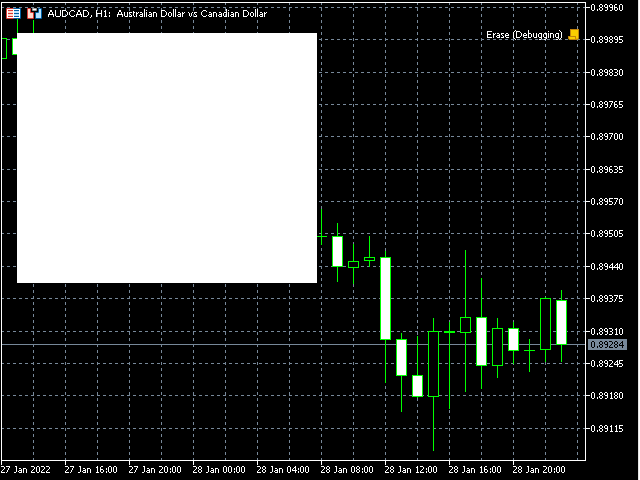
Here we can see a filled rectangle that can be used as a basis or background for drawing more complex graphical constructions.
Pixel format and overlapping methods
Let's have a look at the already considered example Erase.mq5 and try setting the color directly, without the ColorToARGB function. Copy the entire code of the example and create a script named ARGB_NORMALIZE.mq5. Next, set the color by selecting one of the colors from the palette mentioned above, for example clrPaleGreen. Take its value in the HEX format and add the 0xFF alpha channel value to the left.
#include <Canvas\Canvas.mqh>

//+------------------------------------------------------------------+
//| Script program start function                                    |
//+------------------------------------------------------------------+
void OnStart()
 {
    CCanvas canvas;
    canvas.CreateBitmapLabel("canvas", 15, 30, 300, 250, COLOR_FORMAT_ARGB_NORMALIZE);
    canvas.Erase(0xFF98FB98);
    canvas.Update(true);
    Sleep(6000);
    canvas.Destroy();
 }
RGB components in the listing are highlighted in green, the A component is highlighted in gray. Launch the script and see the result.
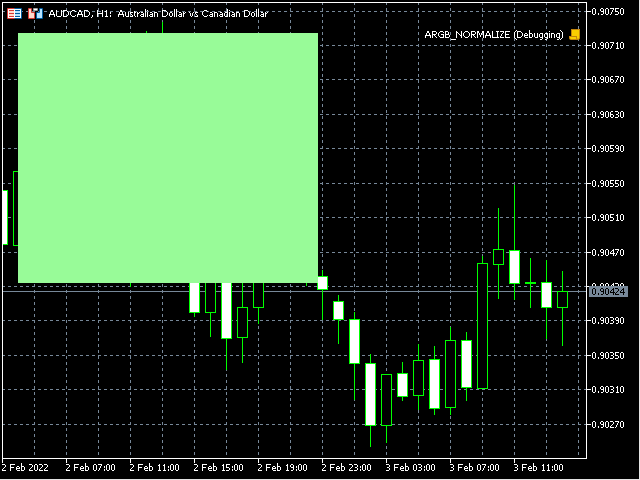
We see how the image color has changed. Now let's try to change the transparency. Set the alpha channel value to 0xCC.
void OnStart()
 {
    CCanvas canvas;
    canvas.CreateBitmapLabel("canvas", 15, 30, 300, 250, COLOR_FORMAT_ARGB_NORMALIZE);
    canvas.Erase(0xCC98FB98);
    canvas.Update(true);
    Sleep(6000);
    canvas.Destroy();
 }
Now have a look at the result.
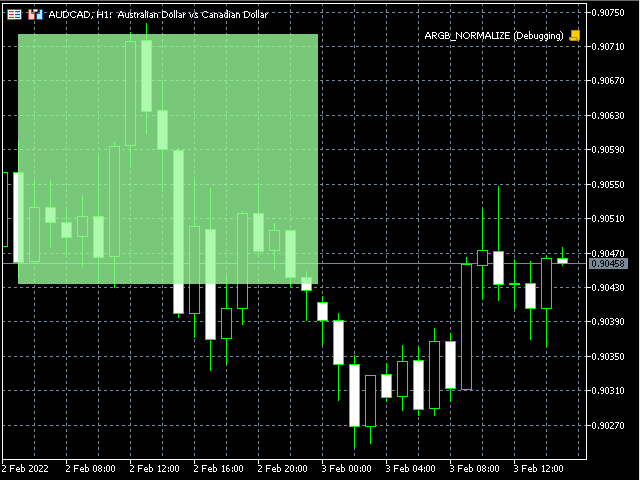
Here we can see that the filled area has become semi-transparent.
Change the pixel format to COLOR_FORMAT_ARGB_RAW and make the image completely non-transparent again. To do this, create a separate example ARGB_RAW.mq5.
void OnStart()
 {
    CCanvas canvas;
    canvas.CreateBitmapLabel("canvas", 15, 30, 300, 250, COLOR_FORMAT_ARGB_RAW);
    canvas.Erase(0xFF98FB98);
    canvas.Update(true);
    Sleep(6000);
    canvas.Destroy();
 }
Run the example and have a look at the result.
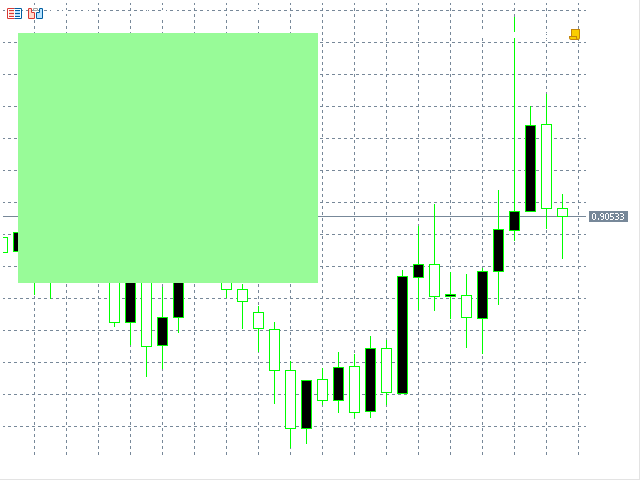
We can see that the result is not different from that of COLOR_FORMAT_ARGB_NORMALIZE.
Set the alpha channel to 0xFB and change the chart background color to white.
void OnStart()
 {
    ChartSetInteger(0, CHART_COLOR_BACKGROUND, clrWhite);
    CCanvas canvas;
    canvas.CreateBitmapLabel("canvas", 15, 30, 300, 250, COLOR_FORMAT_ARGB_RAW);
    canvas.Erase(0xFB98FB98);
    canvas.Update(true);
    Sleep(6000);
    canvas.Destroy();
 }
Here we can see only a slight change and no difference from the COLOR_FORMAT_ARGB_NORMALIZE pixel format.
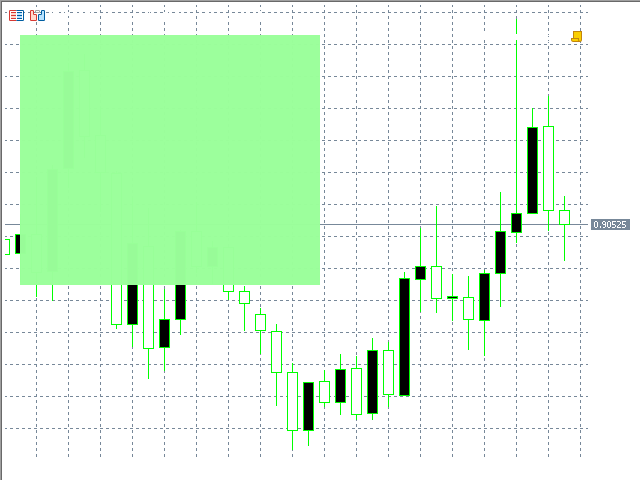
But if we decrease the alpha channel value by one,
canvas.Erase(0xFA98FB98); we immediately notice quite considerable changes of the final image.
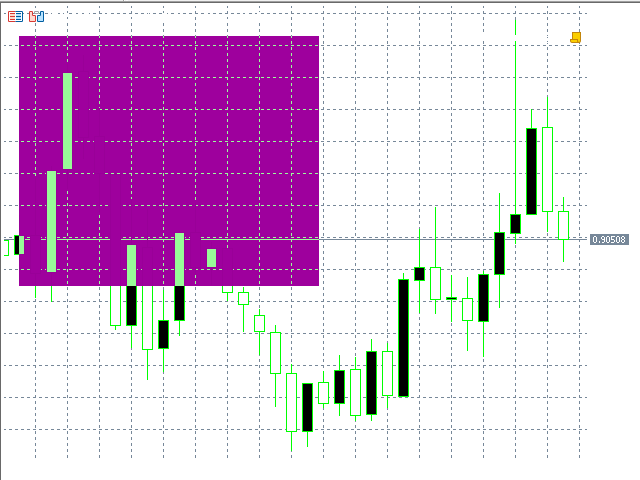
Now let's check how the image behaves in case of a full transparency change. To do this, create a new example and name it ARGB_RAW-2.mq5. Copy the code from the previous example there and make slight changes so that the alpha channel value is able to change from 255 to 0 with a specified interval.
void OnStart()
 {
  ChartSetInteger(0, CHART_COLOR_BACKGROUND, clrWhite);
  CCanvas canvas;
  canvas.CreateBitmapLabel("canvas", 15, 30, 300, 250, COLOR_FORMAT_ARGB_RAW);
  canvas.Erase(0xFF98FB98);
  for(int a = 255; a >= 0; a--)
   {
    canvas.TransparentLevelSet((uchar)a);
    canvas.Update(true);
    Sleep(100);
   }
  canvas.Destroy();
 }
As we can see in the listing, the application features the for loop changing the transparency (a loop variable) by calling the TrancparentLevelSet method and changing the transparency of the entire image.
canvas.TransparentLevelSet((uchar)a); Next, call the already familiar Update method.
canvas.Update(true); Next, the Sleep function makes the loop wait for 100 milliseconds (so that users have time to see the change in transparency).
Sleep(100); Then the application removes Canvas
canvas.Destroy();
and completes its work. The result can be seen in the GIF animation below.
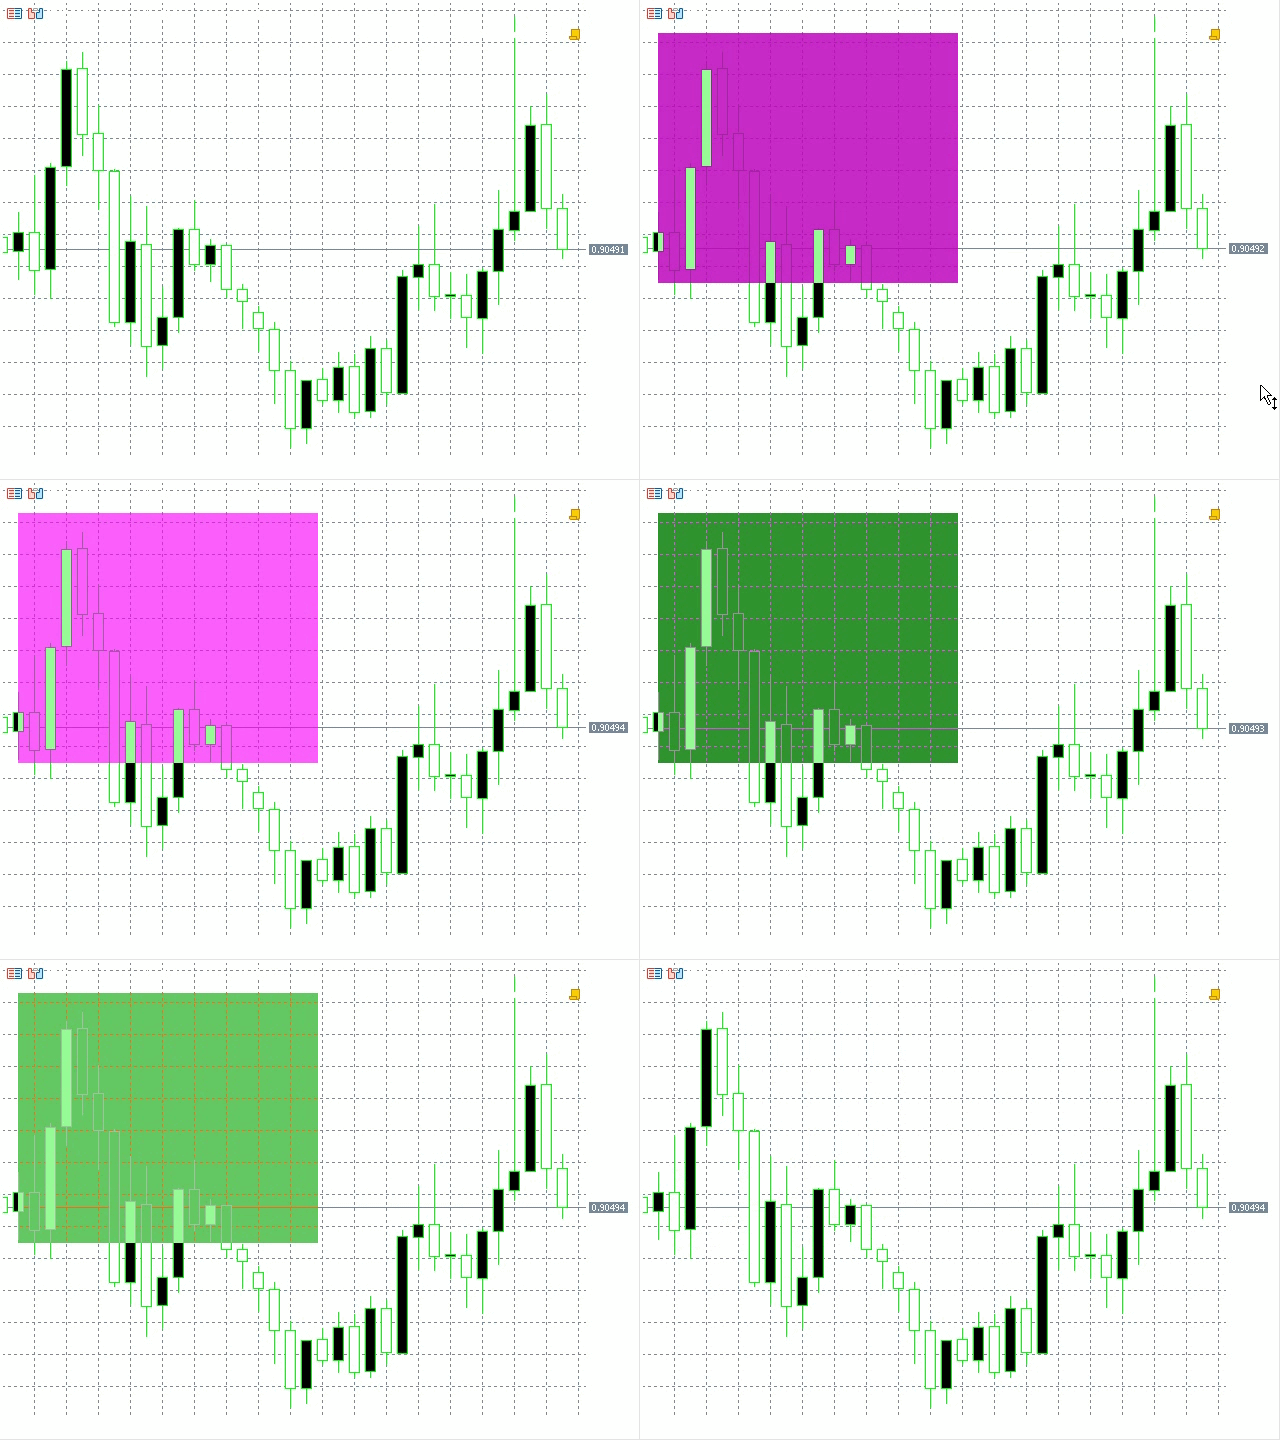
From the example below, as well as from all the examples applying the COLOR_FORMAT_ARGB_RAW format, we can see that the image with the alpha channel value of 255 is displayed correctly. But if we decrease the value, the image is distorted since the format has no RGB channel value normalization. The channels may get overfilled and, thus, create artefacts and distortions since overfilled values exceeding 255 are simply discarded. On the other hand, using this format accelerates displaying the image compared to the COLOR_FORMAT_ARGB_NORMALIZE format.
Let's get back to our example concerning the use of the COLOR_FORMAT_ARGB_RAW pixel format ARGB_RAW.mq5. Create the script named XRGB_NOALPHA.mq5 and copy the code from ARGB_RAW.mq5 to it by setting the pixel format to COLOR_FORMAT_XRGB_NOALPHA. Also, set the alpha channel value in the Erase method to zero.
void OnStart()
 {
    CCanvas canvas;
    canvas.CreateBitmapLabel("canvas", 15, 30, 300, 250, COLOR_FORMAT_XRGB_NOALPHA);
    canvas.Erase(0x0098FB98);
    canvas.Update(true);
    Sleep(6000);
    canvas.Destroy();
 }
Launch the script to see the result.
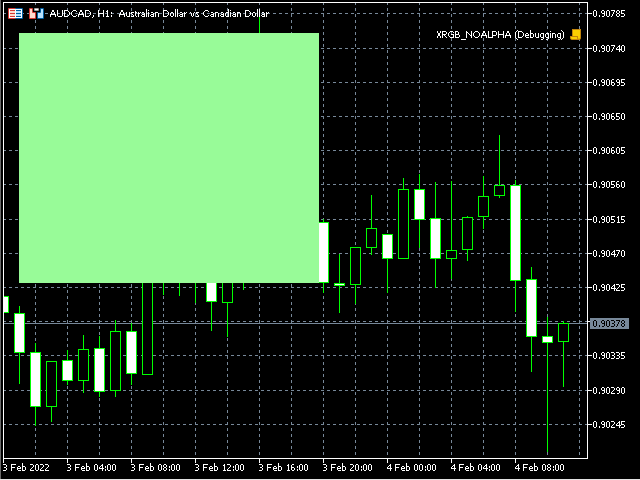
As we can see, the result is no different from the COLOR_FORMAT_ARGB_NORMALIZE and COLOR_FORMAT_ARGB_RAW formats with the maximum alpha channel value (0xFF) in the Erase method. Thus, we can see that the alpha channel value is completely ignored in this format and the image is simply superimposed over the chart image.
Text display
We know that CCanvas features the method for displaying the TextOut text. Let's try to display the text. Create the script and name it TextOut.mq5. Let's use the above considered Erase.mq5 as a basis by coping its code. Add the method for setting the FontSet font parameters and set the necessary values, font "Calibri" and font size -210.
To set the font size in pixels size in the FontSet and FontSizeSet methods, it should be multiplied by -10. Thus, in case of the font size of 21 pixels, size is equal to -210.
The remaining parameters are left by default. Next, add the TextOut method with the text parameter: "Text". All other strings necessary for the example operation remain in the copied code.
void OnStart()
 {
    CCanvas canvas;
    canvas.CreateBitmapLabel("canvas", 15, 30, 300, 250, COLOR_FORMAT_ARGB_NORMALIZE);
    canvas.Erase(ColorToARGB(clrWhite, 255));
    canvas.FontSet("Calibri", -210);
    canvas.TextOut(15, 15, "Text", ColorToARGB(clrLightSlateGray, 255));
    canvas.Update(true);
    Sleep(6000);
    canvas.Destroy();
 }
Let's see the result of the script operation.
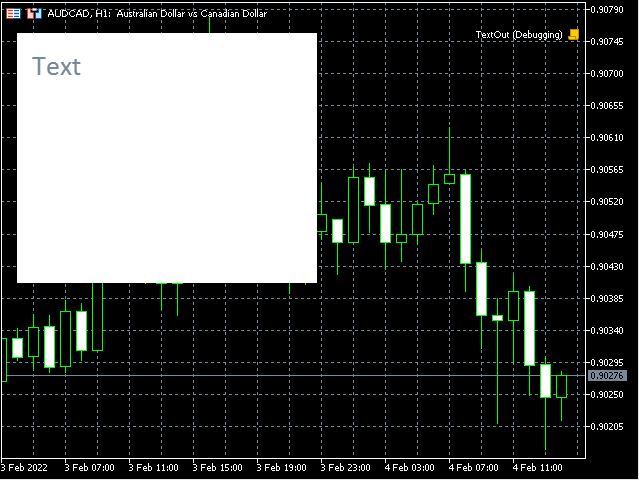
The text appears on the image.
Let's change the example so that the image appears exactly at the center of the chart and reminds the Label object (OBJ_LABEL). Create a new example based on the script and name it TextOut-2.mq5.
void OnStart()
 {
  string text = "Text";
  int width, height;
  const int textXDist = 10, textYDist = 5;
  int canvasX, canvasY;
  CCanvas canvas;

  canvas.FontSet("Calibri", -210);
  canvas.TextSize(text, width, height);

  canvasX = (int)ChartGetInteger(0, CHART_WIDTH_IN_PIXELS, 0) / 2 - width / 2;
  canvasY = (int)ChartGetInteger(0, CHART_HEIGHT_IN_PIXELS, 0) / 2 - height / 2;

  canvas.CreateBitmapLabel("canvas", canvasX, canvasY,
                           width + textXDist * 2, height + textYDist * 2,
                           COLOR_FORMAT_ARGB_NORMALIZE);
  canvas.Erase(ColorToARGB(clrWhite, 255));
  canvas.TextOut(textXDist, textYDist, text, ColorToARGB(clrLightSlateGray, 255));
  canvas.Update(true);
  Sleep(6000);
  canvas.Destroy();
 }
According to the listing, the displayed text is set to the text variable (since it is accessed in the script code twice).
string text = "Text"; The width and height variables have been declared for saving the displayed text size.
int width, height; The two declared constants textXDist and textYDist save the indents of the displayed text from the right and top edges of the image respectively.
const int textXDist = 10, textYDist = 5; Next, there are two declared variables canvasX and canvasY for storing the results of image coordinate calculations.
int canvasX, canvasY; Next comes the FontSet method defining the font parameters (to set them beforehand).
canvas.FontSet("Calibri", -210);
The TextSize method allows defining the size of a displayed text (in order to define the image size) saved to the width and height variables.
canvas.TextSize(text, width, height); Next, we calculate the image coordinates used to display the image at the center of a chart.
canvasX = (int)ChartGetInteger(0, CHART_WIDTH_IN_PIXELS, 0) / 2 - width / 2;
canvasY = (int)ChartGetInteger(0, CHART_HEIGHT_IN_PIXELS, 0) / 2 - height / 2;
Next, we create the image using the CreateBitmapLabel where the previously calculated coordinates are set.
canvas.CreateBitmapLabel("canvas", canvasX, canvasY,
                           width + textXDist * 2, height + textYDist * 2,
                           COLOR_FORMAT_ARGB_NORMALIZE);
After that, the image is filled with color using the Erase method.
canvas.Erase(ColorToARGB(clrWhite, 255));
Next, the text is displayed (text) using the TextOut method specifying the previously set textXDist and textYDist coordinates.
canvas.TextOut(textXDist, textYDist, text, ColorToARGB(clrLightSlateGray, 255)); Next, we have the already familiar strings that require no explanation. Let's launch the script and see the result.
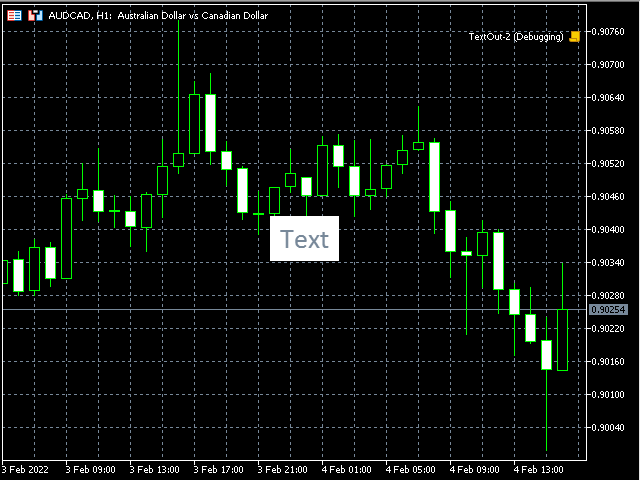
The image displays an object similar to a text label. But it lacks the transparent background. The background can be set in our current pixel format COLOR_FORMAT_ARGB_NORMALIZE. But I will go another way. Let's set the COLOR_FORMAT_ARGB_RAW pixel format to our Canvas since we do not need mixing colors in this case, while the colors with the alpha channel 0 and 255 in the format are displayed without distortion. The color with the alpha channel value of 0 does not affect the final image. Copy the LabelExample.mq5 script based on the previous example.
void OnStart()
 {
  string text = "Text";
  int width, height;
  const int textXDist = 10, textYDist = 5;
  int canvasX, canvasY;
  CCanvas canvas;

  canvas.FontSet("Calibri", -210);
  canvas.TextSize(text, width, height);

  canvasX = (int)ChartGetInteger(0, CHART_WIDTH_IN_PIXELS, 0) / 2 - width / 2;
  canvasY = (int)ChartGetInteger(0, CHART_HEIGHT_IN_PIXELS, 0) / 2 - height / 2;

  canvas.CreateBitmapLabel("canvas", canvasX, canvasY,
                           width + textXDist * 2, height + textYDist * 2,
                           COLOR_FORMAT_ARGB_RAW);
  canvas.Erase(ColorToARGB(clrWhite, 255));
  canvas.FontSet("Calibri", -210);
  canvas.TextOut(textXDist, textYDist, text, ColorToARGB(clrLightSlateGray, 255));
  canvas.Update(true);
  Sleep(6000);
  canvas.Destroy();
 }
The alpha channel has remained unchanged so that we are able to make sure that the alpha channel of 255 fully redraws chart pixels.
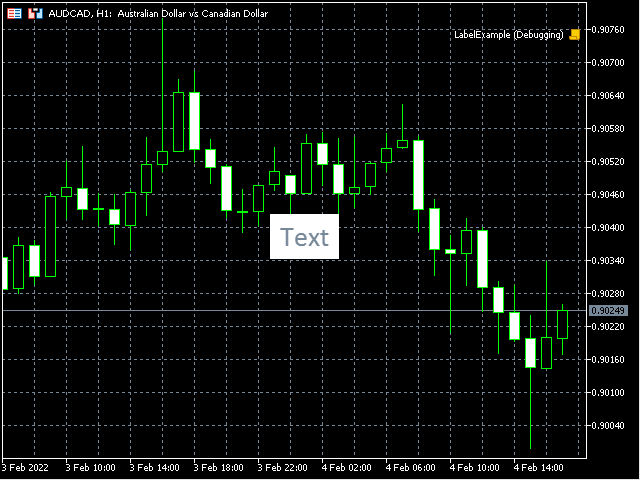
Now let's set the alpha channel value to 0.
void OnStart()
 {
  string text = "Text";
  int width, height;
  const int textXDist = 10, textYDist = 5;
  int canvasX, canvasY;
  CCanvas canvas;

  canvas.FontSet("Calibri", -210);
  canvas.TextSize(text, width, height);

  canvasX = (int)ChartGetInteger(0, CHART_WIDTH_IN_PIXELS, 0) / 2 - width / 2;
  canvasY = (int)ChartGetInteger(0, CHART_HEIGHT_IN_PIXELS, 0) / 2 - height / 2;

  canvas.CreateBitmapLabel("canvas", canvasX, canvasY,
                           width + textXDist * 2, height + textYDist * 2,
                           COLOR_FORMAT_ARGB_RAW);
  canvas.Erase(ColorToARGB(clrWhite, 0));
  canvas.FontSet("Calibri", -210);
  canvas.TextOut(textXDist, textYDist, text, ColorToARGB(clrLightSlateGray, 255));
  canvas.Update(true);
  Sleep(6000);
  canvas.Destroy();
 }
Run the script and see the result.
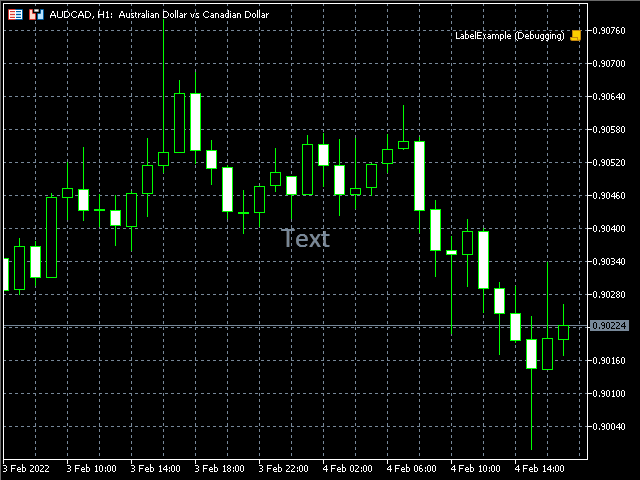
We can see the text label analogue (OBJ_LABEL). Thus, we are able to display texts above images without completely redrawing them. This is widely used in various UIs for highlighting controls and displaying text data.
Drawing simple primitives without smoothing
Let's consider DrawPrimitives.mq5 to understand how to draw primitives in CCanvas.
void OnStart()
 {
  CCanvas canvas;
  int w, h;
  int minSize, point;
  uint color_ = ColorToARGB(clrDodgerBlue, 255);
  uint fillColor = ColorToARGB(clrRed, 255);
  int plX[] = {6, 8, 9, 11, 12, 14}, plY[] = {14, 12, 13, 11, 12, 10};
  int pgX[] = {15, 14, 15, 17, 18, 17}, pgY[] = {9, 7, 5, 5, 7, 9};
  w = (int)ChartGetInteger(0, CHART_WIDTH_IN_PIXELS, 0);
  h = (int)ChartGetInteger(0, CHART_HEIGHT_IN_PIXELS, 0);
  minSize = (int)fmin(w, h);
  point = minSize / 15;
  canvas.CreateBitmapLabel("canvas", 0, 0, w, h, COLOR_FORMAT_XRGB_NOALPHA);
  canvas.Erase(ColorToARGB(clrWhite, 255));
  canvas.LineHorizontal(point, w - point, h - point, color_);
  canvas.LineVertical(point, point, h - point, color_);
  canvas.Line(point * 2, point * 13, point * 8, point * 9, color_);
  for (int i = 0; i < (int)plX.Size(); i++)
    plX[i] *= point;
  for (int i = 0; i < (int)plY.Size(); i++)
    plY[i] *= point;
  canvas.Polyline(plX, plY, color_);
  for (int i = 0; i < (int)pgX.Size(); i++)
    pgX[i] *= point;
  for (int i = 0; i < (int)pgY.Size(); i++)
    pgY[i] *= point;
  canvas.Polygon(pgX, pgY, color_);
  canvas.Rectangle(point * 2, point * 5, point * 7, point, color_);
  canvas.Triangle(point * 2, point * 11, point * 2, point * 6, point * 7, point * 6, color_);
  canvas.Circle(point * 10, point * 3, point * 2, color_);
  canvas.Ellipse(point * 8, point * 9, point * 12, point * 6, color_);
  canvas.Arc(point * 15, point * 2, point * 2, point, 45.0 * M_PI / 180, 180.0 * M_PI / 180, color_);
  canvas.Pie(point * 16, point * 3, point * 2, point, 180.0 * M_PI / 180, 402.5 * M_PI / 180, color_, fillColor);
  canvas.Update(true);
  Sleep(6000);
  canvas.Destroy();
 }
All primitives can be conveniently drawn along the squares. Their coordinates and remaining parameters can be conveniently set using the same method. Therefore, I decided to simplify the task by dividing the CCanvas image into parts having the same width and height so that it is possible to set coordinates in squares and convert them to pixels by multiplying coordinates in squares by the size of a single square. To achieve this, I took the chart size as CCanvas image size and divided the least size value by 15.
  CCanvas canvas;
  int w, h;
  int minSize, point;
  uint color_ = ColorToARGB(clrDodgerBlue, 255);
  uint fillColor = ColorToARGB(clrRed, 255);
  int plX[] = {6, 8, 9, 11, 12, 14}, plY[] = {14, 12, 13, 11, 12, 10};
  int pgX[] = {15, 14, 15, 17, 18, 17}, pgY[] = {9, 7, 5, 5, 7, 9};
  w = (int)ChartGetInteger(0, CHART_WIDTH_IN_PIXELS, 0);
  h = (int)ChartGetInteger(0, CHART_HEIGHT_IN_PIXELS, 0);
  minSize = (int)fmin(w, h);
  point = minSize / 15;
The code is highlighted in yellow in the listing. Now that we know the size of a single square (the point variable), we are able to convert the coordinates set in squares to their actual size in pixels. Before creating the example, I divided the chart image into squares and used them to set the coordinates of all primitives in the script.
int plX[] = {6, 8, 9, 11, 12, 14}, plY[] = {14, 12, 13, 11, 12, 10};
int pgX[] = {15, 14, 15, 17, 18, 17}, pgY[] = {9, 7, 5, 5, 7, 9};
Here I set the coordinates for a polyline (Polyline) and a polygon (Polygon) in the array. Then I converted them into pixels selecting arrays in the loops one by one and drew a polyline and a polygon.
  for (int i = 0; i < (int)plX.Size(); i++)
    plX[i] *= point;
  for (int i = 0; i < (int)plY.Size(); i++)
    plY[i] *= point;
  canvas.Polyline(plX, plY, color_);
  for (int i = 0; i < (int)pgX.Size(); i++)
    pgX[i] *= point;
  for (int i = 0; i < (int)pgY.Size(); i++)
    pgY[i] *= point;
  canvas.Polygon(pgX, pgY, color_);
The code for calling the primitive drawing methods is highlighted in yellow. The remaining primitives are displayed the following way.
  canvas.Polygon(pgX, pgY, color_);
  canvas.Rectangle(point * 2, point * 5, point * 7, point, color_);
  canvas.Triangle(point * 2, point * 11, point * 2, point * 6, point * 7, point * 6, color_);
  canvas.Circle(point * 10, point * 3, point * 2, color_);
  canvas.Ellipse(point * 8, point * 9, point * 12, point * 6, color_);
  canvas.Arc(point * 15, point * 2, point * 2, point, 45.0 * M_PI / 180, 180.0 * M_PI / 180, color_);
  canvas.Pie(point * 16, point * 3, point * 2, point, 180.0 * M_PI / 180, 402.5 * M_PI / 180, color_, fillColor);
As we can see in the listing, all coordinates are multiplied by point for converting to pixels. Let's consider the script result.
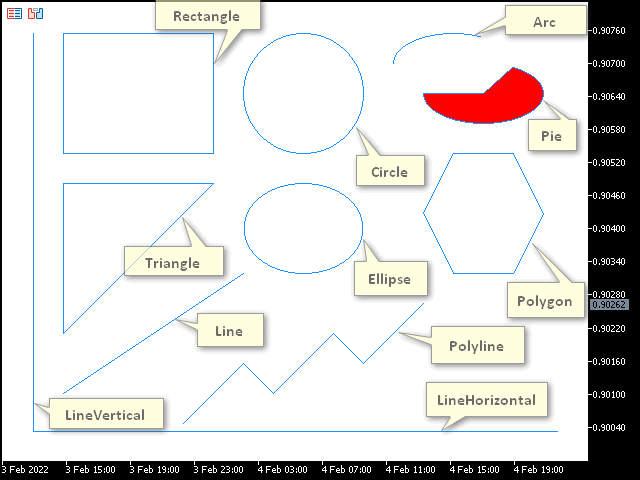
We can see the primitives with the simple line drawing style (STYLE_SOLID) which cannot be changed.
Drawing primitives with smoothing and changeable line style
To allow the line style to be changed, use the methods with the sorting algorithm applying antialiasing (AA). Create the script DrawPrimitivesAA.mq5 and copy the code from the previous example to it. All methods present in the CCanvas class with the AA prefix (LineAA, PolylineAA, PolygonAA, TriangleAA, CircleAA and EllipseAA) are made fully compliant. Other methods are removed. Since we now have less primitives compared to the previous example, we can change their location.
void OnStart()
 {
  CCanvas canvas;
  int w, h;
  int minSize, point;
  uint color_ = ColorToARGB(clrDodgerBlue, 255);
  uint fillColor = ColorToARGB(clrRed, 255);
  int plX[] = {6, 8, 9, 11, 12, 14}, plY[] = {13, 11, 12, 10, 11, 9};
  int pgX[] = {15, 14, 15, 17, 18, 17}, pgY[] = {7, 5, 3, 3, 5, 7};
  ENUM_LINE_STYLE lineStyle = STYLE_SOLID;
  w = (int)ChartGetInteger(0, CHART_WIDTH_IN_PIXELS, 0);
  h = (int)ChartGetInteger(0, CHART_HEIGHT_IN_PIXELS, 0);
  minSize = (int)fmin(w, h);
  point = minSize / 15;
  canvas.CreateBitmapLabel("canvas", 0, 0, w, h, COLOR_FORMAT_XRGB_NOALPHA);
  canvas.Erase(ColorToARGB(clrWhite, 255));
  canvas.LineStyleSet(lineStyle);
  canvas.LineAA(point * 2, point * 12, point * 8, point * 8, color_);
  for (int i = 0; i < (int)plX.Size(); i++)
    plX[i] *= point;
  for (int i = 0; i < (int)plY.Size(); i++)
    plY[i] *= point;
  canvas.PolylineAA(plX, plY, color_);
  for (int i = 0; i < (int)pgX.Size(); i++)
    pgX[i] *= point;
  for (int i = 0; i < (int)pgY.Size(); i++)
    pgY[i] *= point;
  canvas.PolygonAA(pgX, pgY, color_);
  canvas.TriangleAA(point * 2, point * 9, point * 2, point * 4, point * 7, point * 4, color_);
  canvas.CircleAA(point * 16, point * 11, point * 2, color_);
  canvas.EllipseAA(point * 8, point * 4, point * 12, point * 7, color_);
  canvas.Update(true);
  Sleep(6000);
  canvas.Destroy();
 }
Changed strings are highlighted in yellow. Now let's launch the script and have a look at the result.
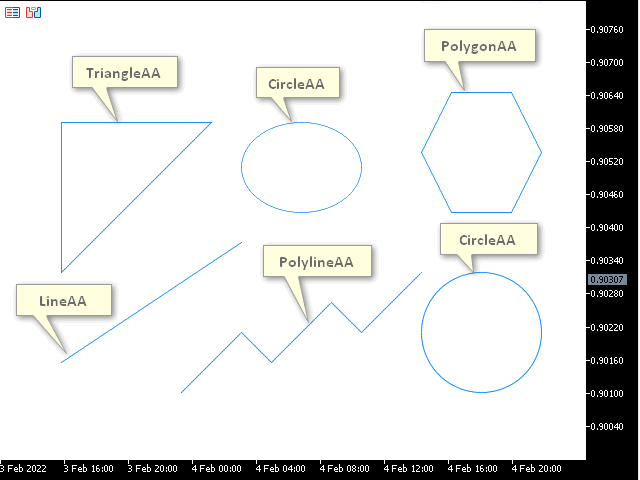
The image displays the results of methods with antialiasing. The lines look more smooth compared to the previous example involving simple primitives.
However, the line style is still STYLE_SOLID here. Let's fix this by creating the script DrawPrimitivesAA-2.mq5 and inserting the code of the previous example there. Set sleep as an input parameter setting the delay after changing the line style and displaying primitives.
#property script_show_inputs

//--- input parameters
input int sleep = 1000;
All drawing methods are set in the macro.
#define drawPrimitives canvas.Erase(ColorToARGB(clrWhite, 255));                               \
  canvas.LineAA(point * 2, point * 12, point * 8, point * 8, color_);                          \
  canvas.PolylineAA(plX, plY, color_);                                                         \
  canvas.PolygonAA(pgX, pgY, color_);                                                          \
  canvas.TriangleAA(point * 2, point * 9, point * 2, point * 4, point * 7, point * 4, color_); \
  canvas.CircleAA(point * 16, point * 11, point * 2, color_);                                  \
  canvas.EllipseAA(point * 8, point * 4, point * 12, point * 7, color_);                       \
  canvas.Update(true);                                                                         \
  Sleep(sleep);
Next, change the line drawing style one by one by using the LineStyleSet method and displaying primitives. Let's have a look at the example.
#property script_show_inputs

//--- input parameters
input int sleep = 1000;

//+------------------------------------------------------------------+
//|                                                                  |
//+------------------------------------------------------------------+
#include <Canvas\Canvas.mqh>

//+------------------------------------------------------------------+
//|                                                                  |
//+------------------------------------------------------------------+
#define drawPrimitives canvas.Erase(ColorToARGB(clrWhite, 255));                               \
  canvas.LineAA(point * 2, point * 12, point * 8, point * 8, color_);                          \
  canvas.PolylineAA(plX, plY, color_);                                                         \
  canvas.PolygonAA(pgX, pgY, color_);                                                          \
  canvas.TriangleAA(point * 2, point * 9, point * 2, point * 4, point * 7, point * 4, color_); \
  canvas.CircleAA(point * 16, point * 11, point * 2, color_);                                  \
  canvas.EllipseAA(point * 8, point * 4, point * 12, point * 7, color_);                       \
  canvas.Update(true);                                                                         \
  Sleep(sleep);

//+------------------------------------------------------------------+
//| Script program start function                                    |
//+------------------------------------------------------------------+
void OnStart()
 {
  CCanvas canvas;
  int w, h;
  int minSize, point;
  uint color_ = ColorToARGB(clrDodgerBlue, 255);
  uint fillColor = ColorToARGB(clrRed, 255);
  int plX[] = {6, 8, 9, 11, 12, 14}, plY[] = {13, 11, 12, 10, 11, 9};
  int pgX[] = {15, 14, 15, 17, 18, 17}, pgY[] = {7, 5, 3, 3, 5, 7};
  //ENUM_LINE_STYLE lineStyle;
  w = (int)ChartGetInteger(0, CHART_WIDTH_IN_PIXELS, 0);
  h = (int)ChartGetInteger(0, CHART_HEIGHT_IN_PIXELS, 0);
  minSize = (int)fmin(w, h);
  point = minSize / 15;
  canvas.CreateBitmapLabel("canvas", 0, 0, w, h, COLOR_FORMAT_XRGB_NOALPHA);

  for (int i = 0; i < (int)plX.Size(); i++)
    plX[i] *= point;
  for (int i = 0; i < (int)plY.Size(); i++)
    plY[i] *= point;
  for (int i = 0; i < (int)pgX.Size(); i++)
    pgX[i] *= point;
  for (int i = 0; i < (int)pgY.Size(); i++)
    pgY[i] *= point;

  canvas.LineStyleSet(STYLE_SOLID);
  drawPrimitives
  canvas.LineStyleSet(STYLE_DOT);
  drawPrimitives
  canvas.LineStyleSet(STYLE_DASH);
  drawPrimitives
  canvas.LineStyleSet(STYLE_DASHDOTDOT);
  drawPrimitives

  Sleep(6000);
  canvas.Destroy();
 }
The highlighted code fragment demonstrates how the style is changed and the drawing methods are called. Let's have a look at the script operation result.
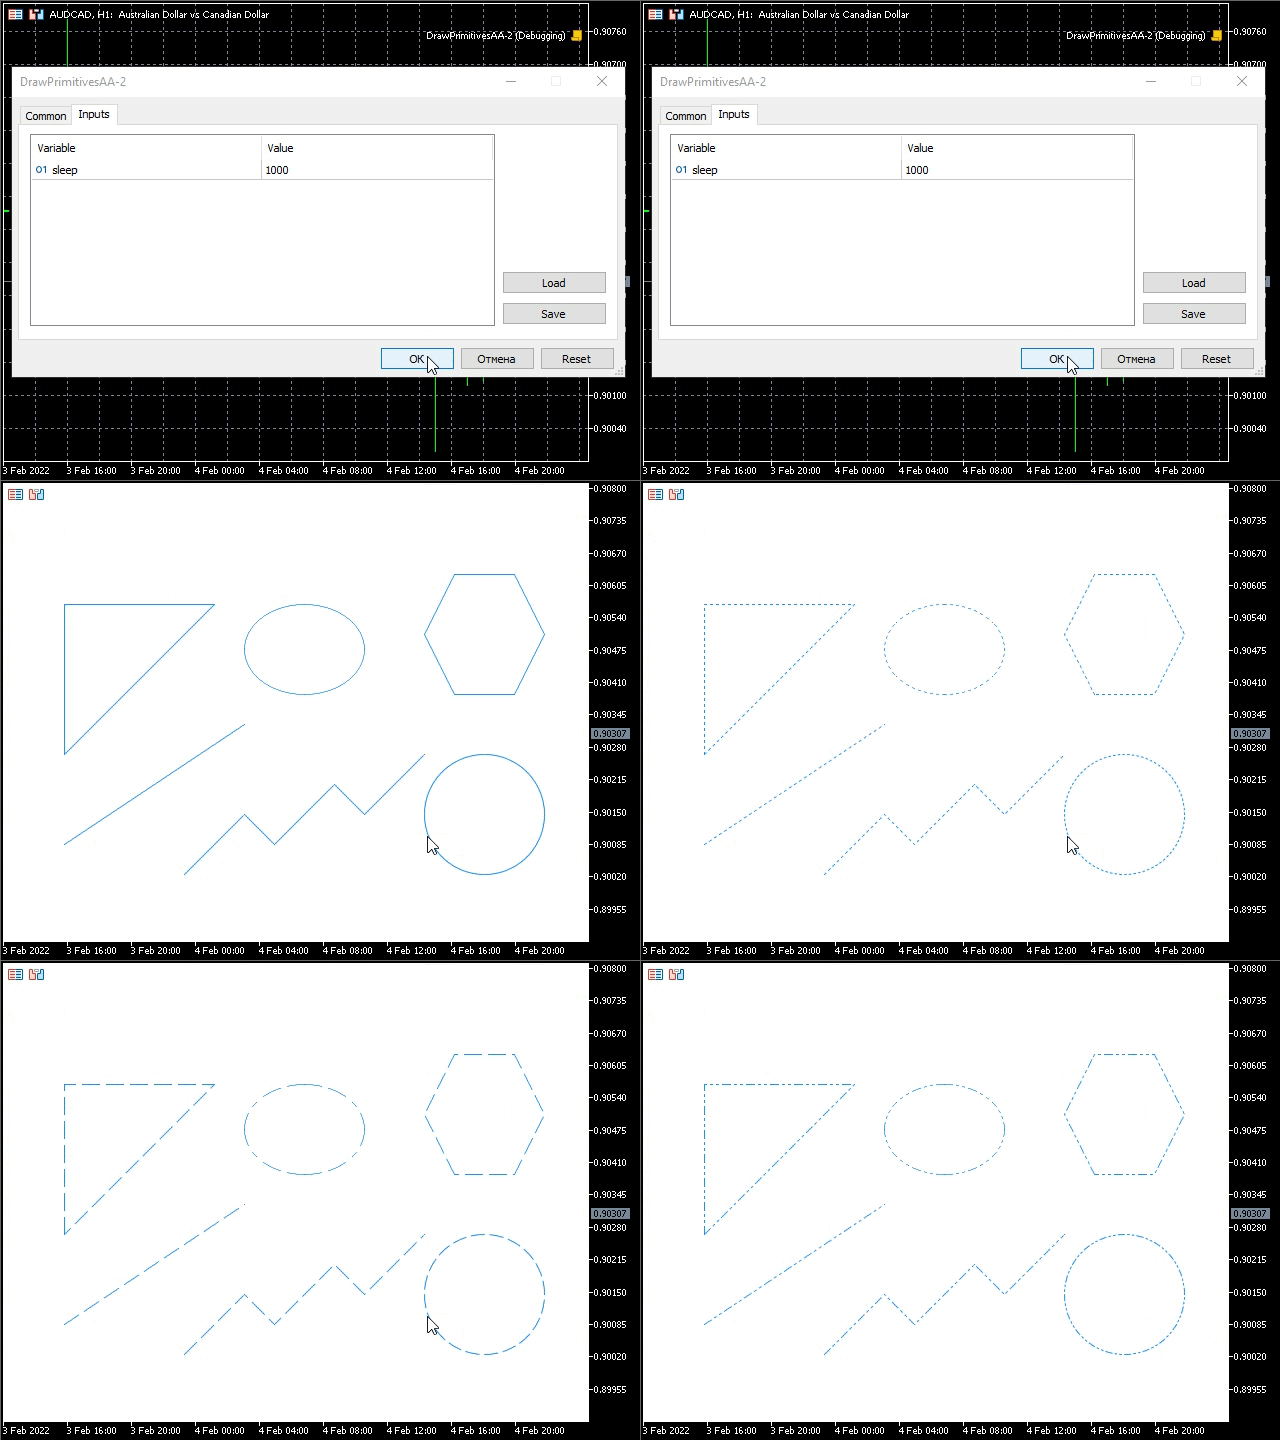
The GIF animation shows the change of the primitive line style with the specified sleep interval.
Now I suggest creating a sample of drawing primitives using the Wu algorithm. Create the DrawPrimitivesWu.mq5 script based on the previous example. Replace the AA symbol combination with Wu and comment out the strings as shown in the listing.
#property script_show_inputs

//--- input parameters
input int sleep = 1000;

//+------------------------------------------------------------------+
//|                                                                  |
//+------------------------------------------------------------------+
#include <Canvas\Canvas.mqh>

//+------------------------------------------------------------------+
//|                                                                  |
//+------------------------------------------------------------------+
#define drawPrimitives canvas.Erase(ColorToARGB(clrWhite, 255));                               \
  canvas.LineWu(point * 2, point * 12, point * 8, point * 8, color_);                          \
  canvas.PolylineWu(plX, plY, color_);                                                         \
  canvas.PolygonWu(pgX, pgY, color_);                                                          \
  canvas.TriangleWu(point * 2, point * 9, point * 2, point * 4, point * 7, point * 4, color_); \
  canvas.CircleWu(point * 16, point * 11, point * 2, color_);                                  \
  canvas.EllipseWu(point * 8, point * 4, point * 12, point * 7, color_);                       \
  canvas.Update(true);                                                                         \
  Sleep(sleep);

//+------------------------------------------------------------------+
//| Script program start function                                    |
//+------------------------------------------------------------------+
void OnStart()
 {
  CCanvas canvas;
  int w, h;
  int minSize, point;
  uint color_ = ColorToARGB(clrDodgerBlue, 255);
  uint fillColor = ColorToARGB(clrRed, 255);
  int plX[] = {6, 8, 9, 11, 12, 14}, plY[] = {13, 11, 12, 10, 11, 9};
  int pgX[] = {15, 14, 15, 17, 18, 17}, pgY[] = {7, 5, 3, 3, 5, 7};
  //ENUM_LINE_STYLE lineStyle;
  w = (int)ChartGetInteger(0, CHART_WIDTH_IN_PIXELS, 0);
  h = (int)ChartGetInteger(0, CHART_HEIGHT_IN_PIXELS, 0);
  minSize = (int)fmin(w, h);
  point = minSize / 15;

  canvas.CreateBitmapLabel("canvas", 0, 0, w, h, COLOR_FORMAT_XRGB_NOALPHA);

  for (int i = 0; i < (int)plX.Size(); i++)
    plX[i] *= point;
  for (int i = 0; i < (int)plY.Size(); i++)
    plY[i] *= point;
  for (int i = 0; i < (int)pgX.Size(); i++)
    pgX[i] *= point;
  for (int i = 0; i < (int)pgY.Size(); i++)
    pgY[i] *= point;

  canvas.LineStyleSet(STYLE_SOLID);
  drawPrimitives
  //canvas.LineStyleSet(STYLE_DOT);
  //drawPrimitives
  //canvas.LineStyleSet(STYLE_DASH);
  //drawPrimitives
  //canvas.LineStyleSet(STYLE_DASHDOTDOT);
  //drawPrimitives

  Sleep(6000);
  canvas.Destroy();
 }
All added methods are highlighted in yellow. Run the example to see the result.
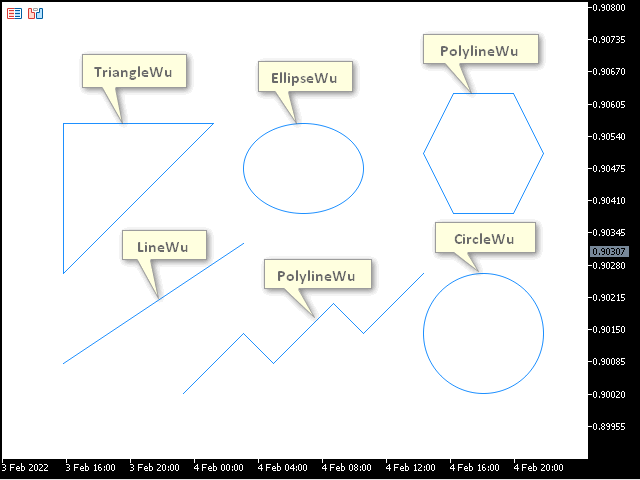
We can see that the drawing quality has improved again thanks to smoothing using the Wu algorithm. Now uncomment the strings in the script and launch it again.
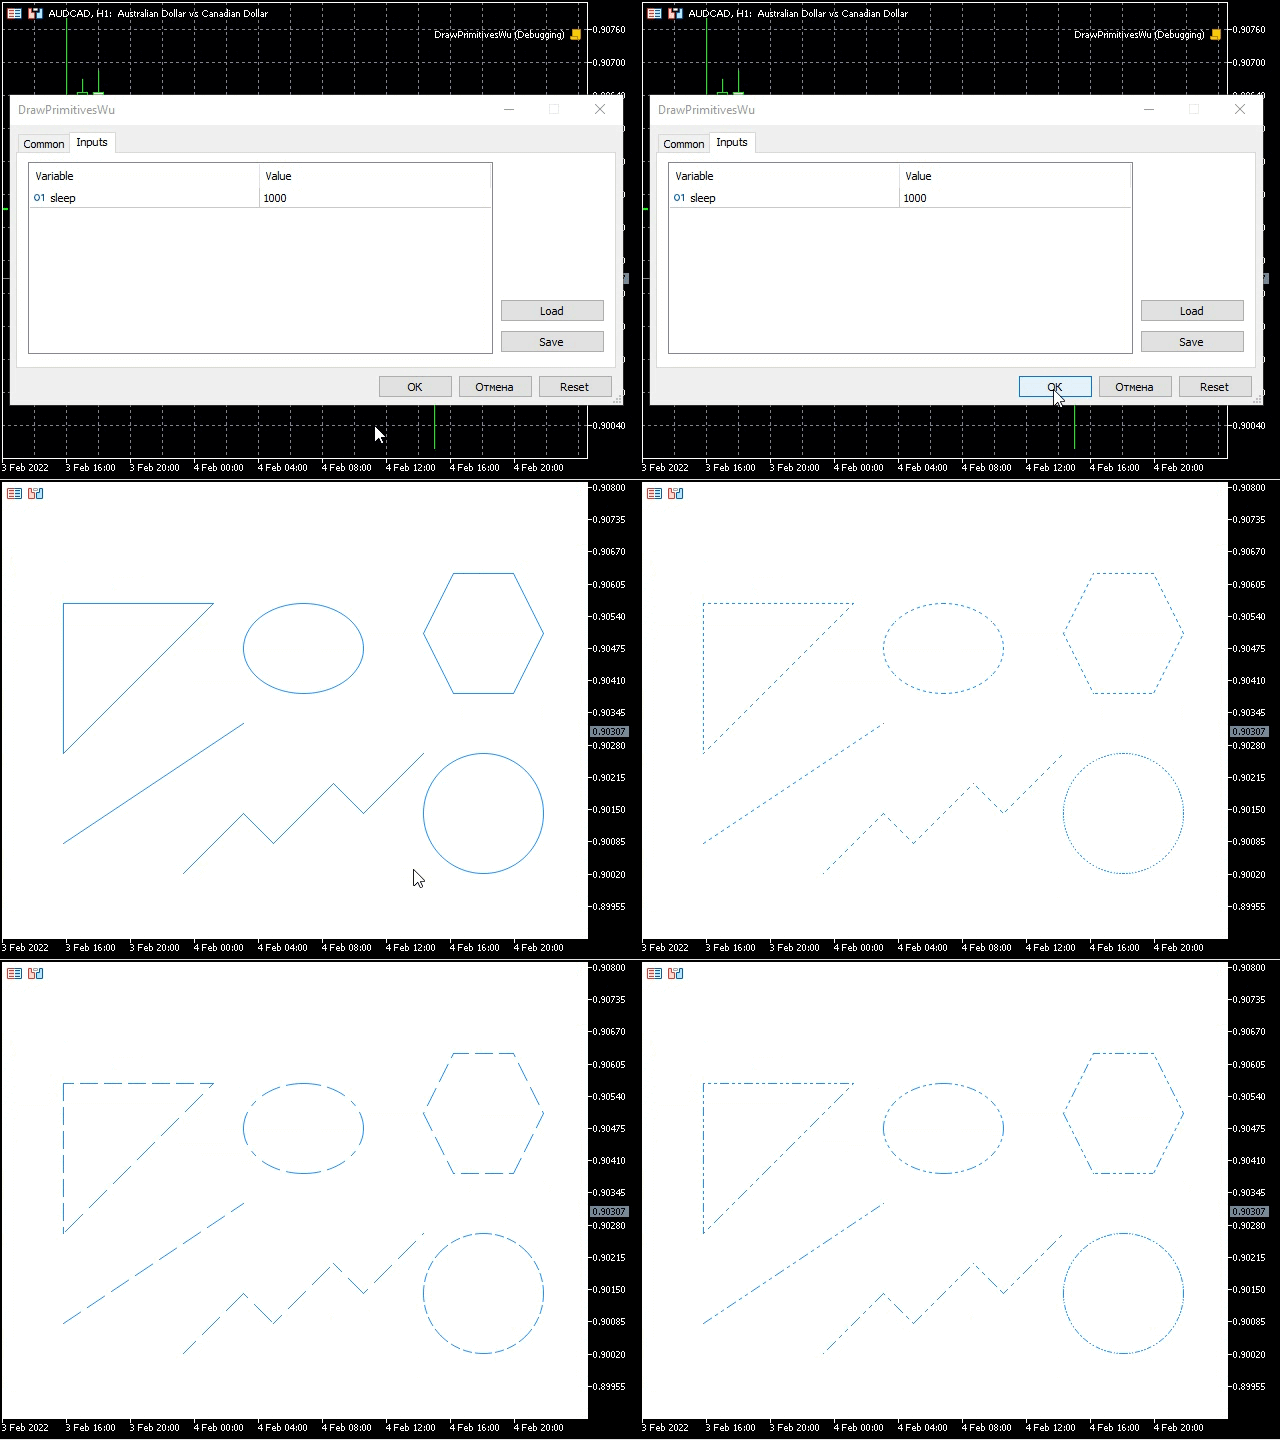
The line styles changes just like in the previous example but the quality of smoothing primitive images is higher.
Drawing primitives with changeable line width
Create the script based on the previous example and name it DrawPrimitivesThick.mq5. Replace the existing primitive drawing methods with methods featuring the "Thick" prefix and remove the methods having no analogs as displayed in the listing. Comment out the unnecessary strings like in the previous example.
#property script_show_inputs

//--- input parameters
input int sleep = 1000;

//+------------------------------------------------------------------+
//|                                                                  |
//+------------------------------------------------------------------+
#include <Canvas\Canvas.mqh>

//+------------------------------------------------------------------+
//|                                                                  |
//+------------------------------------------------------------------+
#define drawPrimitives canvas.Erase(ColorToARGB(clrWhite, 255));                                      \
  canvas.LineThickVertical(point, point, h - point, color_, size, lineStyle, endStyle);               \
  canvas.LineThickHorizontal(point, w - point, h - point, color_, size, lineStyle, endStyle);         \
  canvas.LineThick(point * 2, point * 12, point * 8, point * 8, color_, size, lineStyle, endStyle);   \
  canvas.PolylineThick(plX, plY, color_, size, lineStyle, endStyle);                                  \
  canvas.PolygonThick(pgX, pgY, color_, size, lineStyle, endStyle);                                   \
  canvas.Update(true);                                                                                \
  Sleep(sleep);

//+------------------------------------------------------------------+
//| Script program start function                                    |
//+------------------------------------------------------------------+
void OnStart()
 {
  CCanvas canvas;
  int w, h;
  int minSize, point;
  uint color_ = ColorToARGB(clrDodgerBlue, 255);
  uint fillColor = ColorToARGB(clrRed, 255);
  int plX[] = {6, 8, 9, 11, 12, 14}, plY[] = {13, 11, 12, 10, 11, 9};
  int pgX[] = {17, 18, 17, 15, 14, 15, 17}, pgY[] = {7, 5, 3, 3, 5, 7, 7};
  ENUM_LINE_STYLE lineStyle = STYLE_SOLID;
  int size = 3;
  ENUM_LINE_END endStyle = LINE_END_ROUND;
  w = (int)ChartGetInteger(0, CHART_WIDTH_IN_PIXELS, 0);
  h = (int)ChartGetInteger(0, CHART_HEIGHT_IN_PIXELS, 0);
  minSize = (int)fmin(w, h);
  point = minSize / 15;
  canvas.CreateBitmapLabel("canvas", 0, 0, w, h, COLOR_FORMAT_XRGB_NOALPHA);

  for (int i = 0; i < (int)plX.Size(); i++)
    plX[i] *= point;
  for (int i = 0; i < (int)plY.Size(); i++)
    plY[i] *= point;
  for (int i = 0; i < (int)pgX.Size(); i++)
    pgX[i] *= point;
  for (int i = 0; i < (int)pgY.Size(); i++)
    pgY[i] *= point;

  canvas.LineStyleSet(STYLE_SOLID);
  drawPrimitives
  //canvas.LineStyleSet(STYLE_DOT);
  //drawPrimitives
  //canvas.LineStyleSet(STYLE_DASH);
  //drawPrimitives
  //canvas.LineStyleSet(STYLE_DASHDOTDOT);
  drawPrimitives

  Sleep(6000);
  canvas.Destroy();
 }
The added methods are highlighted in yellow. As you may have already noticed, the methods we consider feature two additional parameters: size - line width and end_style - line completion style. Run the script and have a look at the result.
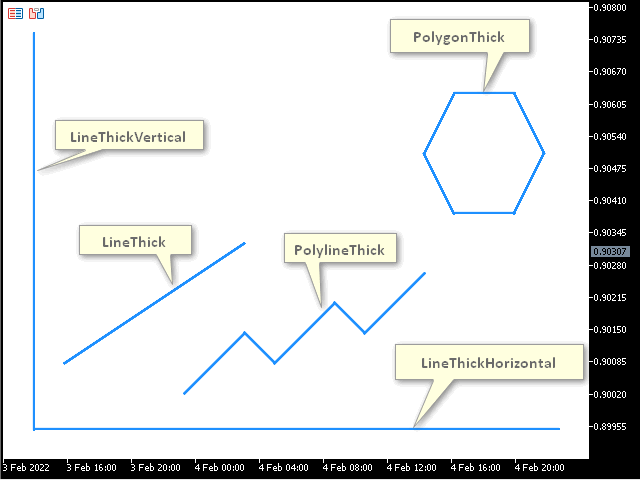
The image displays the primitives with thick lines whose width can be changed as mentioned above. Create the script based on the previous one and name it DrawPrimitivesThick-2.mq5. It will allow us to see all possible combinations of line width, line styles and line completion styles. To achieve this, uncomment the previously commented out strings and add them to the method1 macro where we will change the line completion style and call the method0 macro after each change. We will call the primitive drawing methods in the method0 macro. In the drawPrimitives macro, we will change the line style and call method1 after each line style change. The drawPrimitives macro is called in the loop where the line width is changed in a specified range.
#property script_show_inputs

//--- input parameters
input int sleep = 1000;
input int beginSize = 1;
input int endSize = 4;

//+------------------------------------------------------------------+
//|                                                                  |
//+------------------------------------------------------------------+
#include <Canvas\Canvas.mqh>

//+------------------------------------------------------------------+
//|                                                                  |
//+------------------------------------------------------------------+
#define drawPrimitives lineStyle = STYLE_SOLID; \
  method1                                       \
  lineStyle = STYLE_DOT;                        \
  method1                                       \
  lineStyle = STYLE_DASH;                       \
  method1                                       \
  lineStyle = STYLE_DASHDOTDOT;                 \
  method1

#define method1 endStyle = LINE_END_ROUND; \
  method0                                  \
  endStyle = LINE_END_BUTT;                \
  method0                                  \
  endStyle = LINE_END_SQUARE;              \
  method0

#define method0 canvas.Erase(ColorToARGB(clrWhite, 255));                                                                                                      \
  canvas.LineThickVertical(point, point, h - point, color_, size, lineStyle, endStyle);                                                                        \
  canvas.LineThickHorizontal(point, w - point, h - point, color_, size, lineStyle, endStyle);                                                                  \
  canvas.LineThick(point * 2, point * 12, point * 8, point * 8, color_, size, lineStyle, endStyle);                                                            \
  canvas.PolylineThick(plX, plY, color_, size, lineStyle, endStyle);                                                                                           \
  canvas.PolygonThick(pgX, pgY, color_, size, lineStyle, endStyle);                                                                                            \
  canvas.TextOut(point * 2, point, "Size: " + (string)size + "; Style: " + EnumToString(lineStyle) + "; End Style: " + EnumToString(endStyle) + ";", color_);  \
  canvas.Update(true);                                                                                                                                         \
  Sleep(sleep);

//+------------------------------------------------------------------+
//| Script program start function                                    |
//+------------------------------------------------------------------+
void OnStart()
 {
  CCanvas canvas;
  int w, h;
  int minSize, point;
  uint color_ = ColorToARGB(clrDodgerBlue, 255);
  uint fillColor = ColorToARGB(clrRed, 255);
  int plX[] = {6, 8, 9, 11, 12, 14}, plY[] = {13, 11, 12, 10, 11, 9};
  int pgX[] = {17, 18, 17, 15, 14, 15, 17}, pgY[] = {7, 5, 3, 3, 5, 7, 7};
  ENUM_LINE_STYLE lineStyle = STYLE_SOLID;
  int size = 3;
  ENUM_LINE_END endStyle = LINE_END_ROUND;
  w = (int)ChartGetInteger(0, CHART_WIDTH_IN_PIXELS, 0);
  h = (int)ChartGetInteger(0, CHART_HEIGHT_IN_PIXELS, 0);
  minSize = (int)fmin(w, h);
  point = minSize / 15;
  canvas.CreateBitmapLabel("canvas", 0, 0, w, h, COLOR_FORMAT_XRGB_NOALPHA);
  canvas.FontSet("Calibri", -120);

  for (int i = 0; i < (int)plX.Size(); i++)
    plX[i] *= point;
  for (int i = 0; i < (int)plY.Size(); i++)
    plY[i] *= point;
  for (int i = 0; i < (int)pgX.Size(); i++)
    pgX[i] *= point;
  for (int i = 0; i < (int)pgY.Size(); i++)
    pgY[i] *= point;

  for (int i = beginSize; i <= endSize; i++) {
    size = i;
    drawPrimitives
  }

  Sleep(6000);
  canvas.Destroy();
 }
//+------------------------------------------------------------------+
All code changes are highlighted in yellow. The resulting script takes the line width range from the beginSize and endSize input parameters and moves along all possible line style and completion combination options using the macros. As a result, we get an enumeration of all possible primitive line parameters whose combinations can be seen by running the script. The following GIF animation shows the script operation result.
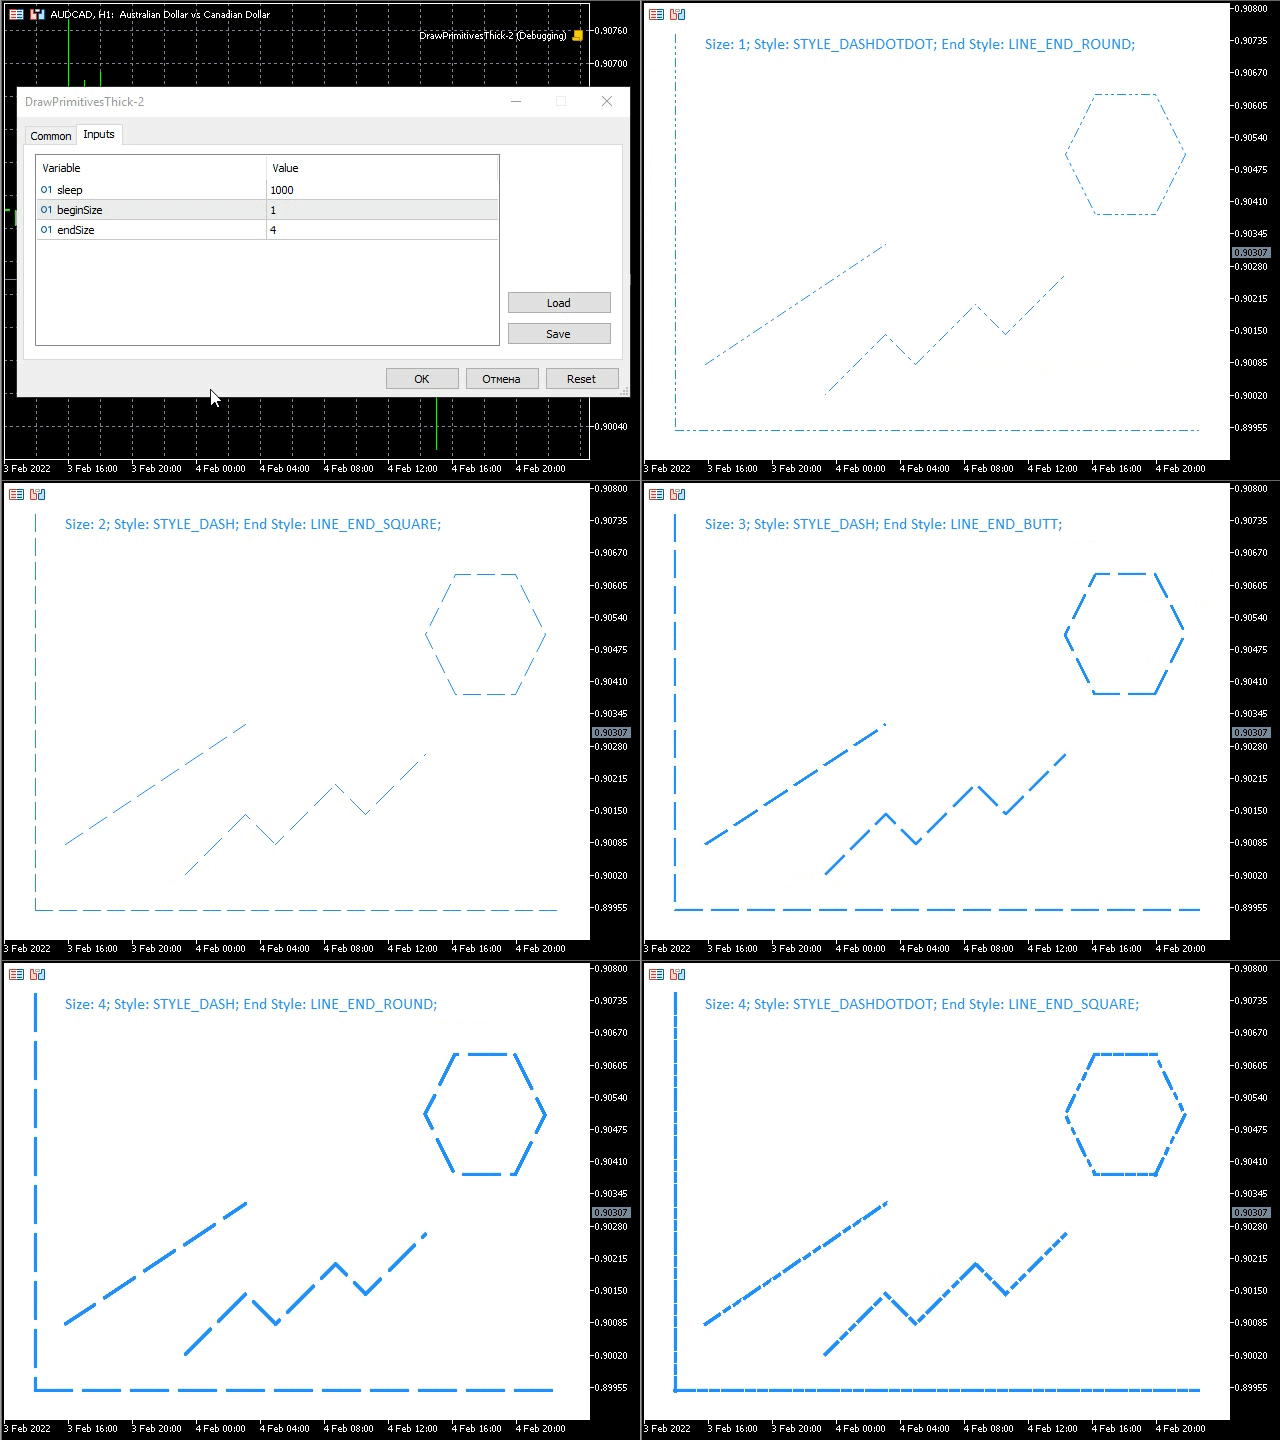
The animation shows the changes in line width, line style and line completion style. All these parameters are displayed on Canvas and we are able to see them as well.
Drawing smothed primitives according to the Bézier algorithm with a changeable line width
Let's use one of our previous examples DrawPrimitivesThick.mq5 and create a script DrawPrimitivesSmooth.mq5. Replace the PolylineThick and PolygonThick with PolylineSmooth and PolygonSmooth in the script. Move the coordinates of the polyline and polygon two squares left so that the primitives are displayed roughly at the center.
void OnStart()
 {
  CCanvas canvas;
  int w, h;
  int minSize, point;
  uint color_ = ColorToARGB(clrDodgerBlue, 255);
  uint fillColor = ColorToARGB(clrRed, 255);
  int plX[] = {3, 5, 6, 8, 9, 11}, plY[] = {13, 11, 12, 10, 11, 9};
  int pgX[] = {14, 15, 14, 12, 11, 12}, pgY[] = {7, 5, 3, 3, 5, 7};
The changed values are highlighted in the listing. The resulting script should look as follows.
#property script_show_inputs

//--- input parameters
input int sleep = 1000;

//+------------------------------------------------------------------+
//|                                                                  |
//+------------------------------------------------------------------+
#include <Canvas\Canvas.mqh>

//+------------------------------------------------------------------+
//|                                                                  |
//+------------------------------------------------------------------+
#define drawPrimitives canvas.Erase(ColorToARGB(clrWhite, 255));                                      \
  canvas.PolylineSmooth(plX, plY, color_, size, lineStyle, endStyle);                                 \
  canvas.PolygonSmooth(pgX, pgY, color_, size, lineStyle, endStyle);                                  \
  canvas.Update(true);                                                                                \
  Sleep(sleep);

//+------------------------------------------------------------------+
//| Script program start function                                    |
//+------------------------------------------------------------------+
void OnStart()
 {
  CCanvas canvas;
  int w, h;
  int minSize, point;
  uint color_ = ColorToARGB(clrDodgerBlue, 255);
  uint fillColor = ColorToARGB(clrRed, 255);
  int plX[] = {3, 5, 6, 8, 9, 11}, plY[] = {13, 11, 12, 10, 11, 9};
  int pgX[] = {14, 15, 14, 12, 11, 12}, pgY[] = {7, 5, 3, 3, 5, 7};
  ENUM_LINE_STYLE lineStyle = STYLE_SOLID;
  int size = 3;
  ENUM_LINE_END endStyle = LINE_END_BUTT;
  w = (int)ChartGetInteger(0, CHART_WIDTH_IN_PIXELS, 0);
  h = (int)ChartGetInteger(0, CHART_HEIGHT_IN_PIXELS, 0);
  minSize = (int)fmin(w, h);
  point = minSize / 15;
  canvas.CreateBitmapLabel("canvas", 0, 0, w, h, COLOR_FORMAT_XRGB_NOALPHA);

  for (int i = 0; i < (int)plX.Size(); i++)
    plX[i] *= point;
  for (int i = 0; i < (int)plY.Size(); i++)
    plY[i] *= point;
  for (int i = 0; i < (int)pgX.Size(); i++)
    pgX[i] *= point;
  for (int i = 0; i < (int)pgY.Size(); i++)
    pgY[i] *= point;

  canvas.LineStyleSet(STYLE_SOLID);
  drawPrimitives

  Sleep(6000);
  canvas.Destroy();
 }
Run the example and check the result.
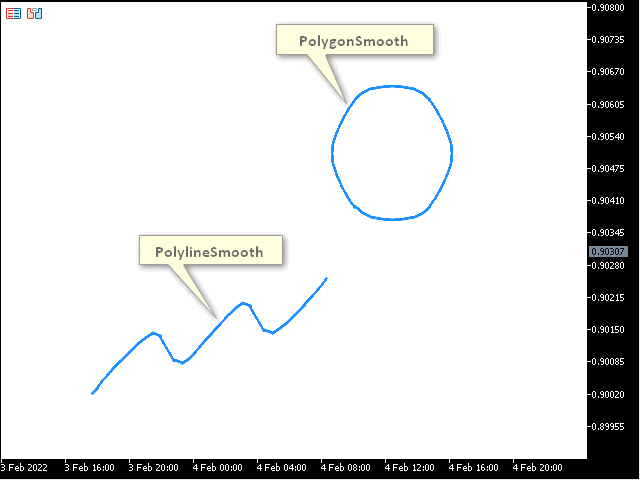
We can see a polyline and polygon built using Bézier curves. The PolylineSmooth and PolygonSmooth methods feature the tension parameters - smoothing and step - approximation step Bezier curves are based on. Let's create an example, in which these parameters are changed after specified intervals and the screen shows the results of these changes. Let's use the DrawPrimitivesThick-2.mq5 example and create the DrawPrimitivesSmooth-2.mq5 script based on it. Let's have a look at the result.
#property script_show_inputs

//+------------------------------------------------------------------+
//|                                                                  |
//+------------------------------------------------------------------+
#include <Canvas\Canvas.mqh>

//--- input parameters
input int sleep = 1000;
input int lineSize = 3;
input ENUM_LINE_STYLE lineStyle = STYLE_SOLID;
input ENUM_LINE_END lineEndStyle = LINE_END_BUTT;
input double minTension = 0.0;
input double stepTension = 0.1;
input double maxTension = 1.0;
input double minStep = 1.0;
input double stepStep = 5.0;
input double maxStep = 21.0;

//+------------------------------------------------------------------+
//| Script program start function                                    |
//+------------------------------------------------------------------+
void OnStart()
 {
  CCanvas canvas;
  int w, h;
  int minSize, point;
  uint color_ = ColorToARGB(clrDodgerBlue, 255);
  uint fillColor = ColorToARGB(clrRed, 255);
  int plX[] = {3, 5, 6, 8, 9, 11}, plY[] = {13, 11, 12, 10, 11, 9};
  int pgX[] = {14, 15, 14, 12, 11, 12}, pgY[] = {7, 5, 3, 3, 5, 7};
  ENUM_LINE_STYLE style = lineStyle;
  int size = lineSize;
  ENUM_LINE_END endStyle = lineEndStyle;
  w = (int)ChartGetInteger(0, CHART_WIDTH_IN_PIXELS, 0);
  h = (int)ChartGetInteger(0, CHART_HEIGHT_IN_PIXELS, 0);
  minSize = (int)fmin(w, h);
  point = minSize / 15;
  canvas.CreateBitmapLabel("canvas", 0, 0, w, h, COLOR_FORMAT_XRGB_NOALPHA);
  canvas.FontSet("Calibri", -120);

  for (int i = 0; i < (int)plX.Size(); i++)
    plX[i] *= point;
  for (int i = 0; i < (int)plY.Size(); i++)
    plY[i] *= point;
  for (int i = 0; i < (int)pgX.Size(); i++)
    pgX[i] *= point;
  for (int i = 0; i < (int)pgY.Size(); i++)
    pgY[i] *= point;

  for (double tension = minTension; tension <= maxTension; tension += stepTension)
    for (double step = minStep; step <= maxStep; step += stepStep)
     {
       canvas.Erase(ColorToARGB(clrWhite, 255));
       canvas.PolylineSmooth(plX, plY, color_, size, style, endStyle, tension, step);
       canvas.PolygonSmooth(pgX, pgY, color_, size, style, endStyle, tension, step);
       canvas.TextOut(point * 2, point, "Size: " + (string)size + "; Style: " + EnumToString(style) + "; End Style: " + EnumToString(endStyle) + ";", color_);
       canvas.TextOut(point * 2, point * 2, "Tension: " + DoubleToString(tension, 2) + ";" + " Step: " + DoubleToString(step, 2) + ";", color_);
       canvas.Update(true);
       Sleep(sleep);
     }

  canvas.Destroy();
 }
As we can see, the code has been changed almost completely. The following settings have appeared among the input parameters: lineSize - line size, lineStyle - line style and lineEndStyle - line completion style (now they do not take part in the loop). Besides, there are also input parameters for setting drawing parameters of Bézier curves: minTension, maxTension and stepTension (tension smoothing parameter range and value step), as well as minStep, maxStep and stepStep (step approximation step range and value step). Further on, these parameters work in the loops setting all possible tension and step parameter combinations according to the specified stepTension and stepStep ones accordingly. Run the example and see the result.
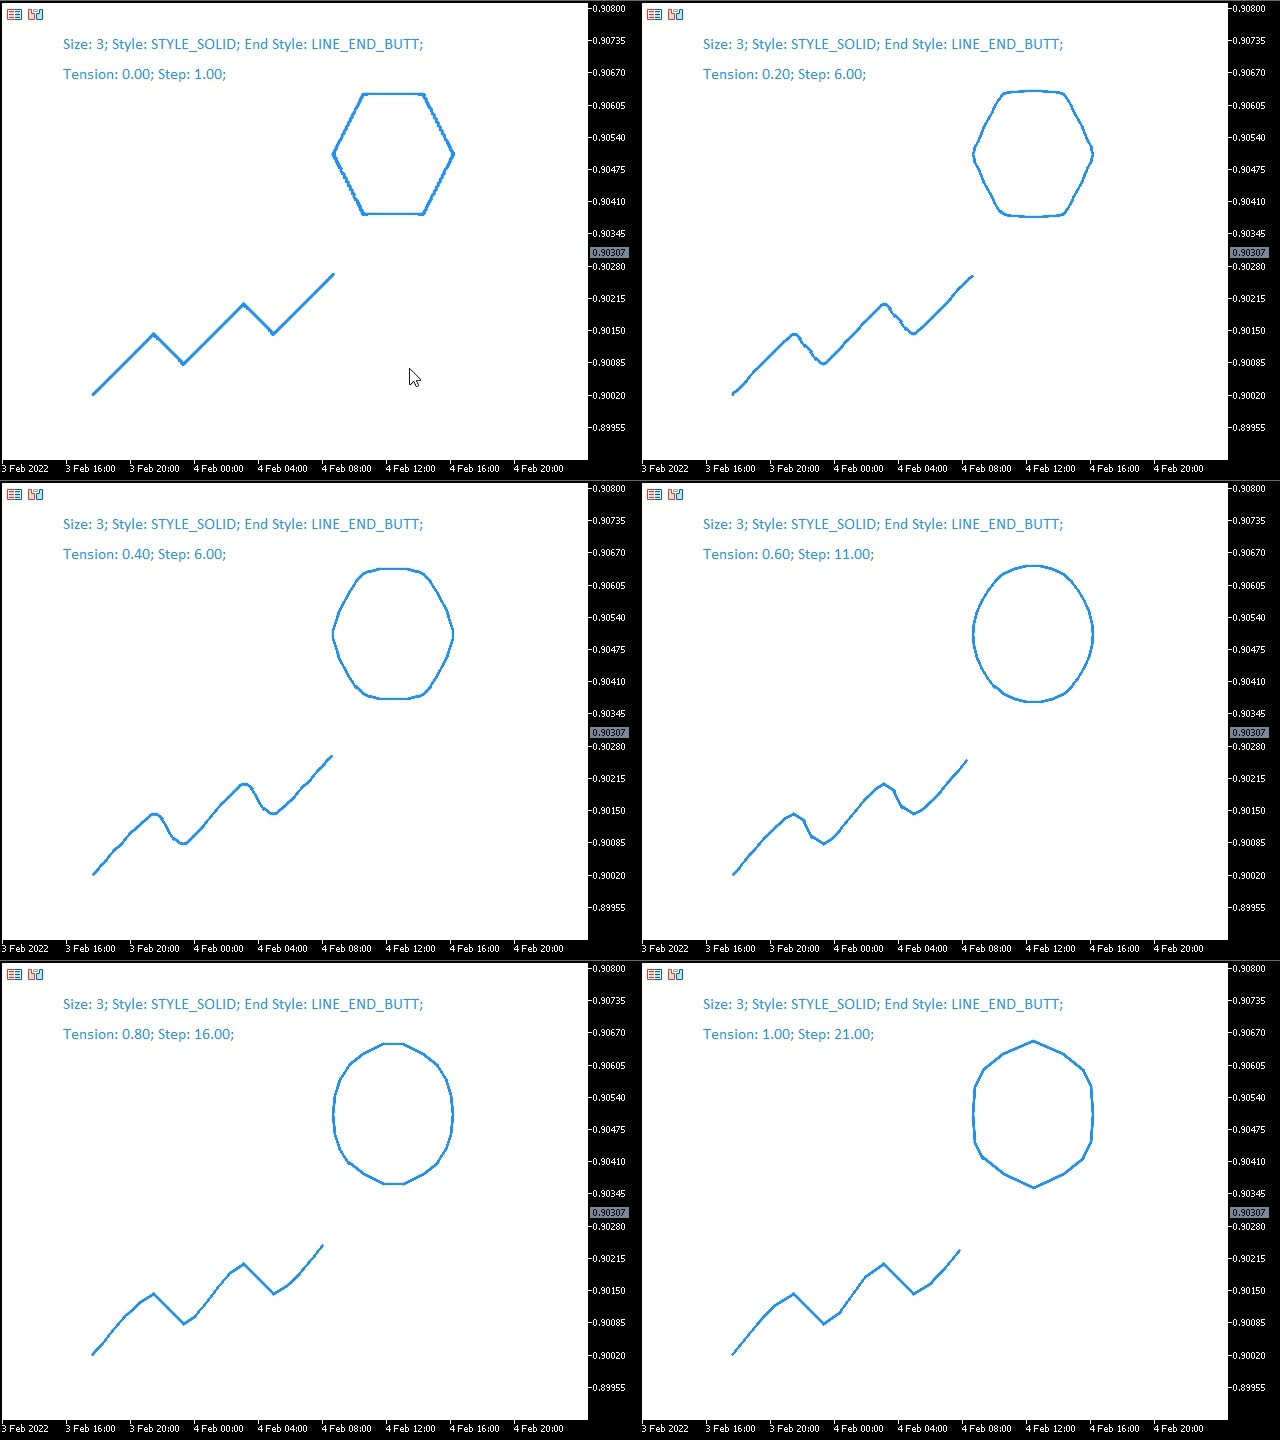
The GIF animation displays smoothed primitives with changeable smoothing parameters whose values are displayed in the second line on the image.
Draws filled primitives
When developing graphical applications, you may want to fill a primitive. The CCanvas class features methods with the Fill prefix for that case. These methods paint the appropriate primitives in a uniform color. Let's use the previous example DrawPrimitivesWu.mq5 to create the script DrawPrimitivesFill.mq5 featuring all coordinates for the necessary primitives so that we only have to insert the appropriate methods and set the filling color. Insert the FillPolygon, FillTriangle, FillCircle and FillEllipse methods. The Fill method will be described below (when considering the filling). Let's have a look at the resulting code.
void OnStart()
 {
  CCanvas canvas;
  int w, h;
  int minSize, point;
  uint fillColor = ColorToARGB(clrRed, 255);
  int pgX[] = {4, 5, 7, 8, 7, 5}, pgY[] = {12, 10, 10, 12, 14, 14};
  w = (int)ChartGetInteger(0, CHART_WIDTH_IN_PIXELS, 0);
  h = (int)ChartGetInteger(0, CHART_HEIGHT_IN_PIXELS, 0);
  minSize = (int)fmin(w, h);
  point = minSize / 15;
  canvas.CreateBitmapLabel("canvas", 0, 0, w, h, COLOR_FORMAT_XRGB_NOALPHA);

  for (int i = 0; i < (int)pgX.Size(); i++)
    pgX[i] *= point;
  for (int i = 0; i < (int)pgY.Size(); i++)
    pgY[i] *= point;

  canvas.Erase(ColorToARGB(clrWhite, 255));
  canvas.FillPolygon(pgX, pgY, fillColor);
  canvas.FillTriangle(point * 4, point * 8, point * 4, point * 3, point * 9, point * 3, fillColor);
  canvas.FillCircle(point * 13, point * 12, point * 2, fillColor);
  canvas.FillEllipse(point * 11, point * 3, point * 15, point * 6, fillColor);
  canvas.Update(true);

  Sleep(6000);
  canvas.Destroy();
 }
All changed and added strings are highlighted in yellow. Launch the script to see the result.
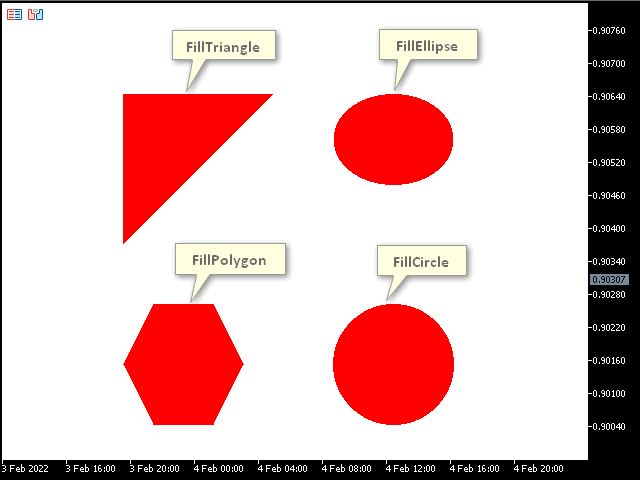
The image displays the primitives filled with a uniform color. Above them, we can draw ordinary primitives as a border or the primitives with an editable line style we considered above.
Filling
If you ever used the Fill tool in graphical editors, you might already know what I am going to talk about. It is time to have a look at the Fill method I mentioned above. This is the method allowing us to fill the image area of a certain color with another color. Let's create a new example as an indicator (since it handles the chart events (OnChartEvent) in contrast to the script). You might ask why we need to handle chart events here? We will create an example allowing you to select the filling color and click at any image point to fill it with the selected color. Create a new indicator and name it Filling.mq5. Let's have a look at the indicator code.
#property indicator_chart_window
#property indicator_plots 0

//+------------------------------------------------------------------+
//|                                                                  |
//+------------------------------------------------------------------+
#include <Canvas\Canvas.mqh>
#include <ChartObjects\ChartObjectsTxtControls.mqh>

//+------------------------------------------------------------------+
//|                                                                  |
//+------------------------------------------------------------------+
CCanvas canvas;
CChartObjectButton colors[14];
CChartObjectButton * oldSelected = NULL;
uint fillColor = 0;

//+------------------------------------------------------------------+
//| Custom indicator initialization function                         |
//+------------------------------------------------------------------+
int OnInit()
 {
  int w, h;
  int minSize, point;
  uint Color1 = ColorToARGB(clrDodgerBlue, 255);
  uint Color2 = ColorToARGB(clrRed, 255);
  int pgX[] = {4, 5, 7, 8, 7, 5}, pgY[] = {12, 10, 10, 12, 14, 14};
  w = (int)ChartGetInteger(0, CHART_WIDTH_IN_PIXELS, 0);
  h = (int)ChartGetInteger(0, CHART_HEIGHT_IN_PIXELS, 0);
  minSize = (int)fmin(w, h);
  point = minSize / 15;

  canvas.CreateBitmapLabel("canvas", 0, 0, w, h, COLOR_FORMAT_XRGB_NOALPHA);

  canvas.FontSet("Calibri", -120);

  for (int i = 0; i < (int)pgX.Size(); i++)
    pgX[i] *= point;
  for (int i = 0; i < (int)pgY.Size(); i++)
    pgY[i] *= point;

  canvas.Erase(ColorToARGB(clrWhite, 255));
  canvas.Polygon(pgX, pgY, Color1);
  canvas.FillTriangle(point * 4, point * 8, point * 4, point * 3, point * 9, point * 3, Color2);
  canvas.FillCircle(point * 13, point * 12, point * 2, Color2);
  canvas.Ellipse(point * 11, point * 3, point * 15, point * 6, Color1);
  canvas.Update(true);

  ChartSetInteger(0, CHART_EVENT_MOUSE_MOVE, true);

  for (int i = 0; i < (int)colors.Size(); i++)
   {
    colors[i].Create(0, "color-"+(string)i, 0, (int)((i + 2.8) * point), point, 21, 21);
    colors[i].SetInteger(OBJPROP_BGCOLOR, ColorToARGB(CCanvas::GetDefaultColor(i), 0));
   }

  if ((oldSelected = GetPointer(colors[(int)colors.Size()-1])) == NULL)
    return(INIT_FAILED);
  oldSelected.State(1);
  fillColor = ColorToARGB((color)oldSelected.GetInteger(OBJPROP_BGCOLOR), 255);

  return(INIT_SUCCEEDED);
 }

//+------------------------------------------------------------------+
//| Custom indicator deinitialization function                       |
//+------------------------------------------------------------------+
void OnDeinit(const int reason)
 {
  canvas.Destroy();
 }

//+------------------------------------------------------------------+
//| Custom indicator iteration function                              |
//+------------------------------------------------------------------+
int OnCalculate(const int rates_total,
                const int prev_calculated,
                const int begin,
                const double &price[])
 {
//---
//--- return value of prev_calculated for next call
  return(rates_total);
 }
//+------------------------------------------------------------------+
//| ChartEvent function                                              |
//+------------------------------------------------------------------+
void OnChartEvent(const int id,
                  const long &lparam,
                  const double &dparam,
                  const string &sparam)
 {
  uint mouseState = (uint)sparam;
  int x = (int)lparam, y = (int)dparam;
  CChartObjectButton * colorBtn;
  int left, right, bottom, top;

  if (id == CHARTEVENT_MOUSE_MOVE)
    if ((mouseState & 1) == 1)
     {
      for (int i = 0; i < (int)colors.Size(); i++)
       {
        if ((colorBtn = GetPointer(colors[i])) == NULL)
          return;
        left = colorBtn.X_Distance();
        top = colorBtn.Y_Distance();
        right = left + colorBtn.X_Size() - 1;
        bottom = top + colorBtn.Y_Size() - 1;
        if (x >= left && x <= right && y >= top && y <= bottom) {
          fillColor = ColorToARGB((color)colorBtn.GetInteger(OBJPROP_BGCOLOR), 255);
          if (oldSelected == NULL)
            return;
          oldSelected.State(0);
          oldSelected = GetPointer(colorBtn);
          ChartRedraw();
          return;
        }
       }
      canvas.Fill(x, y, fillColor);
      canvas.Update(true);
     }

 }
How does the example work? First, the canvas variable was specified on the global level for accessing it for the entire duration of the indicator operation.
CCanvas canvas;
The array of 14 buttons allows selecting colors. Pressing one of the buttons defines the filling color.
CChartObjectButton colors[14]; Next, the oldSelected pointer has been declared.
CChartObjectButton * oldSelected = NULL; The following parameter is used to save the pressed button, return it to a starting position or save the filling color.
uint fillColor = 0;
Next, in the OnInit handler, we can see the already familiar code, which creates Canvas and draws primitives on it.
int OnInit()
 {
  int w, h;
  int minSize, point;
  uint Color1 = ColorToARGB(clrDodgerBlue, 255);
  uint Color2 = ColorToARGB(clrRed, 255);
  int pgX[] = {4, 5, 7, 8, 7, 5}, pgY[] = {12, 10, 10, 12, 14, 14};
  w = (int)ChartGetInteger(0, CHART_WIDTH_IN_PIXELS, 0);
  h = (int)ChartGetInteger(0, CHART_HEIGHT_IN_PIXELS, 0);
  minSize = (int)fmin(w, h);
  point = minSize / 15;
  canvas.CreateBitmapLabel("canvas", 0, 0, w, h, COLOR_FORMAT_XRGB_NOALPHA);

  canvas.FontSet("Calibri", -120);

  for (int i = 0; i < (int)pgX.Size(); i++)
    pgX[i] *= point;
  for (int i = 0; i < (int)pgY.Size(); i++)
    pgY[i] *= point;

  canvas.Erase(ColorToARGB(clrWhite, 255));
  canvas.Polygon(pgX, pgY, Color1);
  canvas.FillTriangle(point * 4, point * 8, point * 4, point * 3, point * 9, point * 3, Color2);
  canvas.FillCircle(point * 13, point * 12, point * 2, Color2);
  canvas.Ellipse(point * 11, point * 3, point * 15, point * 6, Color1);
  canvas.Update(true);
...
Handling mouse events is enabled afterwards.
ChartSetInteger(0, CHART_EVENT_MOUSE_MOVE, true);
Next, create the buttons of different colors (to change the filling color).
  for (int i = 0; i < (int)colors.Size(); i++)
   {
    colors[i].Create(0, "color-"+(string)i, 0, (int)((i + 2.8) * point), point, 21, 21);
    colors[i].SetInteger(OBJPROP_BGCOLOR, ColorToARGB(CCanvas::GetDefaultColor(i), 0));
   }
Pay attention to where button colors are taken from. The code fragment is highlighted in yellow. We can see the CCanvas::GetDefaultColor statistical method. By setting the i parameter starting from 0, we are able to get the color palette.
Next, we initialize the link for getting the oldSelected button to the starting position.
  if ((oldSelected = GetPointer(colors[(int)colors.Size()-1])) == NULL)
    return(INIT_FAILED);
  oldSelected.State(1);
The fillColor filling color is initialized.
fillColor = ColorToARGB((color)oldSelected.GetInteger(OBJPROP_BGCOLOR), 255);
Next, chart events are handled in OnChartEvent. The variables for receiving and storing the mouse parameters are declared in it.
void OnChartEvent(const int id,
                  const long &lparam,
                  const double &dparam,
                  const string &sparam)
 {
  uint mouseState = (uint)sparam;
  int x = (int)lparam, y = (int)dparam;
...
Next, the variable is declared, the pointer for storing a pressed button,
CChartObjectButton * colorBtn;
which is defined by the cursor entering the coordinates of the button sides when left-clicking the button. The sides coordinates are stored in the following variables.
int left, right, bottom, top; Next, the CHARTEVENT_MOUSE_MOVE event is tracked, as well as clicking the left mouse button.
  if (id == CHARTEVENT_MOUSE_MOVE)
    if ((mouseState & 1) == 1)
     {
      ...
     }
This is the code, in which the color selection and image filling are performed. Here the loop passes along all the buttons one by one in the colors array defining the button a user has pressed, saving the button color to the fillColor variable and getting the previously pressed button oldSelected to the starting position. Next, we exit the handler (return) since the click has been made on the button rather than on the image to be filled. If the click is made on the image, rather than on one of the colors buttons, the control is passed further and the filling is performed using the Fill method and the selected fillColor color with subsequent image update (the Update method).
  if (id == CHARTEVENT_MOUSE_MOVE)
    if ((mouseState & 1) == 1)
     {
      for (int i = 0; i < (int)colors.Size(); i++)
       {
        if ((colorBtn = GetPointer(colors[i])) == NULL)
          return;
        left = colorBtn.X_Distance();
        top = colorBtn.Y_Distance();
        right = left + colorBtn.X_Size() - 1;
        bottom = top + colorBtn.Y_Size() - 1;
        if (x >= left && x <= right && y >= top && y <= bottom) {
          fillColor = ColorToARGB((color)colorBtn.GetInteger(OBJPROP_BGCOLOR), 255);
          if (oldSelected == NULL)
            return;
          oldSelected.State(0);
          oldSelected = GetPointer(colorBtn);
          ChartRedraw();
          return;
        }
       }
      canvas.Fill(x, y, fillColor);
      canvas.Update(true);
     }
Let's run the resulting example and try performing the filling.
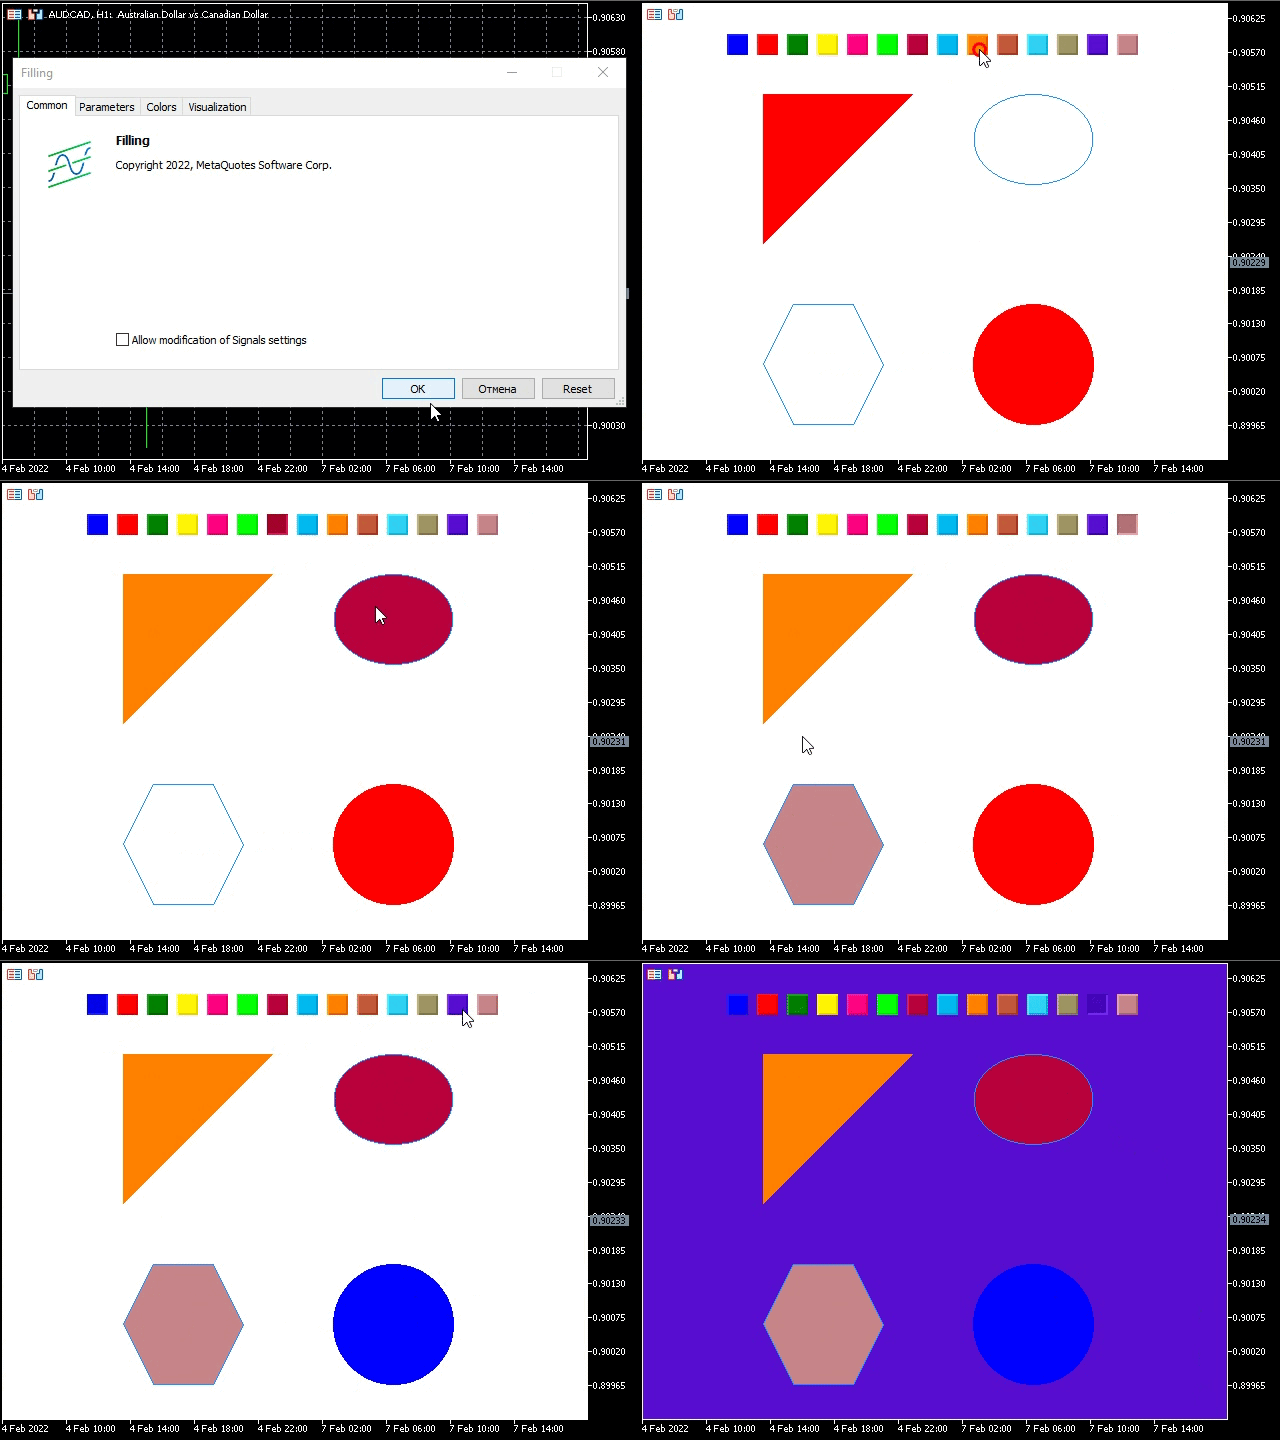
According to the GIF animation, we have created the filling by means of CCanvas working similar to the Fill tool in graphical editors.
Conclusion
The article explored the CCanvas class and described its methods so that users get full understanding of the class operation principles. The provided examples explain the principles of handling the CCanvas class, while clarifying some theory aspects that are difficult to grasp.
Translated from Russian by MetaQuotes Ltd.
Original article: https://www.mql5.com/ru/articles/10361
Warning: All rights to these materials are reserved by MetaQuotes Ltd. Copying or reprinting of these materials in whole or in part is prohibited.
This article was written by a user of the site and reflects their personal views. MetaQuotes Ltd is not responsible for the accuracy of the information presented, nor for any consequences resulting from the use of the solutions, strategies or recommendations described.
 Learn how to design a trading system by Stochastic
 Learn how to design a trading system by MACD
 DirectX Tutorial (Part I): Drawing the first triangle
 Multiple indicators on one chart (Part 01): Understanding the concepts
- Free trading apps
- Over 8,000 signals for copying
- Economic news for exploring financial markets
You agree to website policy and terms of use
Thanks for sharing this article! I would like to learn more about canvas, lots ofproject in mind !
Regards